ERCOT's 4CP Summer Demand Roller Coaster Takes Off as Storage Flips Outcomes
ERCOT's 4CP program is a bellwether for the shifting face of electricity demand and grid services. We explore the new landscape and how real-time data is key for managing the risk of escalating transmission charges.

While certain aspects of the grid’s evolution—renewables, storage, net load, and the need for generator flexibility—have been predicted and (somewhat) planned for over recent decades, other developments, like the rapid growth in overall demand and highly flexible load assets, have caught the system flat-footed.
The friction from these complications doesn’t stop at the minutiae of congestion prices and unit dispatch, but extends into cost allocation via venerable programs such as coincident peak pricing. Growth in highly flexible loads creates a high stakes ouroboros, as large demand centers attempt to predict the peaks and avoid charges, but in turn prevent said peaks from even occurring via their reduction.
While coincident peak programs are common, the individual grids they apply to have wildly varying rules and products. The participants on a given grid also vary widely, and that divergence has only grown in recent years.
For more background on ERCOT’s coincident peak program, the difference between “operational” and settlement values, and what data ERCOT’s 4CP calculation actually uses, check out last year’s blog, Predicting Coincident Peaks in ERCOT’s 4CP Program
The rise of renewables, and solar in particular, has shifted tight conditions from the load peak to the net load peak, while new industries of intense demand such as crypto mining and data centers are capable of far more flexibility than traditional industrial demand. In ERCOT, we see the largest impact from this divergence, which has grown wide enough to attract the interest of the Texas legislature.
When certain resources are very good at avoiding the 4CP intervals, there is an inherent cost shift to other consumers. If those resources are a small portion of total demand, it may not matter much, but as the portion of highly flexible demand assets grows in Texas, the transmission cost shift onto the rest of the base grows along with it.
With ERCOT’s 4CP season back in full swing, we’re taking a look at last year’s surprises, the shifting landscape of demand in Texas, why the program may change in the coming years, and how to better inform your real-time operations throughout the summer.
Storage-Driven Discrepancies
There are two key aspects of ERCOT’s 4CP program that we discussed in our 4CP article last year, but are worth repeating
- The CP Load differs from total load by removing storage charging (wholesale storage load), dc ties flow, and a few other components according to an official formula published by ERCOT.
- The ultimate 4CP interval is calculated after month end once the settlement data is known. This means that in real-time market participants are limited to estimates based on operational data to determine when the peak interval actually was.
Due to the historically minor impacts of the CP adjustments, and the inability to know settlement data until its final, most market participants have relied solely on using top real-time system load reported by ERCOT (we call this “operational load” in the rest of this piece and in our product).
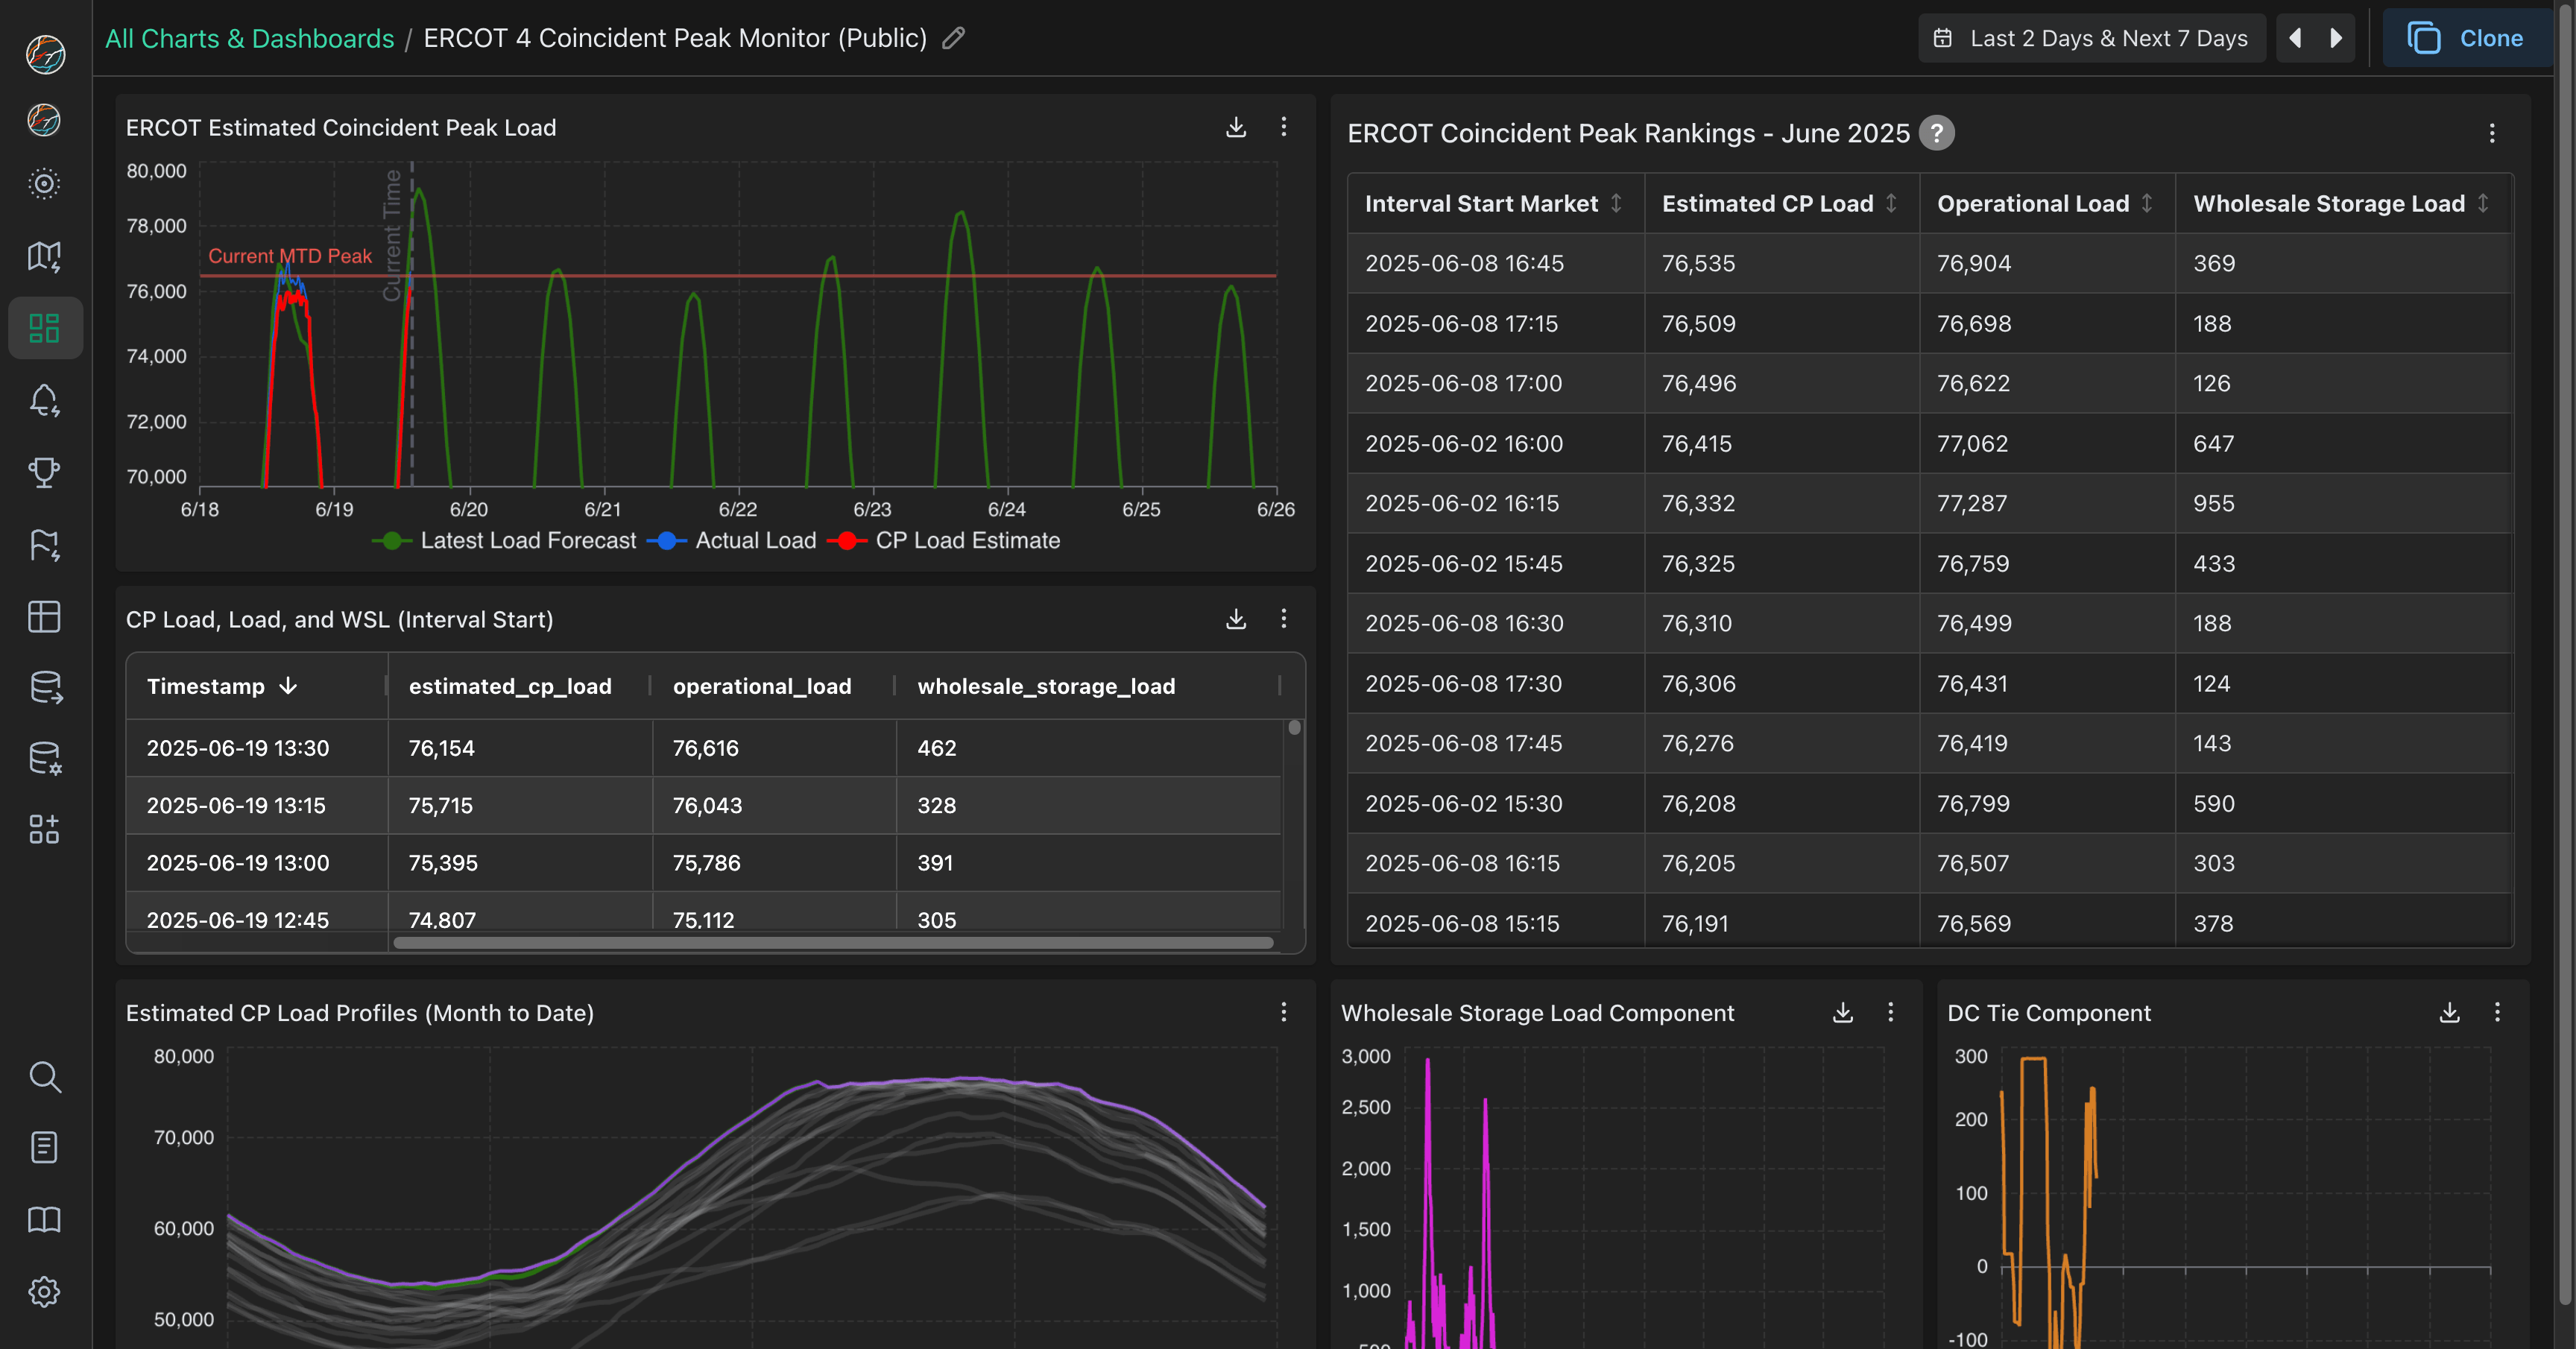
To track peak June intervals in real-time, use our public dashboard, and reach out if you’re interested in continued access throughout the summer.
While there has always been some space for sunlight between the operational load and the top 4CP load interval due to the factors mentioned above, in practice they tended to be the same.
To put in perspective how little the two values differed historically, from 2016 through 2023 the final 4CP intervals in each summer month dropped below the 3rd operational load value only once (to 4th). In this period, 78% of all CP intervals matched the peak operational interval, but 2024 was different.
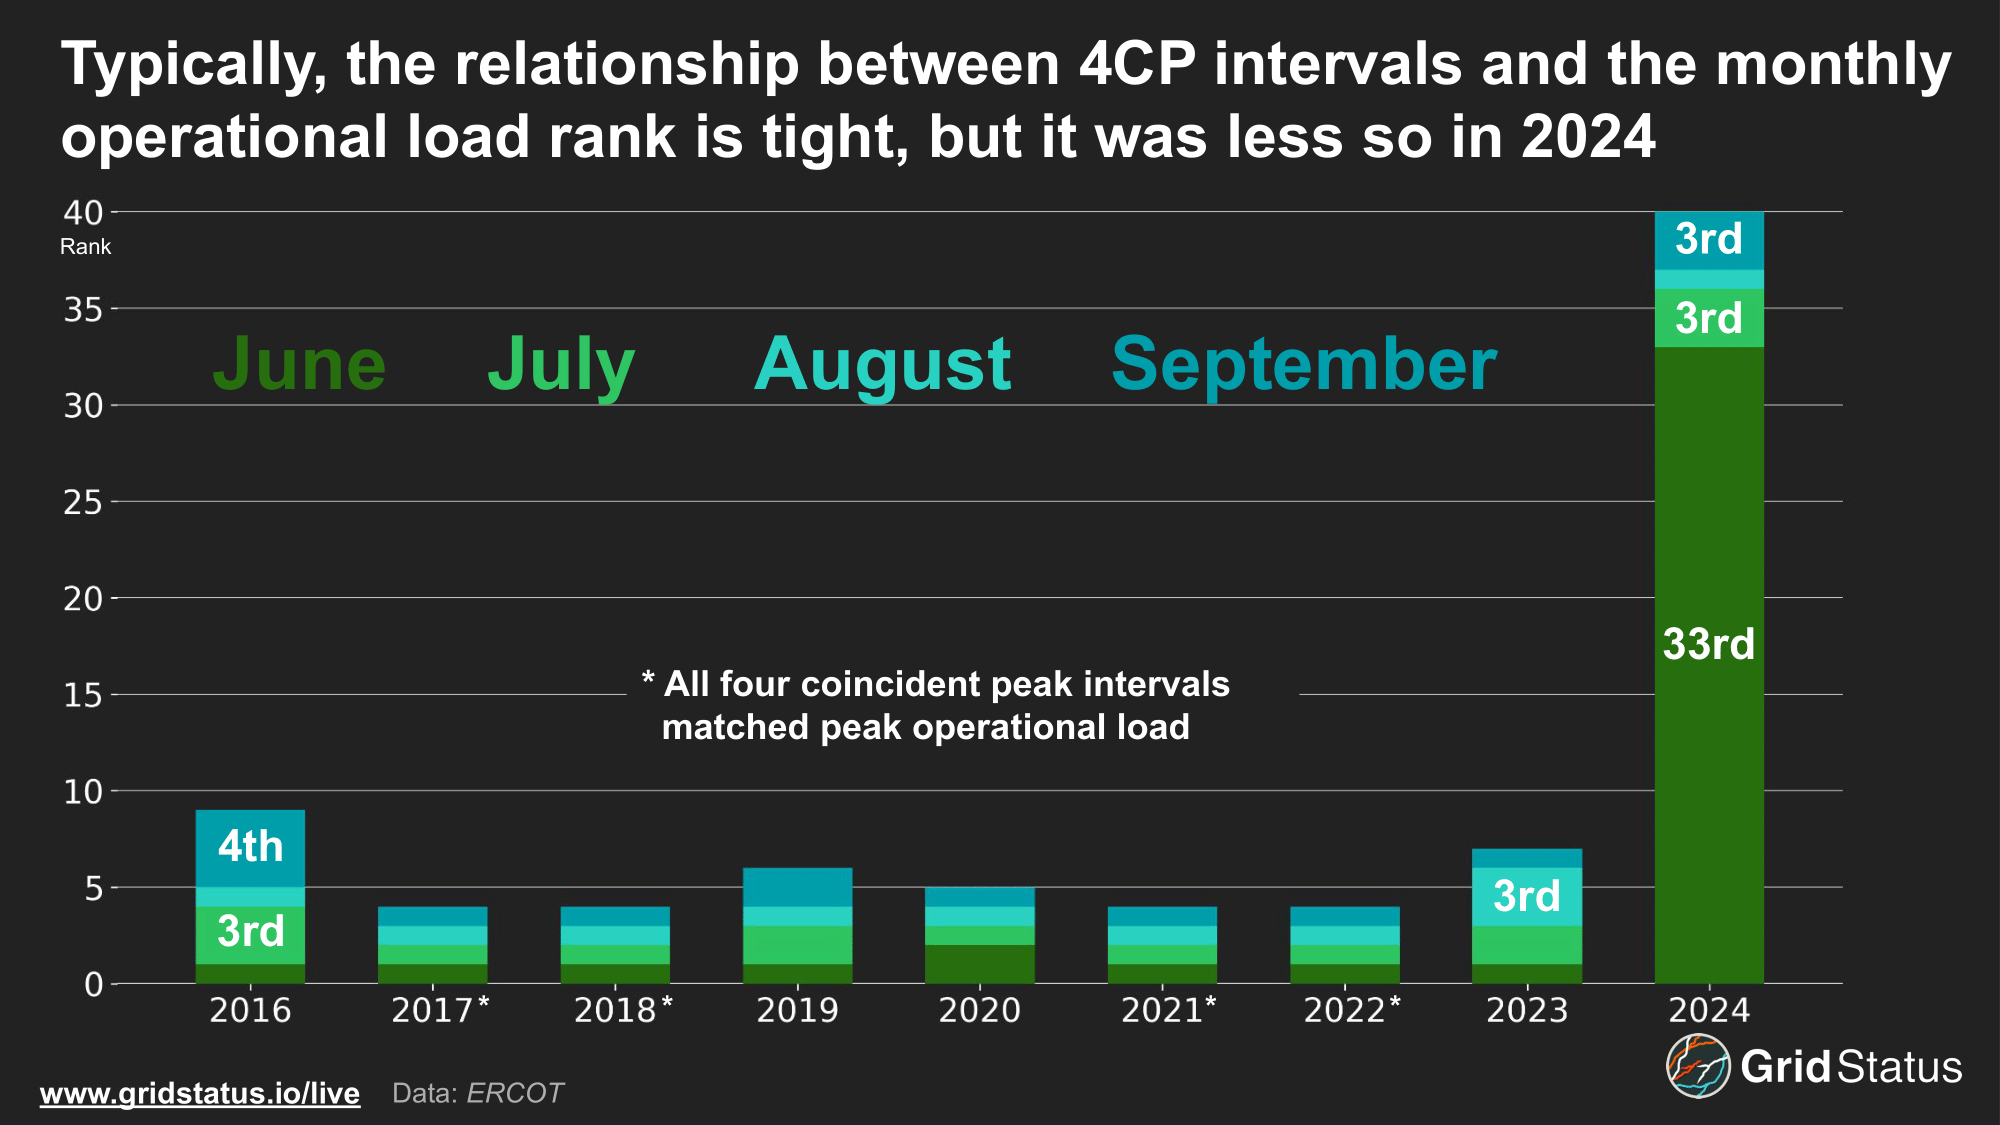
Last year, the official June 4CP interval was ranked 33rd in terms of real-time operational load while July and September were 3rd, matching the previous sum of 3rd place matches since 2016. August was typical with a 1st place ranking match, but in real-time it was also a record-breaking day on the grid (the load was certified after the fact to be several hundred MWs lower than the previous year’s record).
So, if it takes a near-all-time demand record to achieve a match between operational and settlement CP load, how can we track 4CP interval risk in real-time?
Even though ERCOT cannot report final 4CP load in real-time, it can be estimated based on the published definition and the operational datasets that are available. The graph below does just that and compares the two values.
So far in 2025, it is clear that storage load is consistently driving differences in operational and estimated 4CP load across the day, including peak load hours in the lead up to the net load peak. This discrepancy is why we developed an estimated 4CP API feed and dashboard to track each day in real time, which we’ve updated with additional information and modified to use the new 4-second ESR charging and system demand data feed from ERCOT.

While estimated 4CP intervals are typically a paid product, the dashboard is public and free to view through June. You can also clone it to your account to see how it ticks and make modifications.
Last June’s interval surprise may have prompted our 4CP deep dive and ensuing product push, but there’s still more to unpack on that summer, the impact of storage, and the future of the program as a whole.
Storage Embiggens Its Grid Impacts
Battery operations move quickly as hundreds of individual sites compete on marginal MWhs and ancillary service awards in the day-ahead and then over opportunities for arbitrage in real time.
Tracking battery ops in relation to load in real-time enables precision curtailment, allowing asset managers to reduce loss of productivity while still avoiding 4CP intervals. Additionally, understanding the month-to-date interval rankings, after removing storage provides crucial context for the remainder of each month.
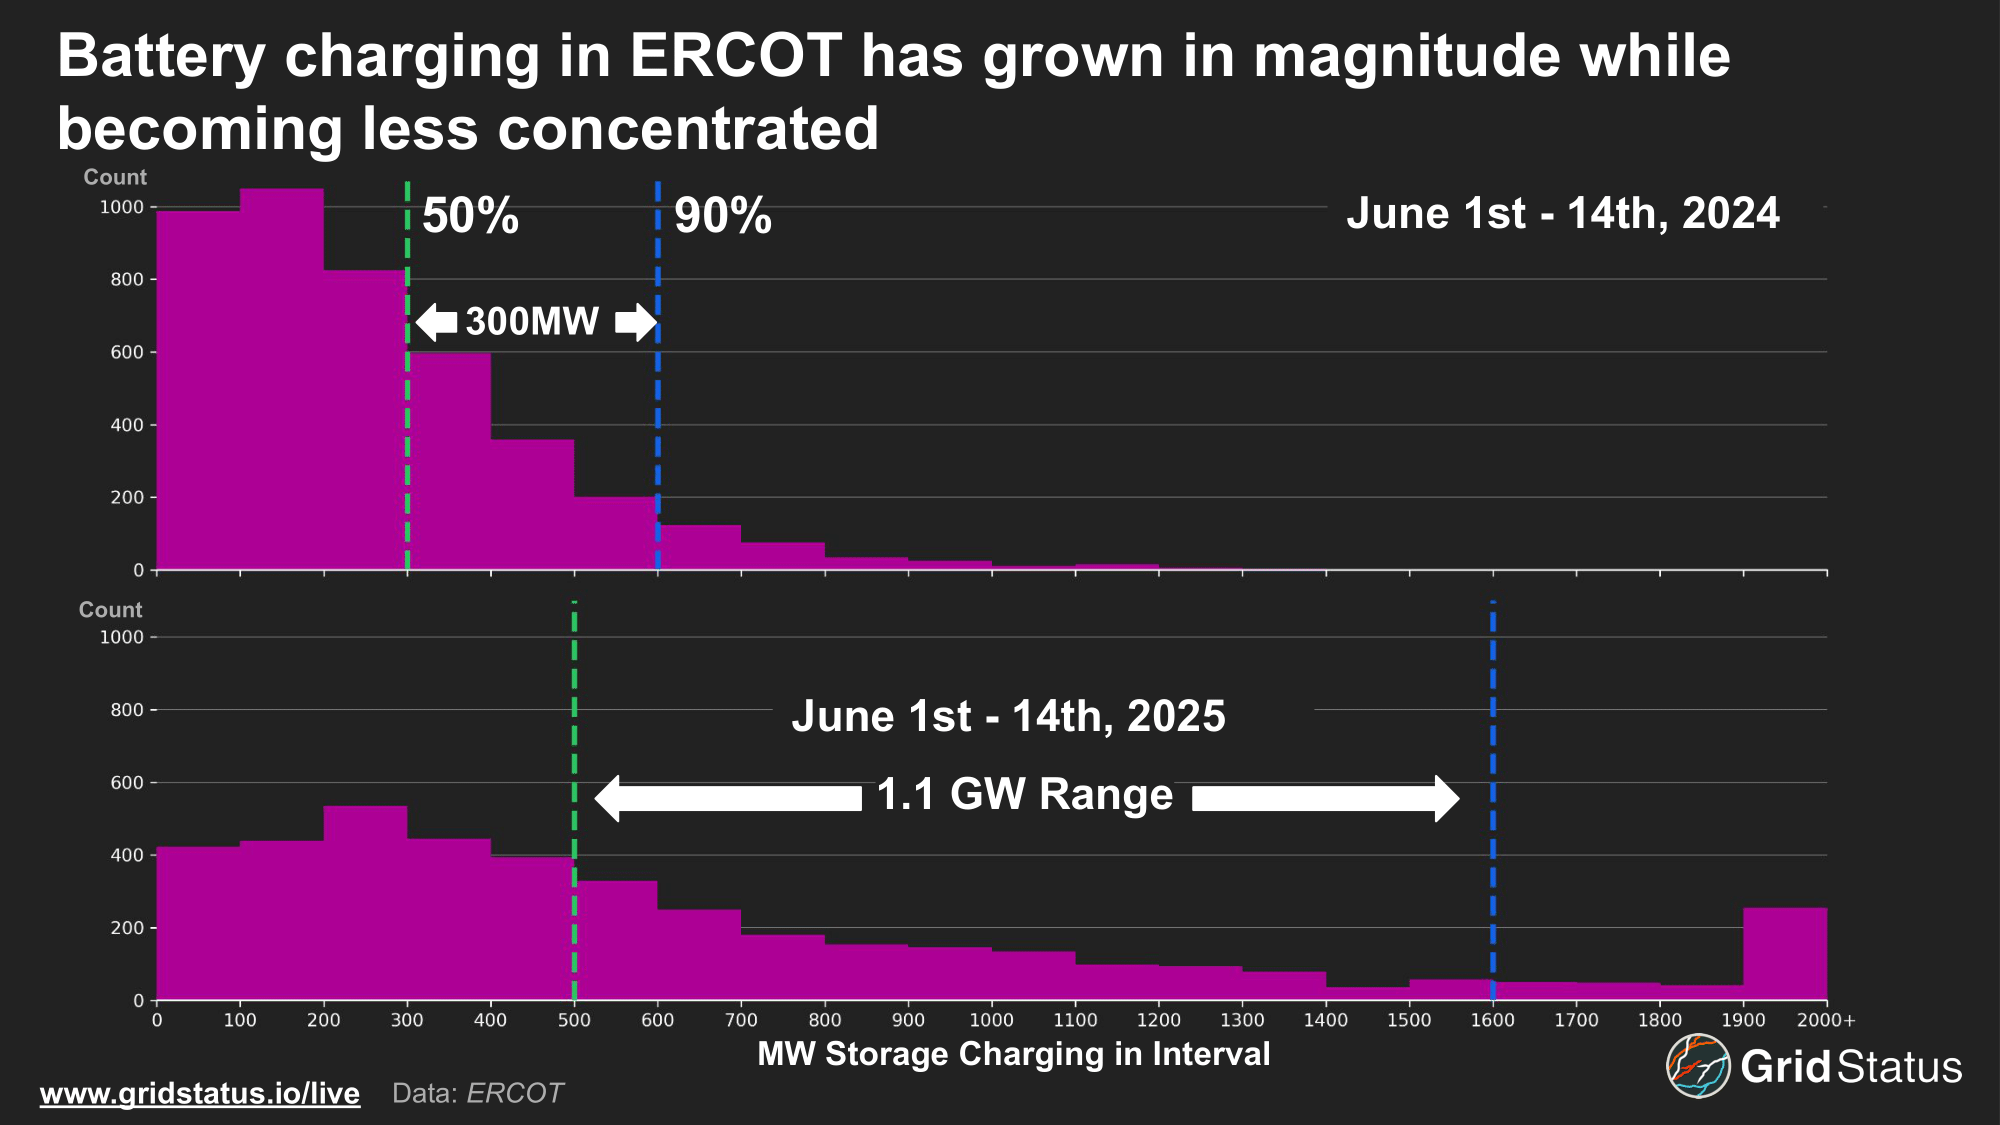
The intensity and distribution of battery charging has changed dramatically in the last year. In the first two weeks of June 2024, 90% of charging intervals were at or below 600MW. Over the same period in 2025, this threshold was at 1600 MW while far fewer intervals had charging of 500 MW or less.
In previous decades, high load meant high prices as summer heat brought the grid to its peak stress while the sun was out. Today, net load peak is the animating factor in systemwide price spikes as solar meets a significant portion of demand at the height of operational load, keeping prices down. This influences battery behavior as well, with operators eyeing the net load peak as their moneymaking intervals.
Over the past year, batteries have become markedly more keen on energy as opposed to ancillary services in ERCOT, as those products have become saturated, placing an even greater emphasis on being available for net load peak, which, in turn, opens the window for more charging at depressed prices during the actual load peak.
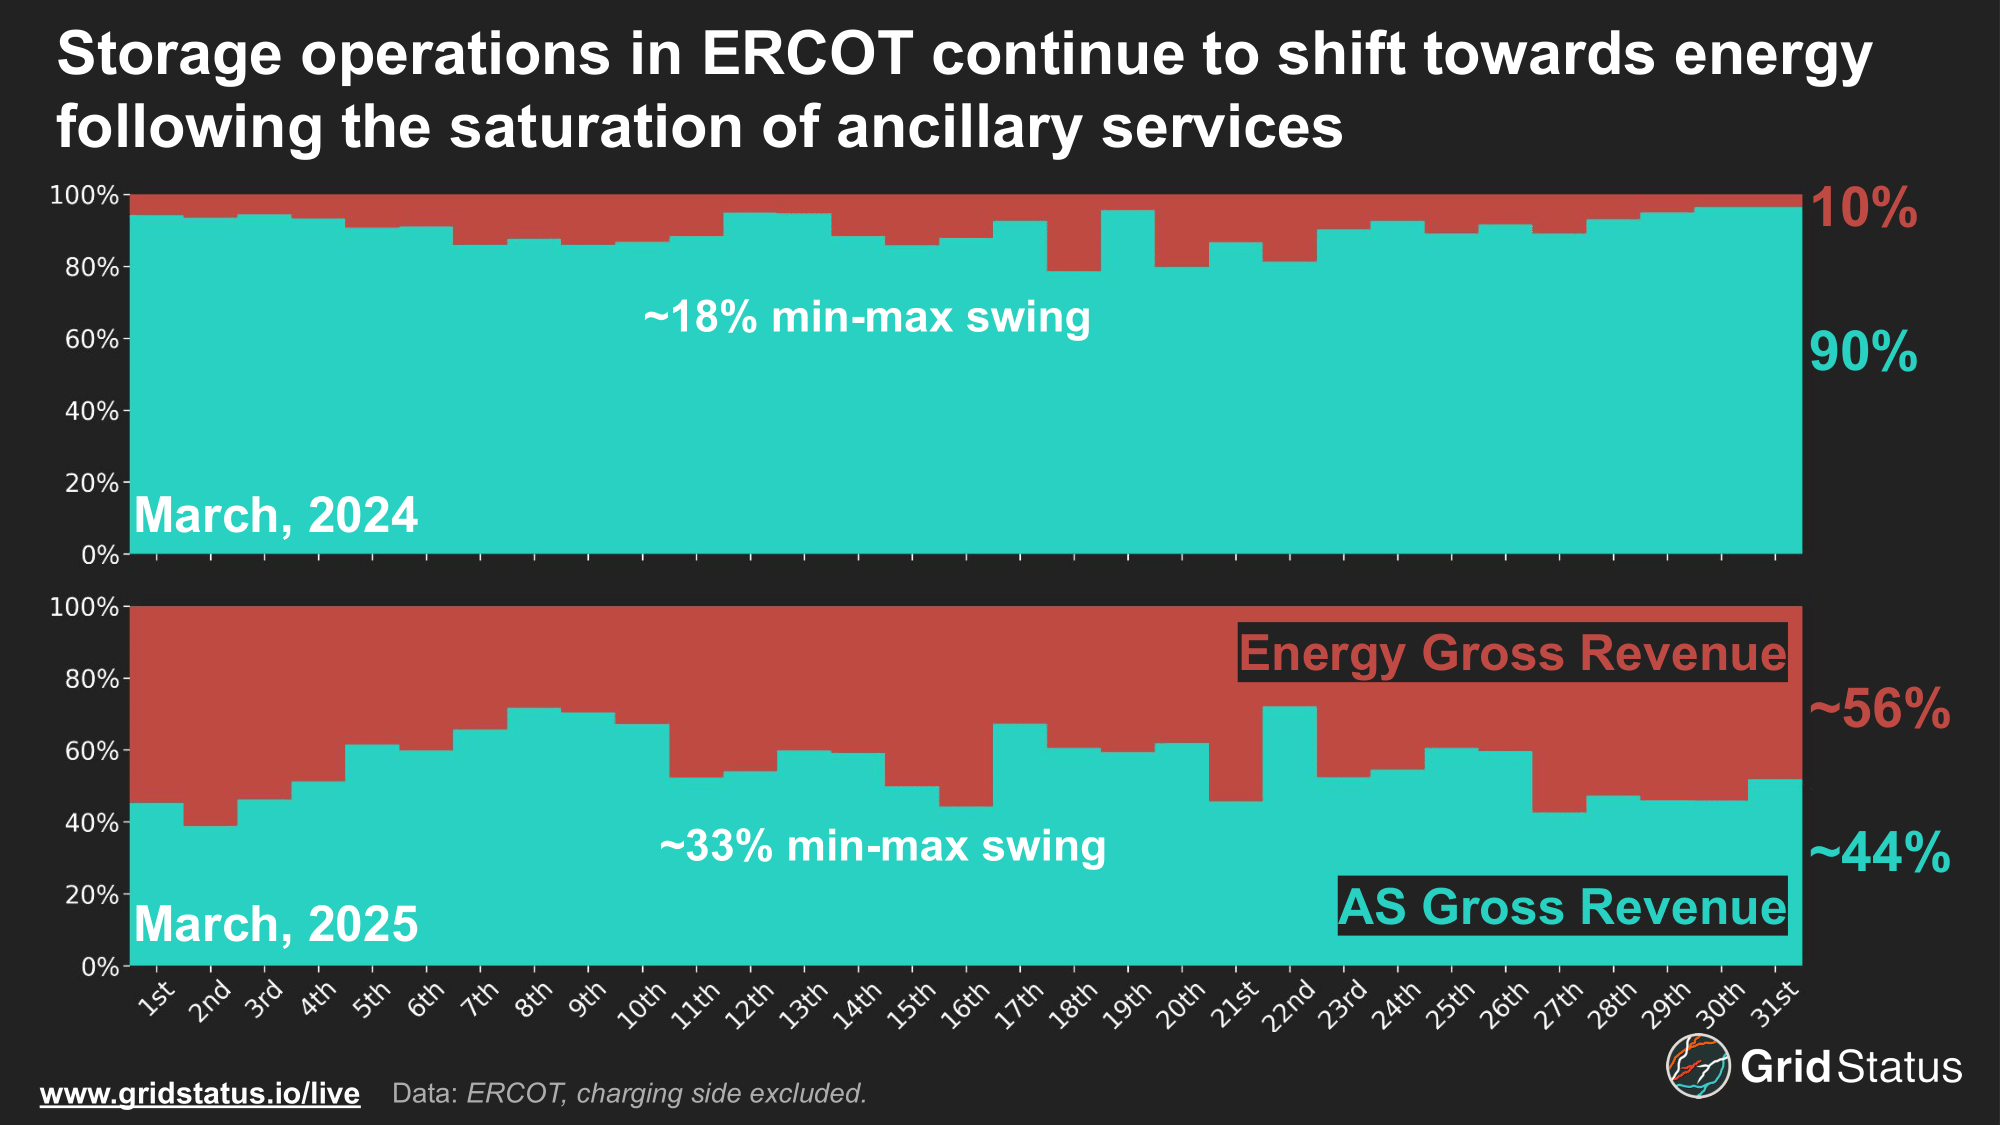
With the 60-Day DAM Generation data, we can see how batteries chose to participate in the day-ahead of March 2024 and 2025. On average, more (gross) day-ahead revenue came from energy arbitrage than ancillary services, increasing by more than 5x from the previous year, while the range between min and max values nearly doubled, demonstrating the wide swings in daily operations throughout a given month.
Tx Gon’ Give It To Ya
There are some basic truisms about coincident peak intervals in Texas: they’re highly correlated with temperatures, flexible loads curtail if there’s even a chance of peak, and they’re not on weekends.
That last one may have been why, despite temperatures pinned near 100° at Love Field for most of the late afternoon, very few large consumers adjusted their demand on June 30th, 2024. 100° is hot for June, about 5° over average, but it was also 5° below the record. For the first Sunday coincident peak interval, you might expect a more oppressive temperature, so what happened?
Asset operators and demand managers generally thought the peak had already been hit a few days earlier, on 6/27. Many large loads continued to drop demand in peak hours over the next few days, but nearly all failed to do so on Sunday.
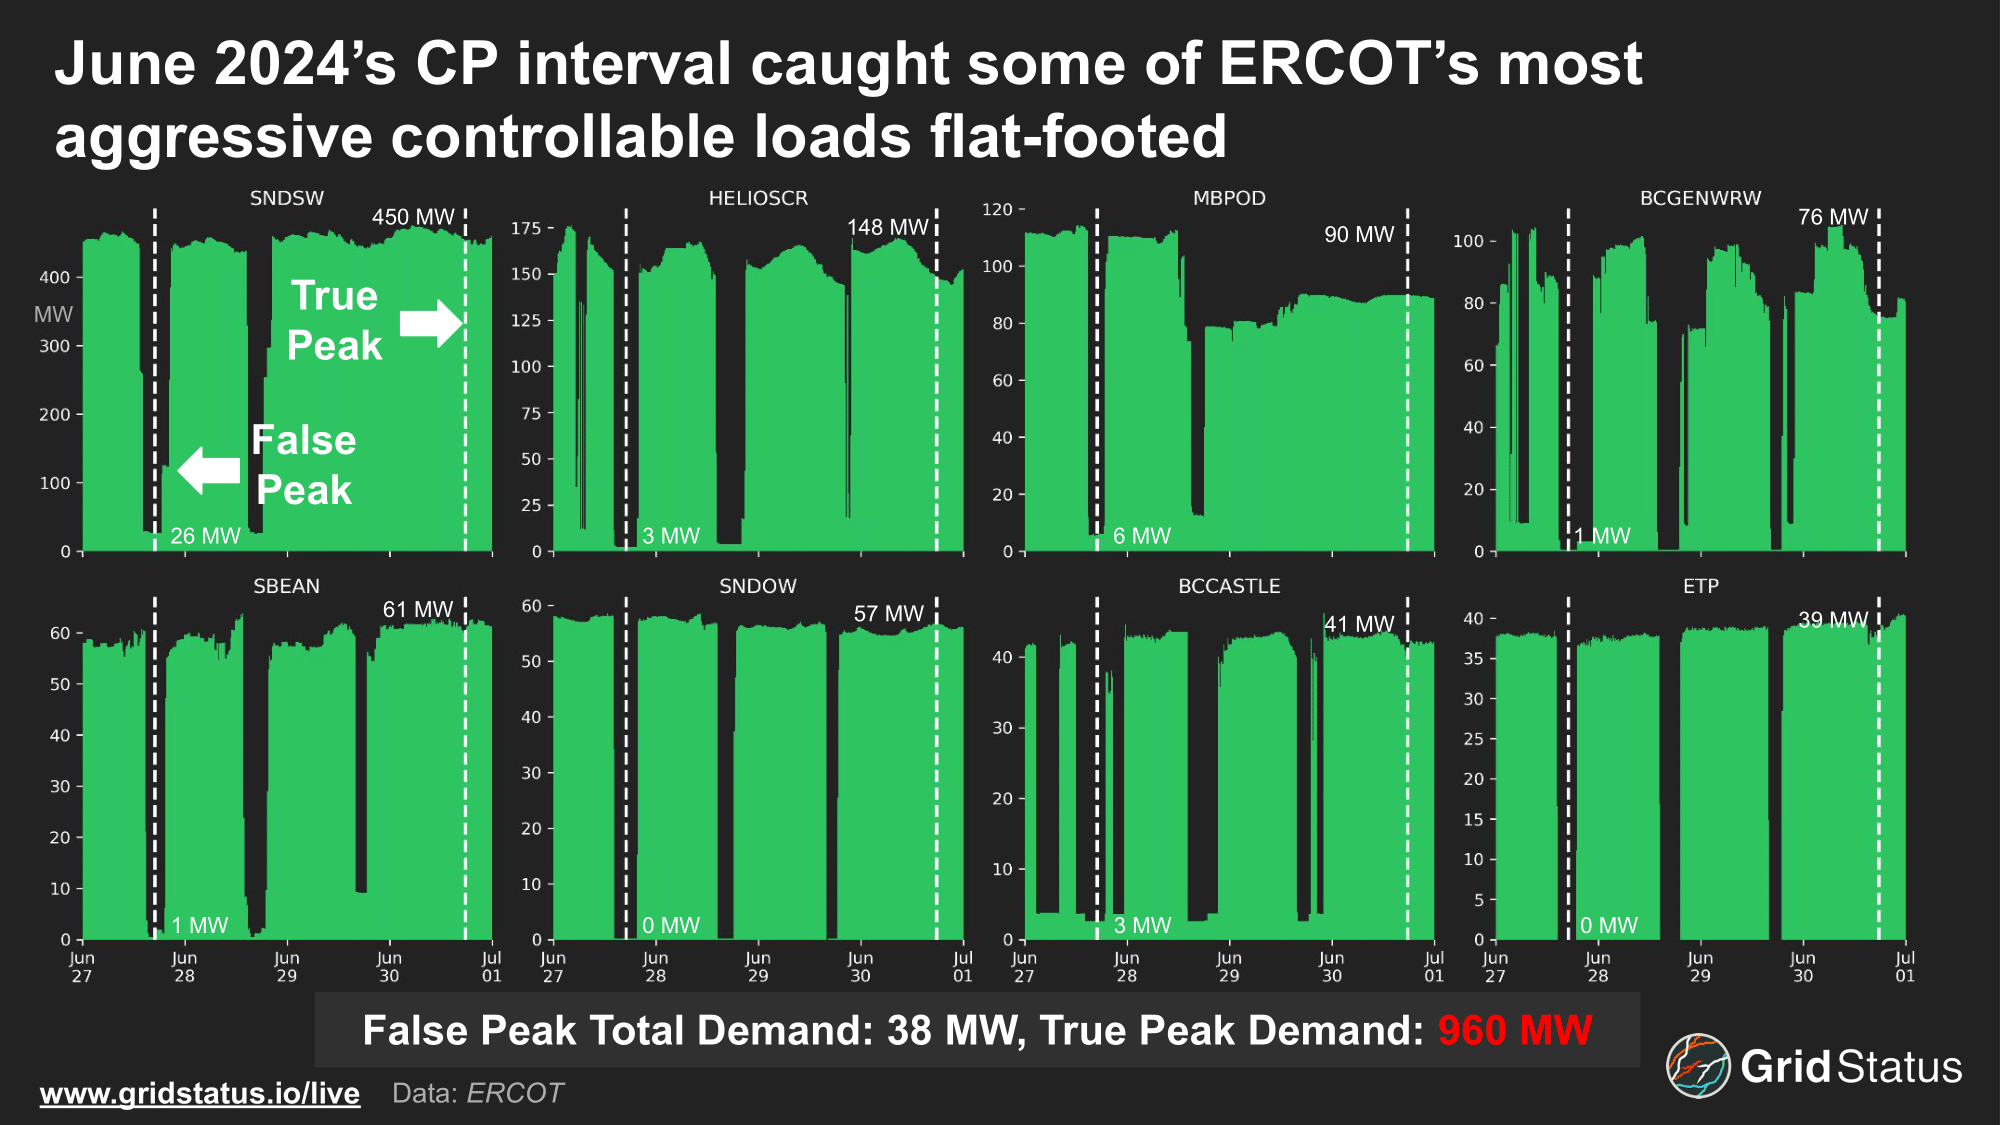
These are some of the largest Controllable Load Resources (CLRs) in ERCOT that also demonstrate extremely flexible behavior in terms of curtailment for possible 4CP intervals or grid alerts. Larger industrial loads and datacenter loads exist, but those facilities either have limited ability to curtail or do not actively participate in the market.
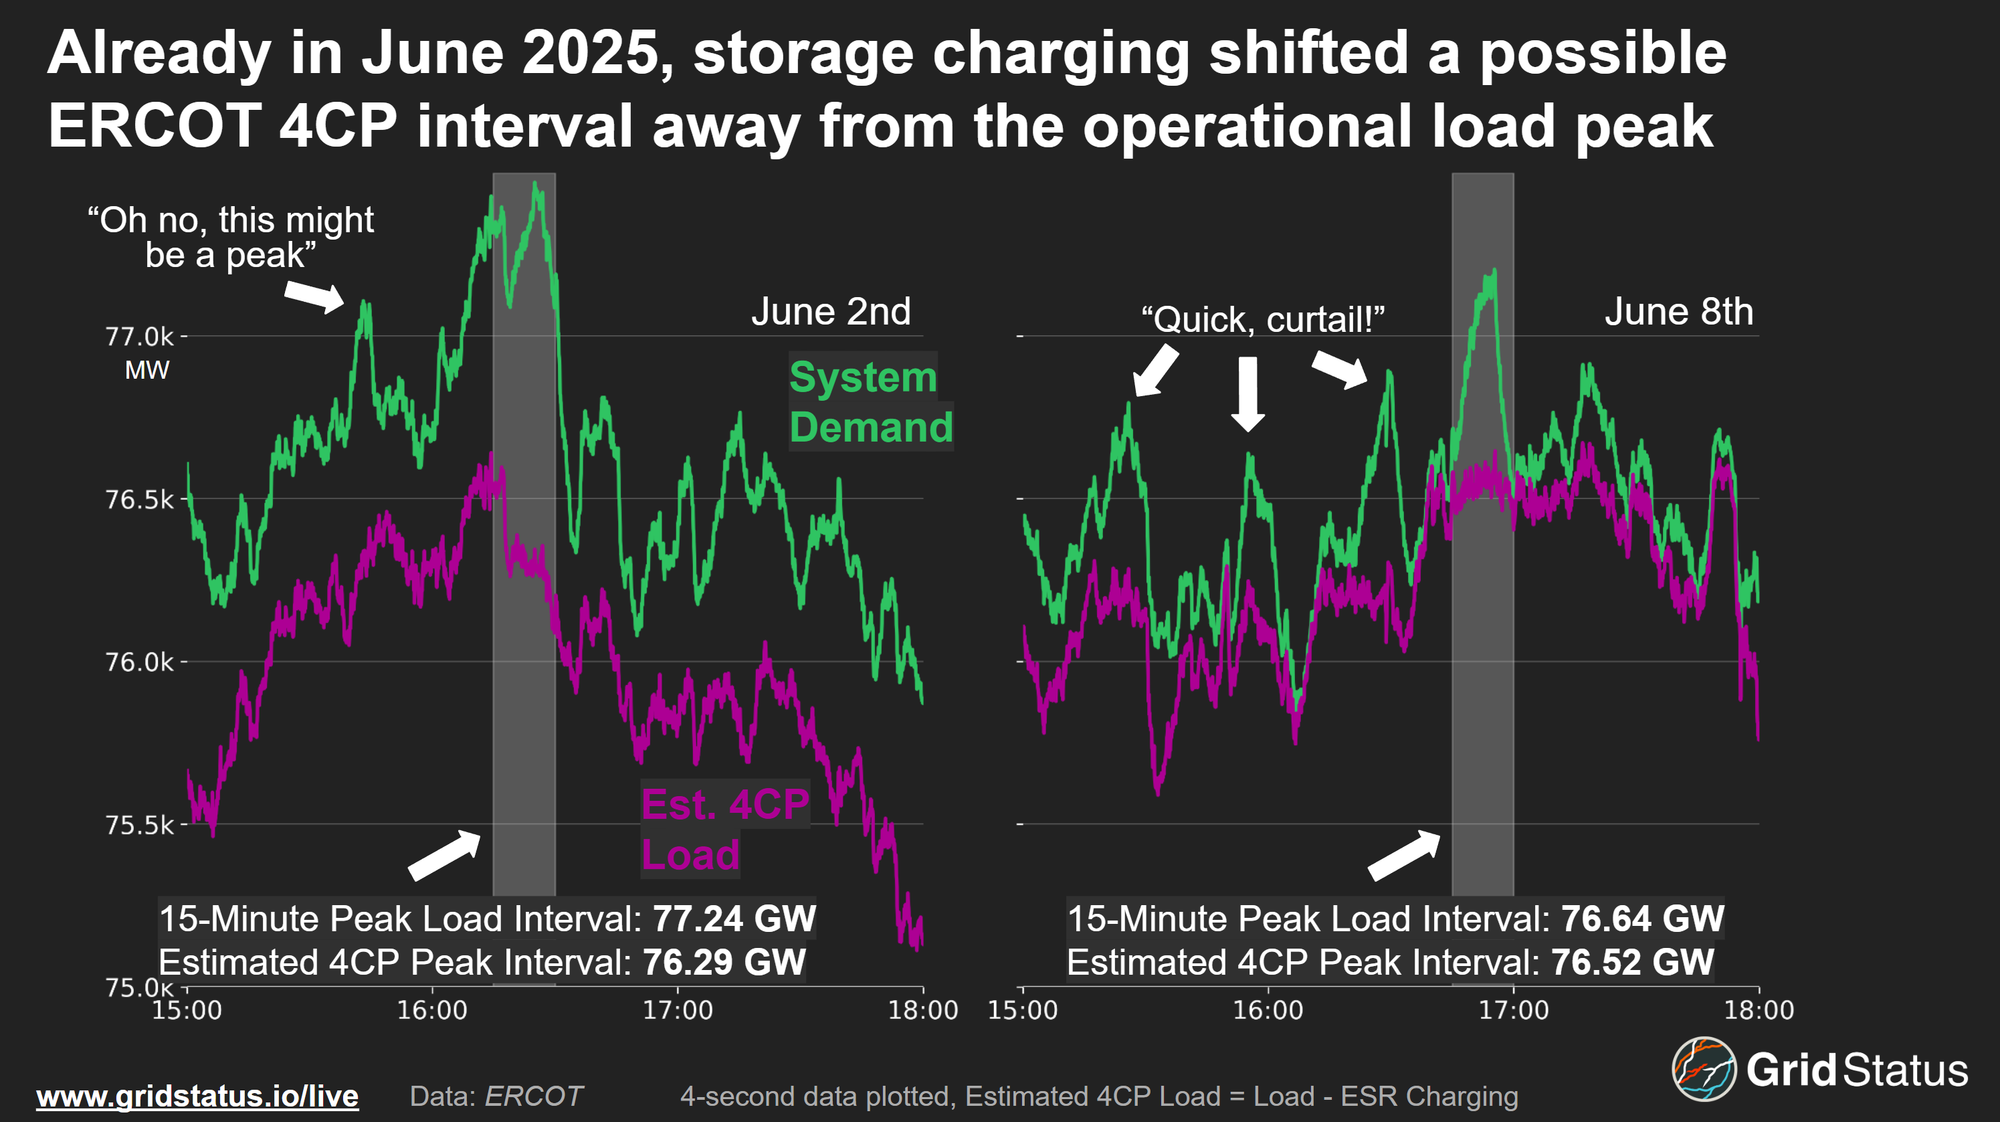
During the anticipated 6/27 interval, storage charging was greater than 500 MW, but on the 30th, storage charging was only at 63 MW. Once storage load is removed, the result was a 230 MW difference, with 6/30 @ 17:45 having the higher peak load.
To put this 230 MW gap in perspective, in 2024 there were already a handful of Bitcoin operations in Texas with sites large enough to have shifted this systemwide 4CP interval on their own.
Today there are even more individual sites in ERCOT with the capability to swing hundreds of MWs within minutes.
This painful example demonstrates one issue with the current model—with only one peak interval per month, the false positive rate is high. When you’re 5 or 6 days into “red alert” high load days, coasting into the last day of the month that also happens to be a Sunday, your attention has already been worn down. Very large load-serving entities tend to have a structured risk playbook and employee redundancies, newer entities to the market, some with very large demand, may not have the ops infrastructure to track repeated alerts on top of everything else.
Show Me the Money
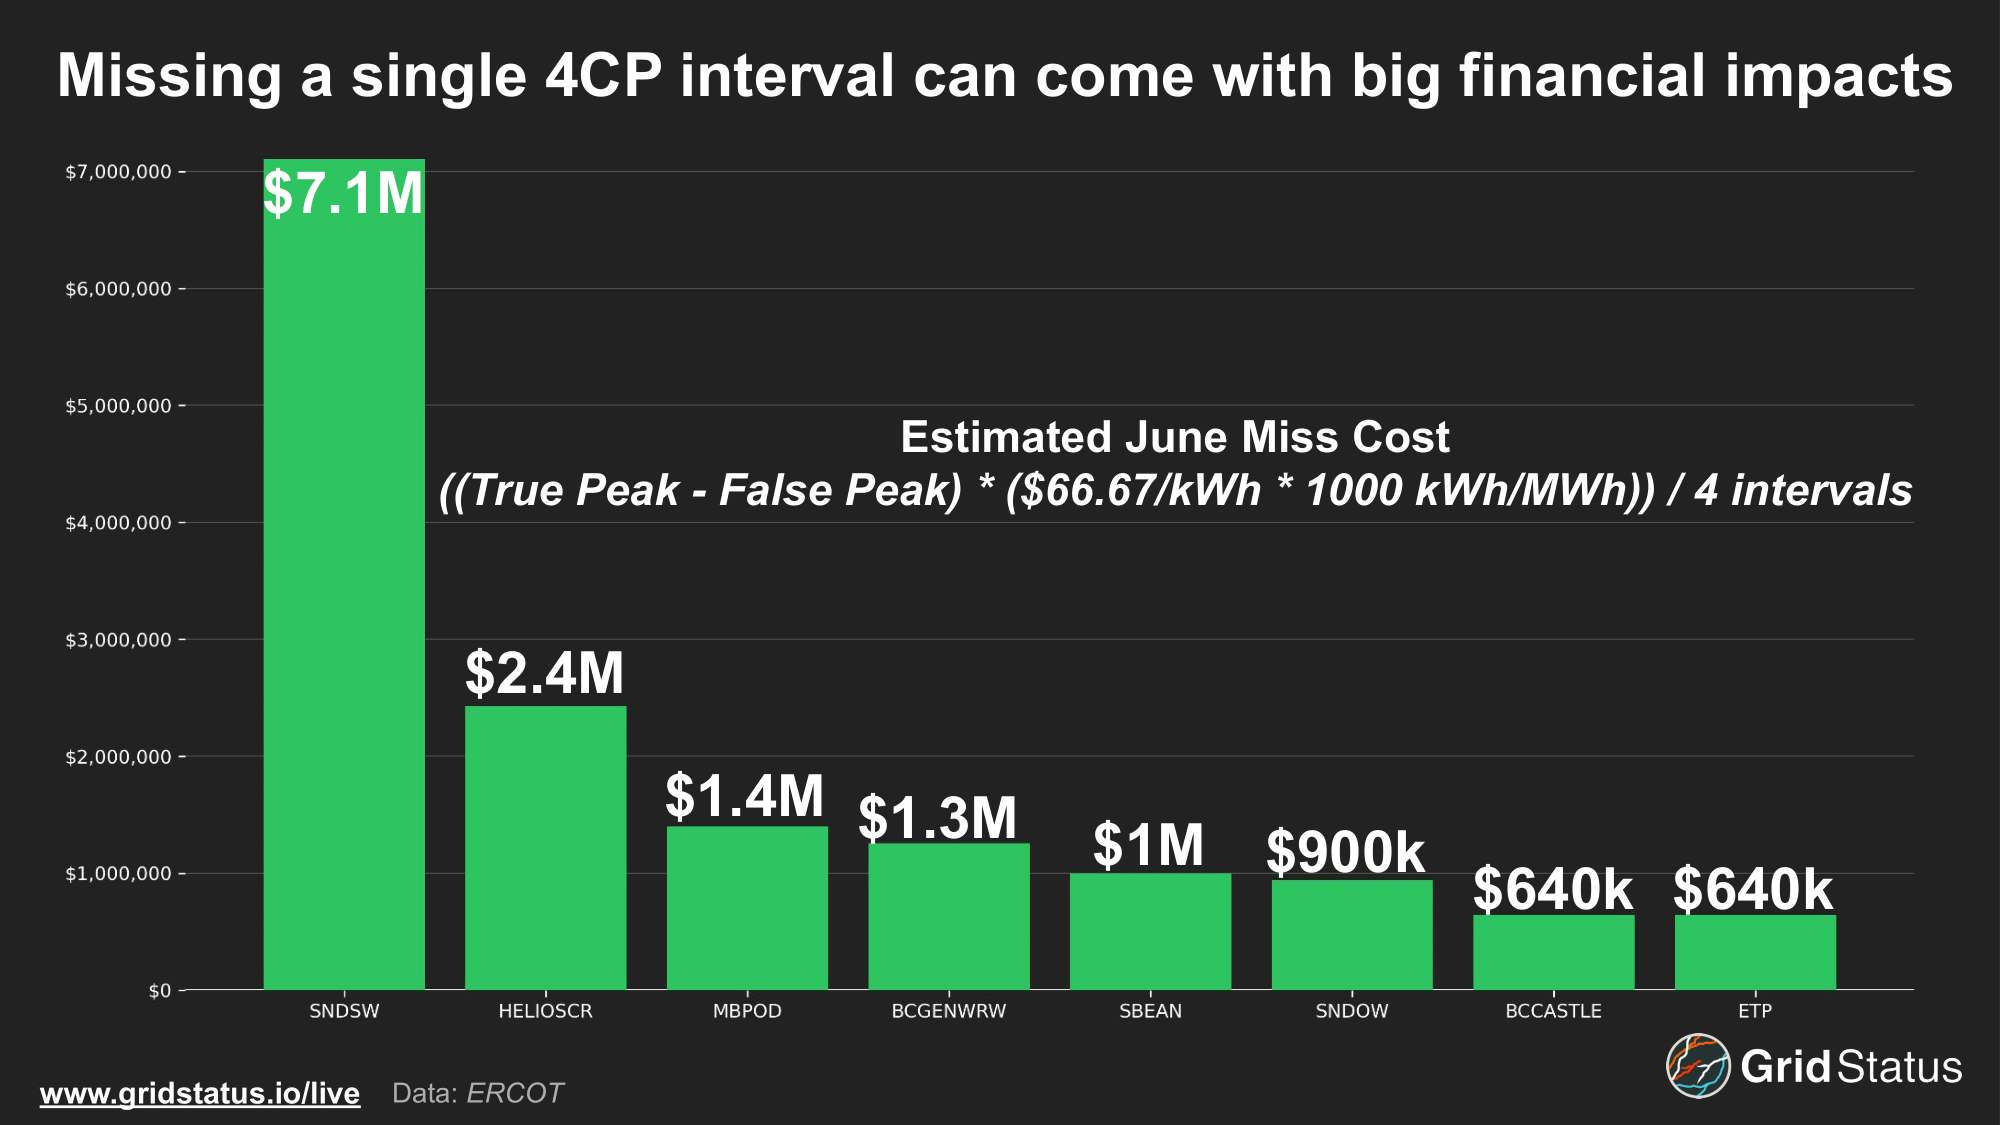
For this miss we can construct a cost hypothetical using the transmission rate of $66.67/KWh.
June Miss Cost = ((True Peak - False Peak) * (66.67 kW/h * 1000 kWh/MWh)) / 4 intervals
However, every facility (if it was online) reduced demand during the remaining 3 intervals. By looking at the remaining months we can calculate a net savings across the summer using their earlier-in-the-day demand and actual peak consumption during the other 3 intervals.
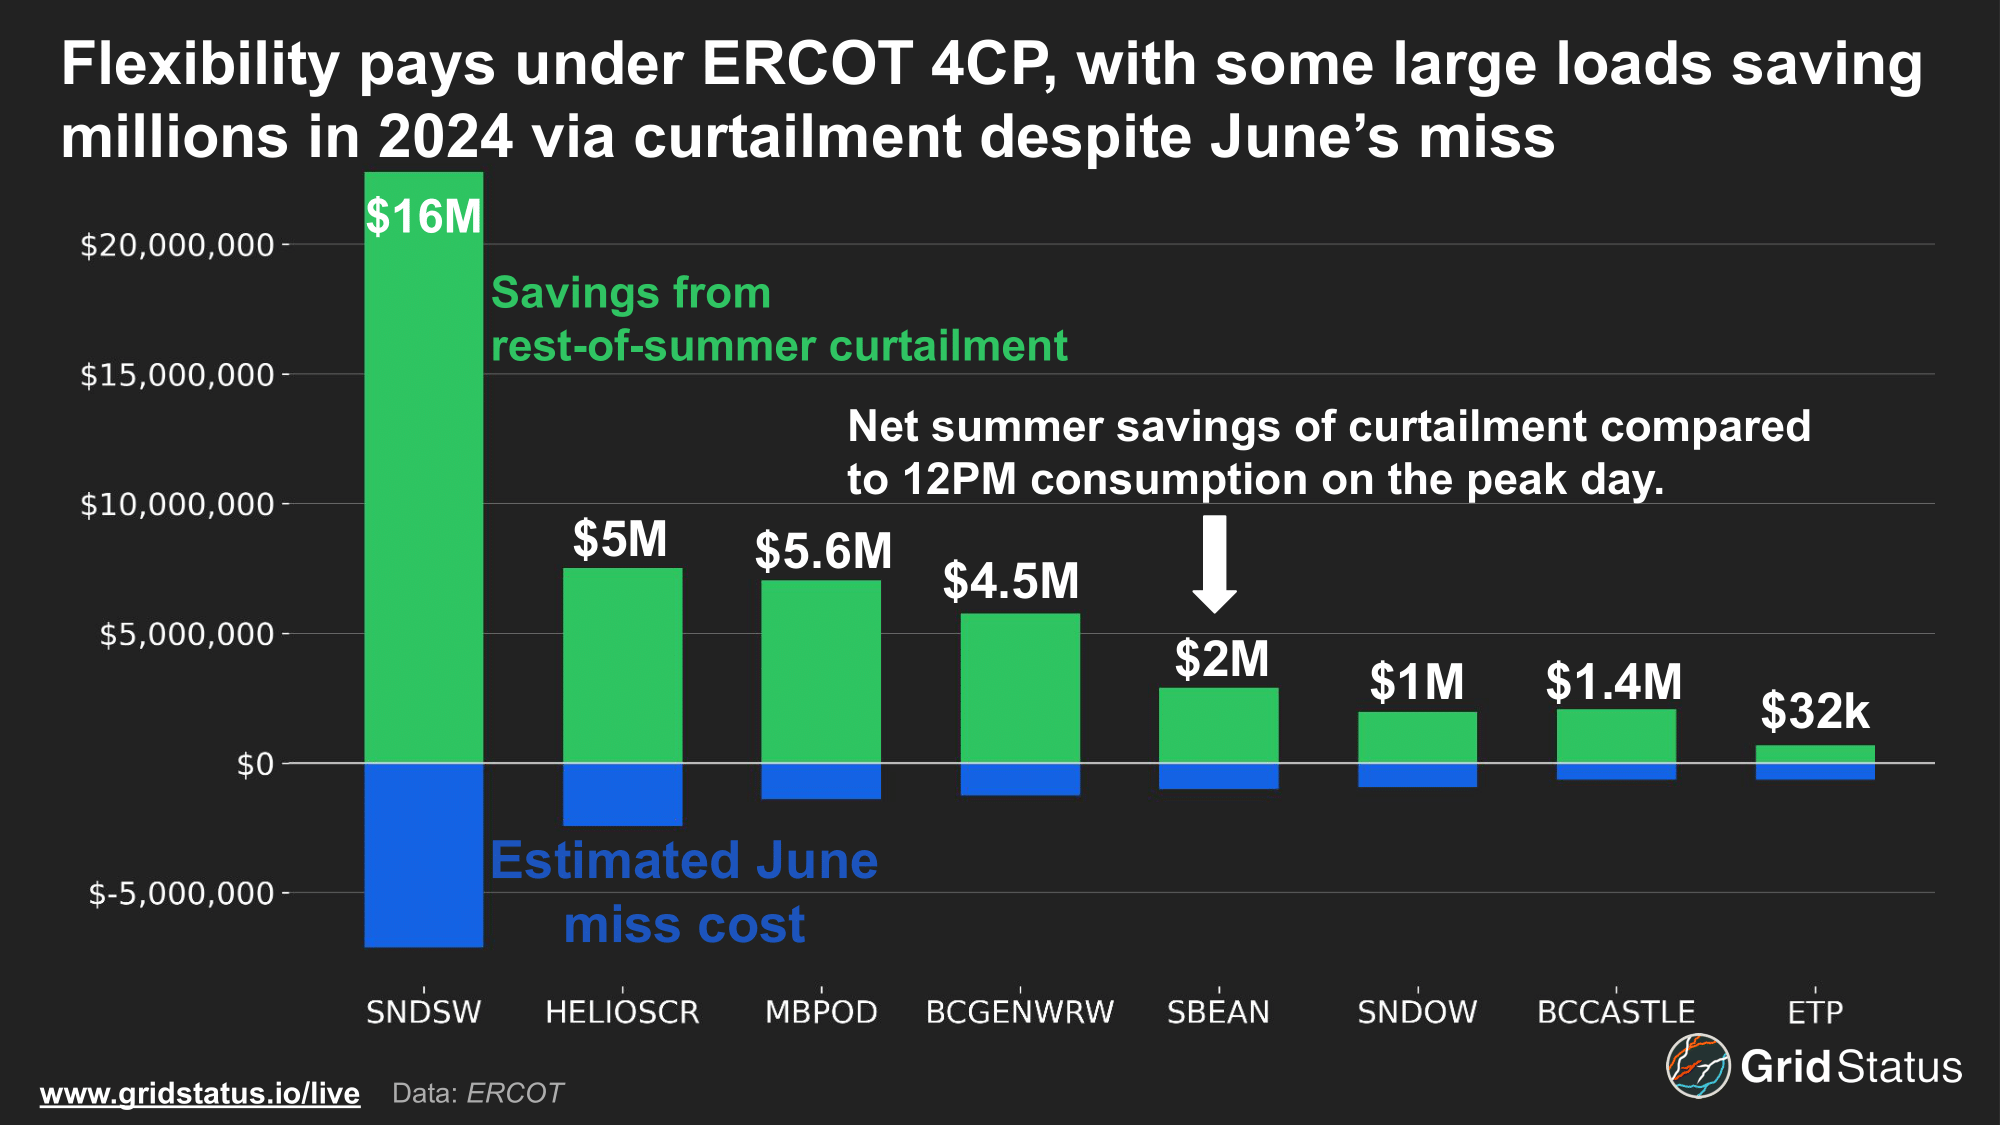
So, these facilities likely saved very large amounts relative to business-as-usual consumption, despite a very bad miss in June. Something important to keep in mind is that transmission costs to these loads are part of a larger system.
With Regulation Down, Curtailment Begets Demand
Despite this shift, the battery impact on 4CP interval prediction isn’t just opportunistic charging in pursuit of price arbitrage. As we noted last year, load (primarily batteries) has come to dominate regulation down (regdown) in ERCOT, and since last June (the most recent data we had at the time), generation’s position has further eroded.
Regulation down is an ancillary service that calls for either a reduction in output from generators or an increase in consumption from load. For batteries, getting paid anything to charge is a great deal, but the persistence of congestion-driven negative energy prices is driven by an individual location and is often fleeting. Ancillary services in ERCOT are grid-wide, so the location of a particular asset carrying regdown doesn’t matter, just that it can turn output down or consumption up, a natural fit for batteries.
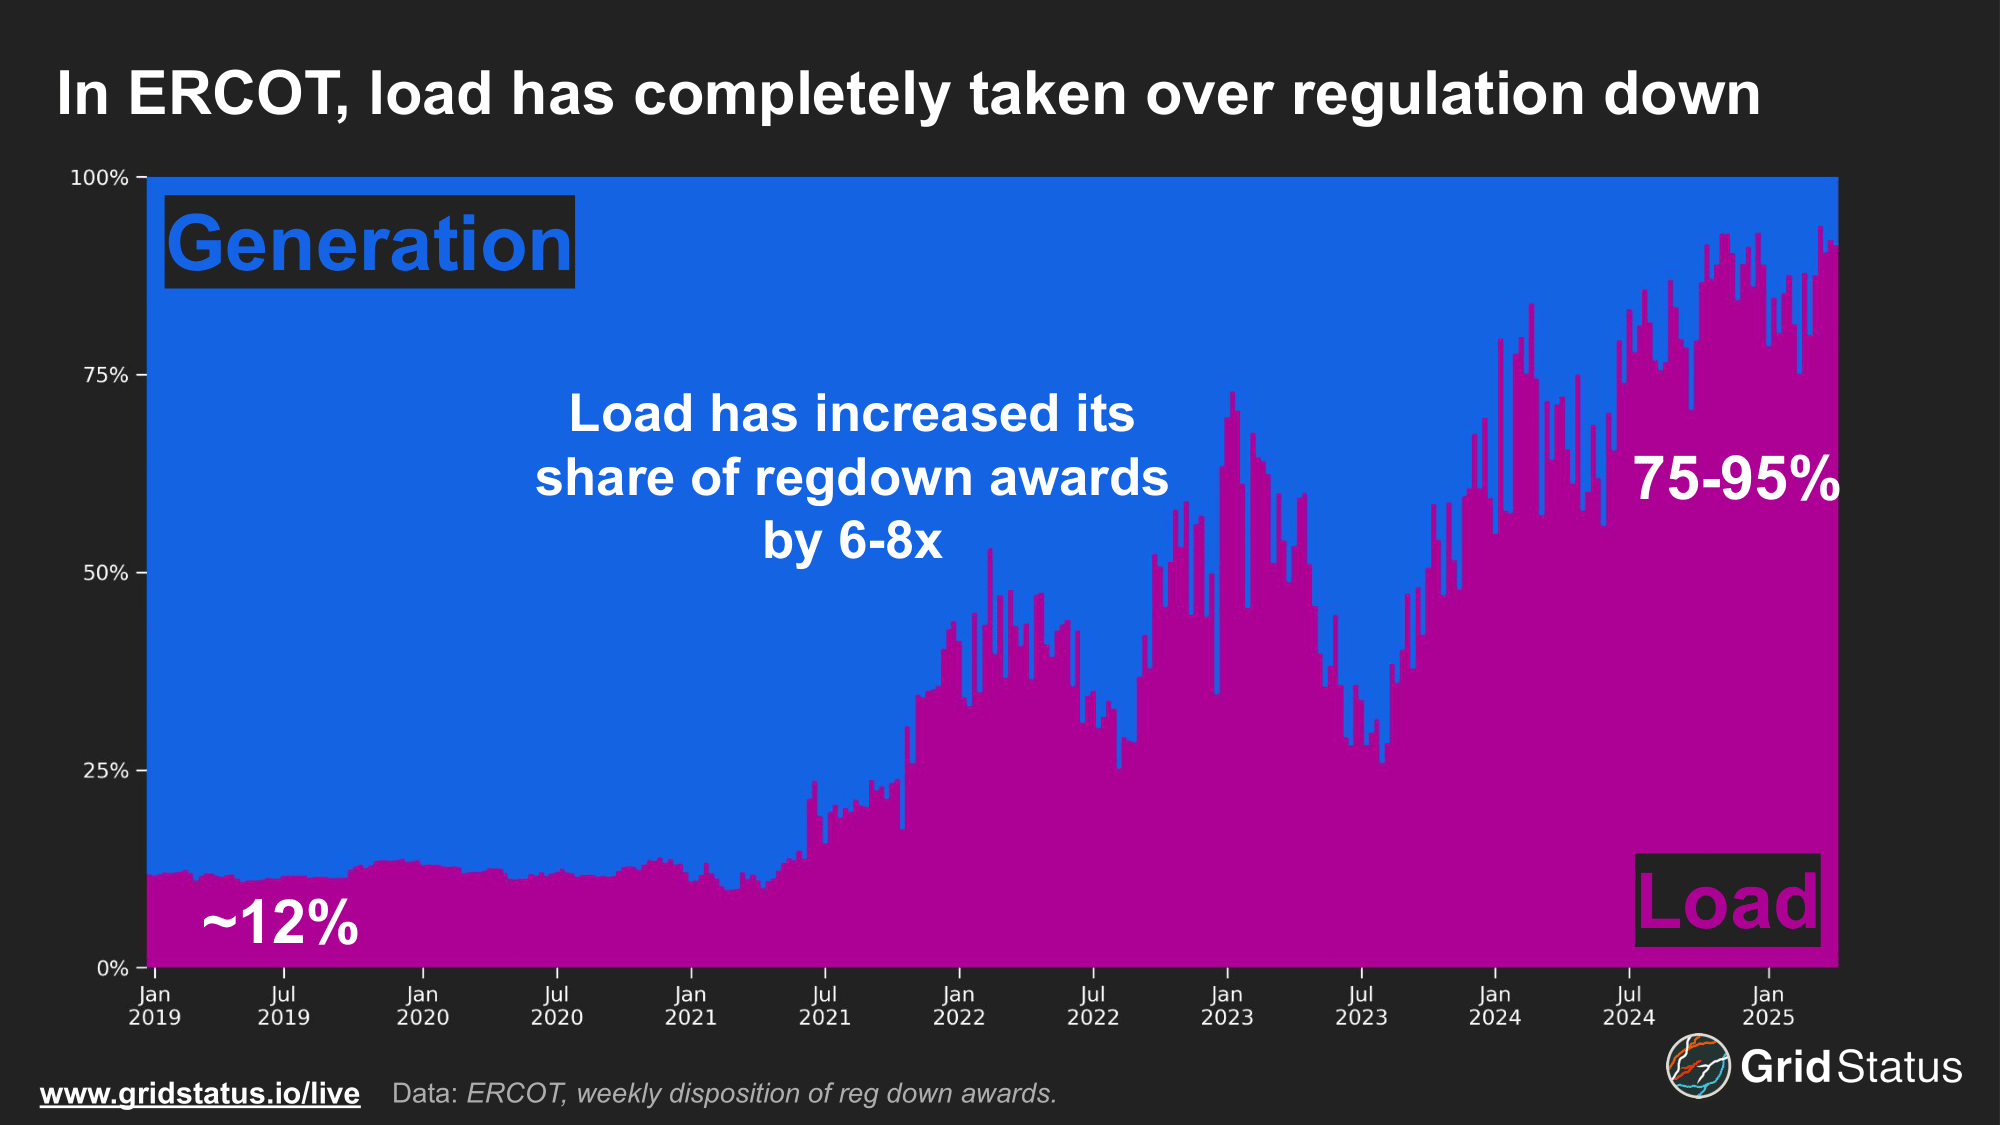
The volume of ERCOT’s ancillary services procurement is not determined in real-time via optimization, but largely by a plan published in the previous year (although this is one of many market elements currently in flux). This means that some regular patterns are easier to spot as the total volume is predictable. In particular, load-side resources tend to dominate weekend awards of regdown, with generators falling to less than 100 MW in all hours.
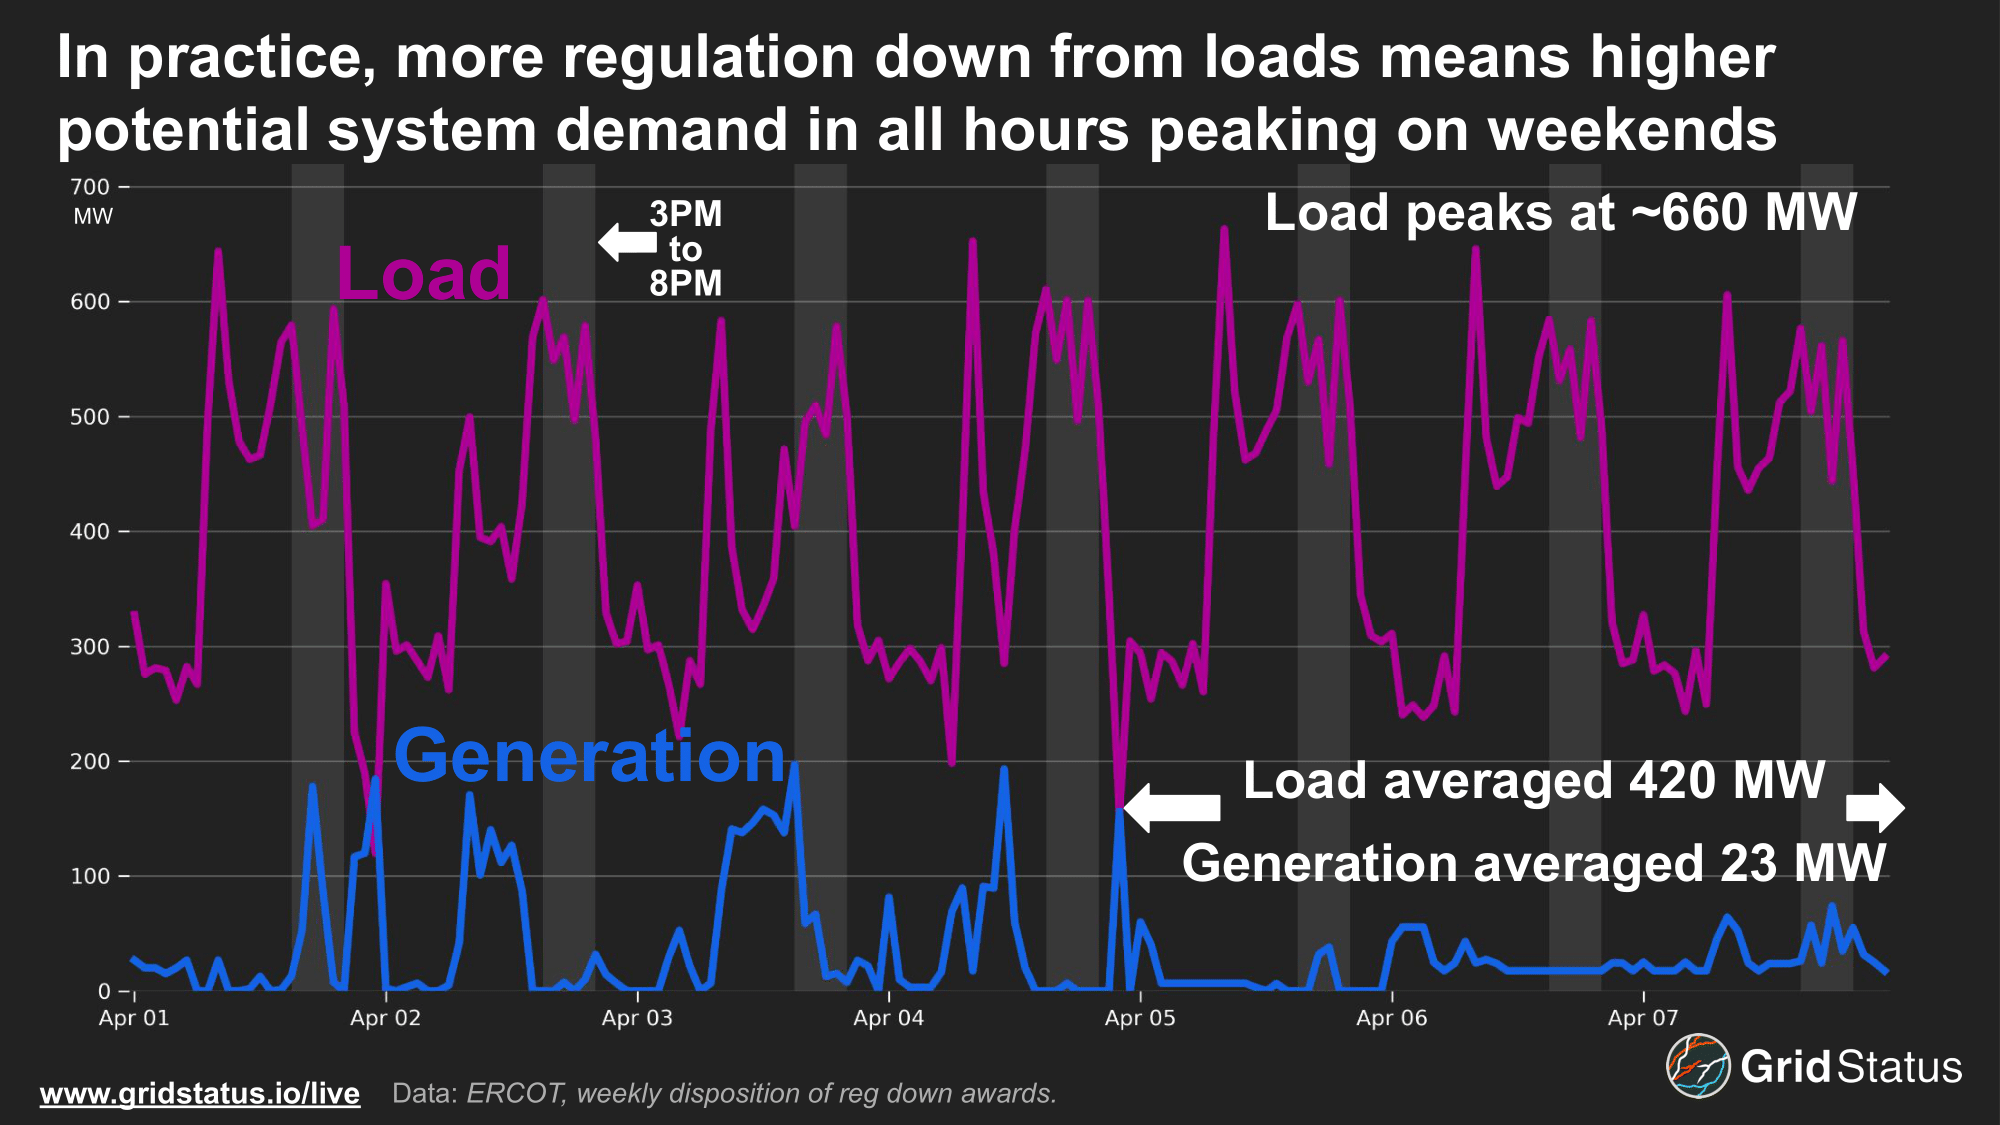
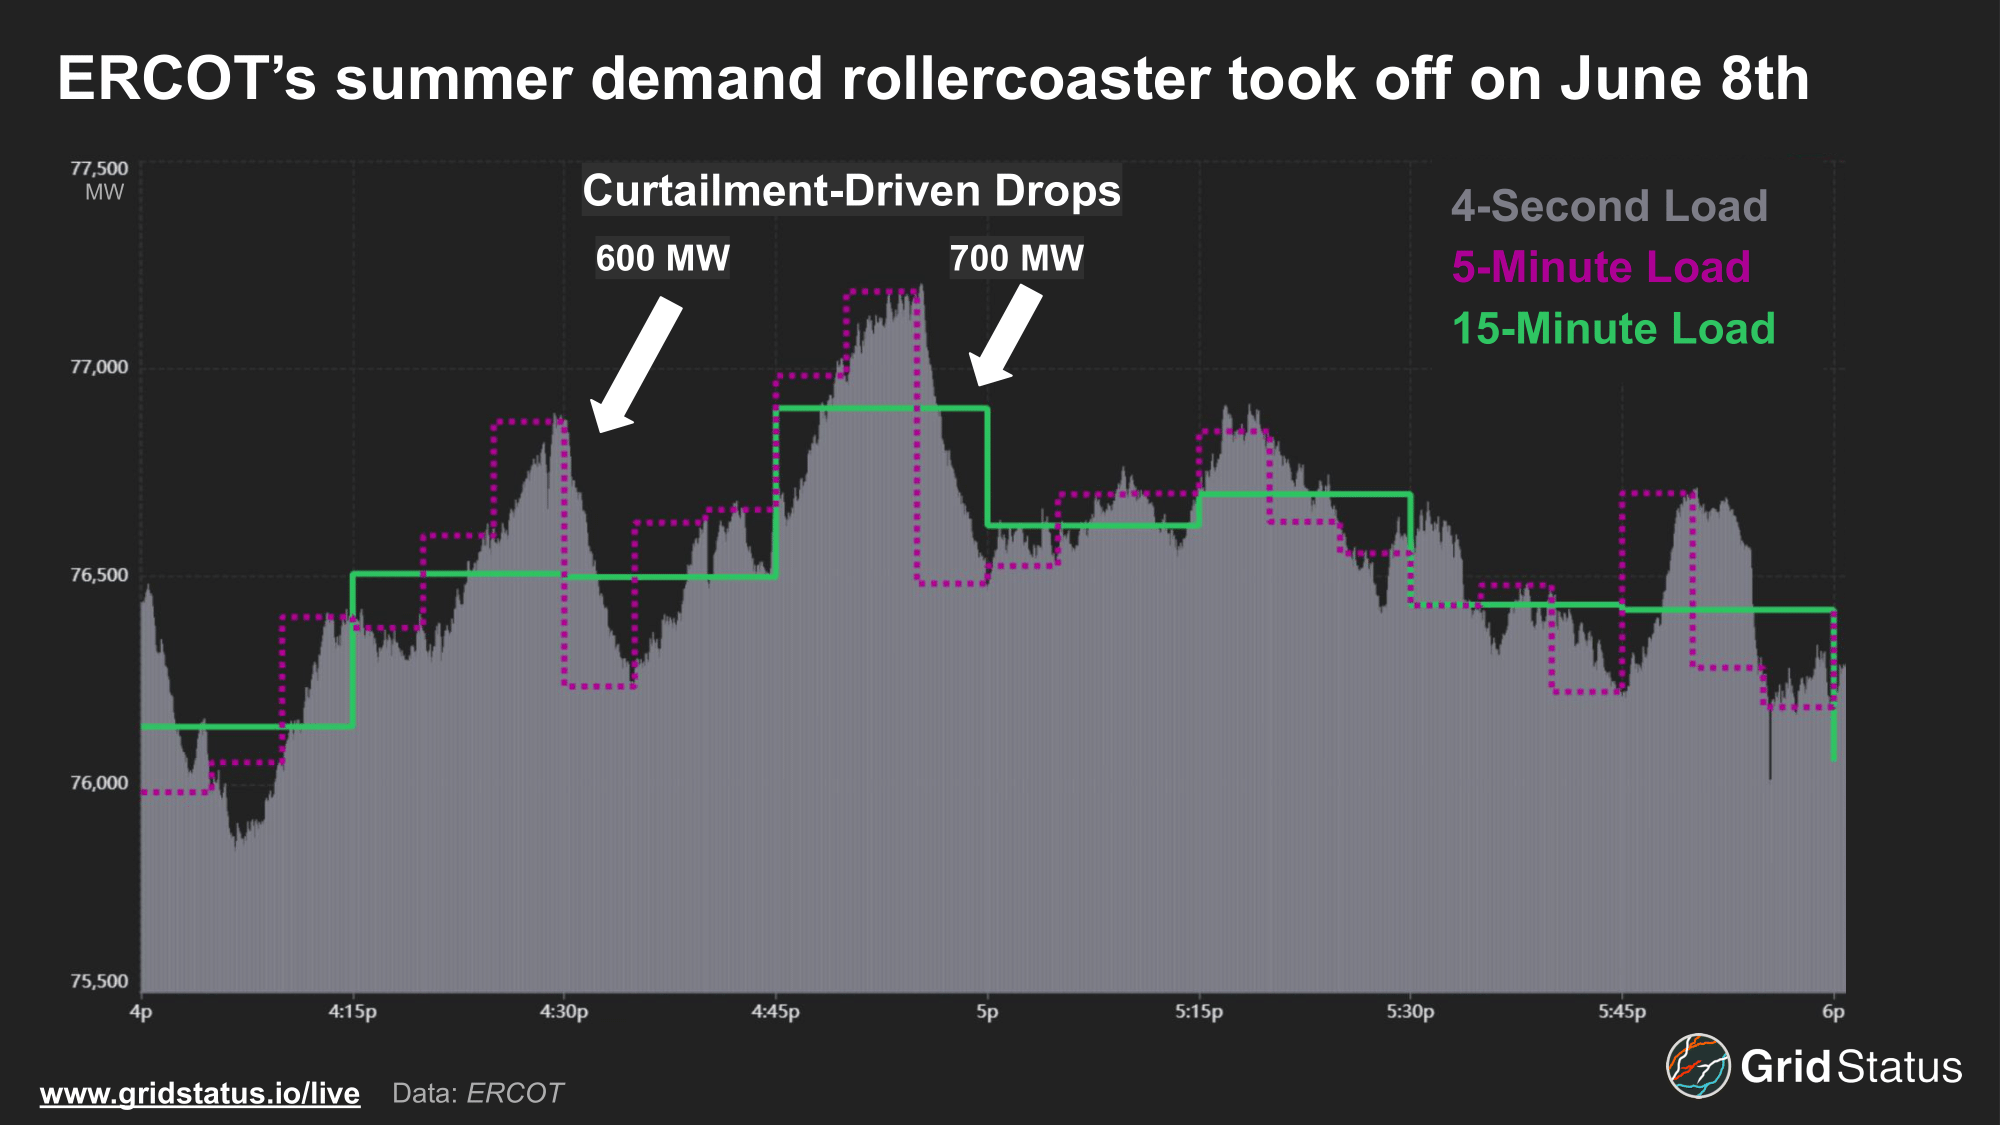
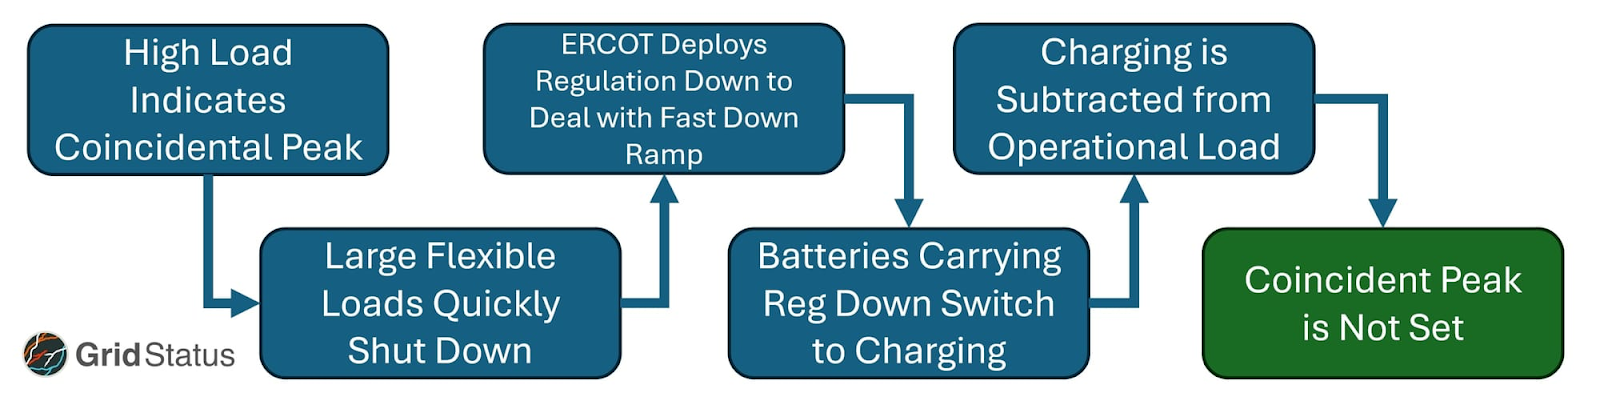
Peak hours are no exception to load’s stranglehold, with substantial potential for storage-charging-as-regdown to impact the 4CP peak load calculation. In practice, we can return to the evening of June 8th to see if it is possible to spot a relationship between regdown deployment and storage charging.
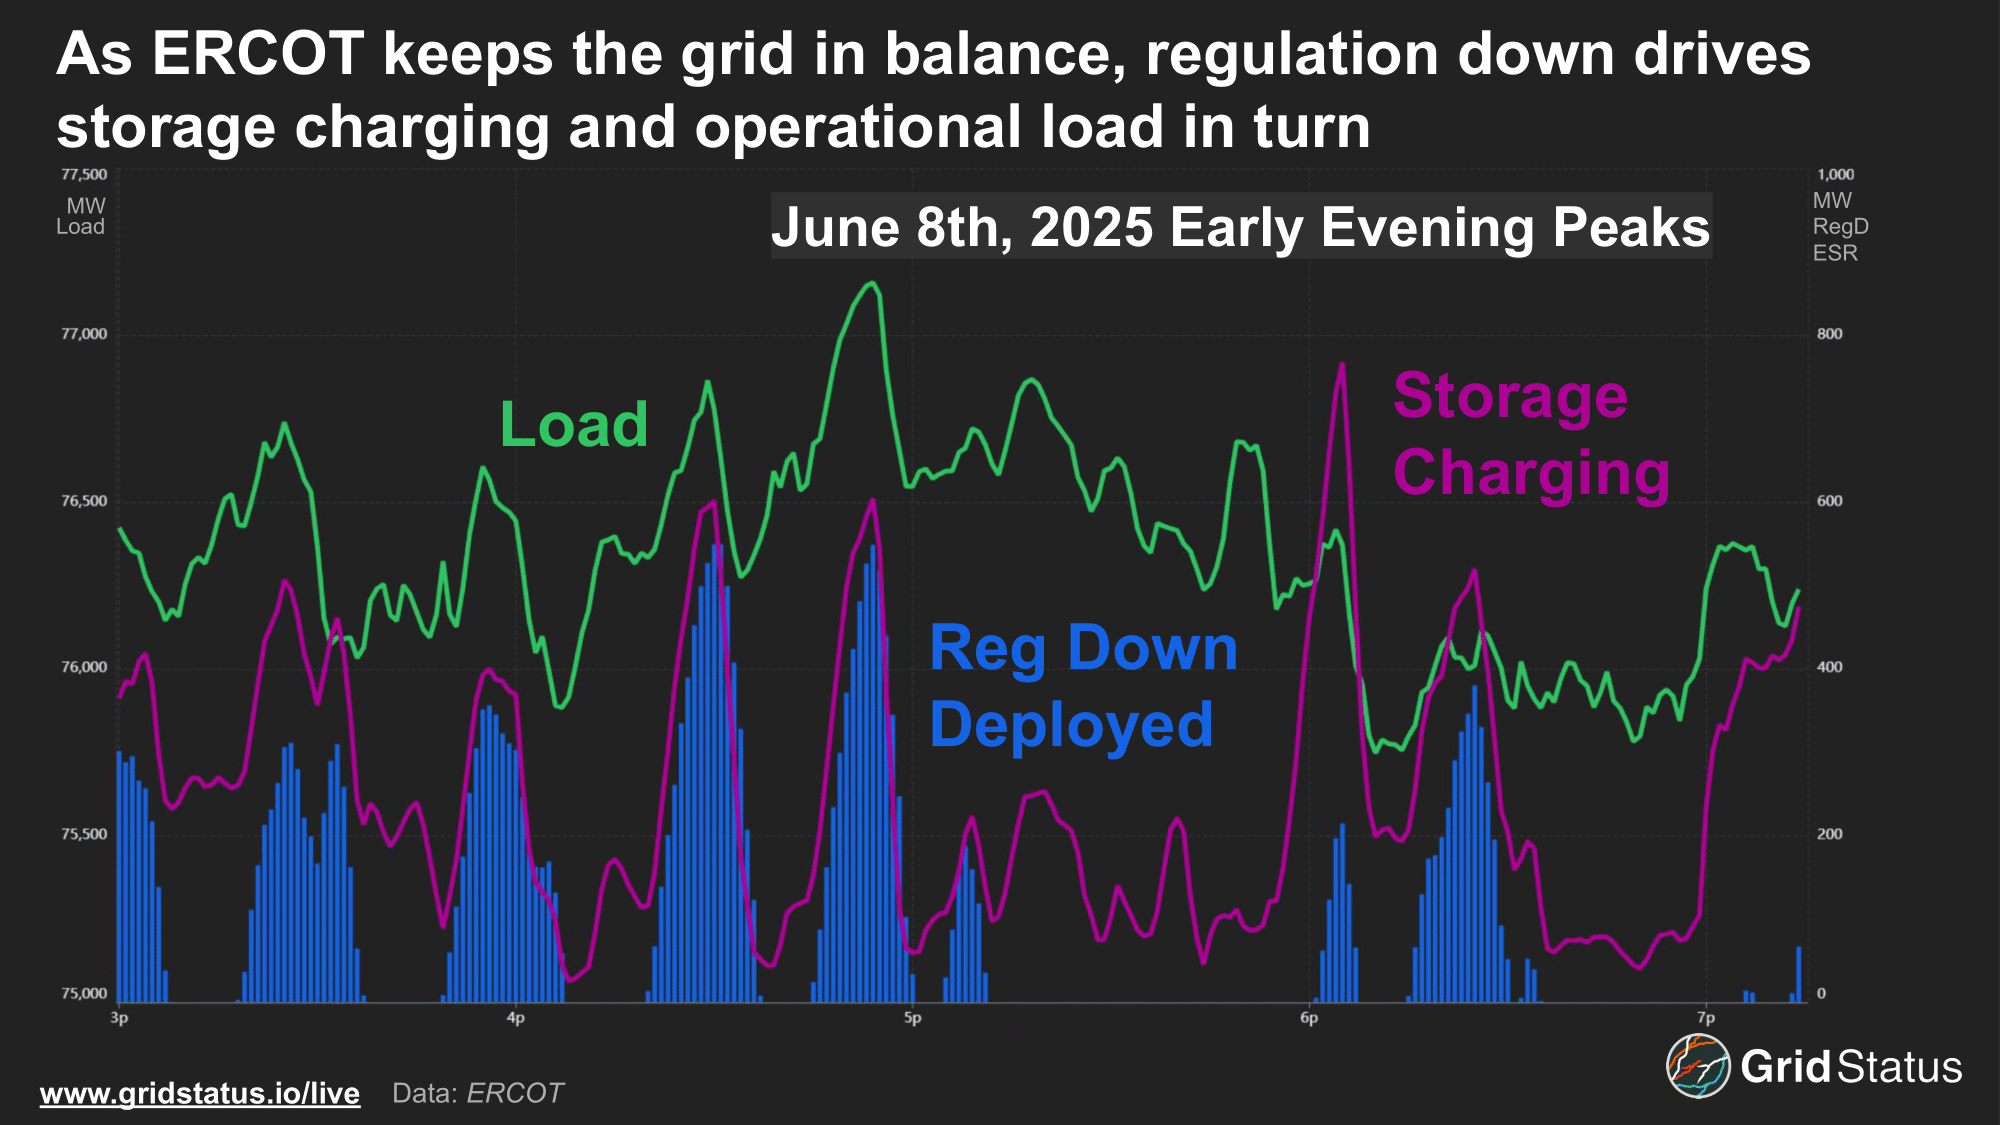
From this figure, we can update our understanding of the 8th, as it wasn’t just swings in curtailment, but the operational grid-balancing response to shifting grid demand contributing to those peaks.
The Legislature Stirs
2025 was an on-year for the every other year the Texas Legislature, and this spring energy broadly and ERCOT specifically remained a prime point of legislative action. While some of the most radical changes to the Texas energy system didn’t make it over the finish line, this year did produce an understanding that the 4CP program may need a closer look.
Tucked into Senate Bill 6 was a directive to the Public Utility Commission of Texas (PUCT) to evaluate the 4CP program and amend the program by the end of 2026, to:
ensure that wholesale transmission charges appropriately assign costs for transmission investment.
From the text, the legislature seems to have two overarching points of concern with the current program:
- Not all loads or classes of load may be paying enough for transmission infrastructure, whether through the portion influenced by 4CP or the remainder which can’t be influenced by 4CP
- The summer 4CP season based on 15-minute intervals may no longer be sufficient in a market with demand growing in all seasons
While the final outcome of this evaluation is far from certain, it seems likely to touch on the shifting face of ERCOT’s demand and the variance in participation and rates of new resources.
SB6 4CP Section
Emphasis added
(a) The Public Utility Commission of Texas shall evaluate whether the existing methodology used to charge wholesale transmission costs to distribution providers under Section 35.004(d), Utilities Code, continues to appropriately assign costs for transmission investment. The commission shall also evaluate:
(1) whether the current four coincident peak methodology used to calculate wholesale transmission rates ensures that all loads appropriately contribute to the recovery of an electric cooperative's, electric utility's, or municipally owned utility's costs to provide access to the transmission system;
(2) whether alternative methods to calculate wholesale transmission rates would more appropriately assign the cost of providing access to and wholesale service from the transmission system, such as consideration of multiple seasonal peak demands, demand during different length daily intervals, or peak energy intervals; and
(3) the portion of the costs related to access to and wholesale service from the transmission system that should be nonbypassable, consistent with Section 35.004(c-1), Utilities Code, as added by this Act.
(b) The Public Utility Commission of Texas shall evaluate whether the commission's retail ratemaking practices ensure that transmission cost recovery appropriately charges the system costs that are caused by each customer class.
(c) The Public Utility Commission of Texas shall begin the evaluation required under Subsection (a) of this section not later than the 90th day after the effective date of this Act. After completion of the evaluation project and not later than December 31, 2026, the commission shall amend commission rules to ensure that wholesale transmission charges appropriately assign costs for transmission investment.
Parting Thoughts
The story of demand has never been more important to a changing grid, and with Texas as ground zero, ERCOT’s 4 Coincident Peak (4CP) program and its impacts are worth paying attention to. The game theory aspects of the 4CP program have only grown more complicated as ever larger and more flexible loads interconnect alongside battery storage, whose charging must be subtracted from load to gain a clearer picture of the current 4CP peak.
For asset managers and large consumers this friction manifests in rate increases and degraded tools as more accurate competitors shift costs, and strategies that worked in 2016 are no longer sufficient in 2025. For grid operators, the pool of resources has expanded, but their interactions can be unpredictable, and the Cambrian explosion of control technologies is a colossal headache as more and larger loads interconnect with unknown hardware, questionable firmware (file download), and disparate response times.
Through all of this, we’re here to provide data and tools to improve your decision making, both in the moment and over a longer horizon. Reach out if you want to learn more about our 4CP product offering or other tools and data, and look out for the impending (beta) release of a new feature to help your team better track and compare forecasts across the market.