Exploring extreme prices in ERCOT with Grid Status
On 2/19/2025 a single location in ERCOT experienced all-time-high prices. What happened, and was the local battery, Rabbit Hill, able to capitalize on these extreme prices?

On February 19th, 2025, a single node in ERCOT saw some of the highest prices ever recorded in the market’s history, reaching nearly $30,000/MWh. This location isn’t just home to a handful of buses, but also a battery, leading some observers to speculate about the potentially vast revenue captured by its owners. But did the battery even have charge, and if it did, how much could it output? If it had charge, did it capture the peak? Was it constrained by commitments from the prior day? Now, 60 days later, we can answer these questions.
Let’s walk through how you could learn more about this event and Rabbit Hill's response using Grid Status.
You can find that dashboard here, and then copy it to your own account to play around with the data and see what makes it tick.
When and Where
First, you'd have to know this event even occurred. While social media chatter probably surfaced it for many folks, this isn't something you'd stumble across looking at ERCOT prices at a high level.
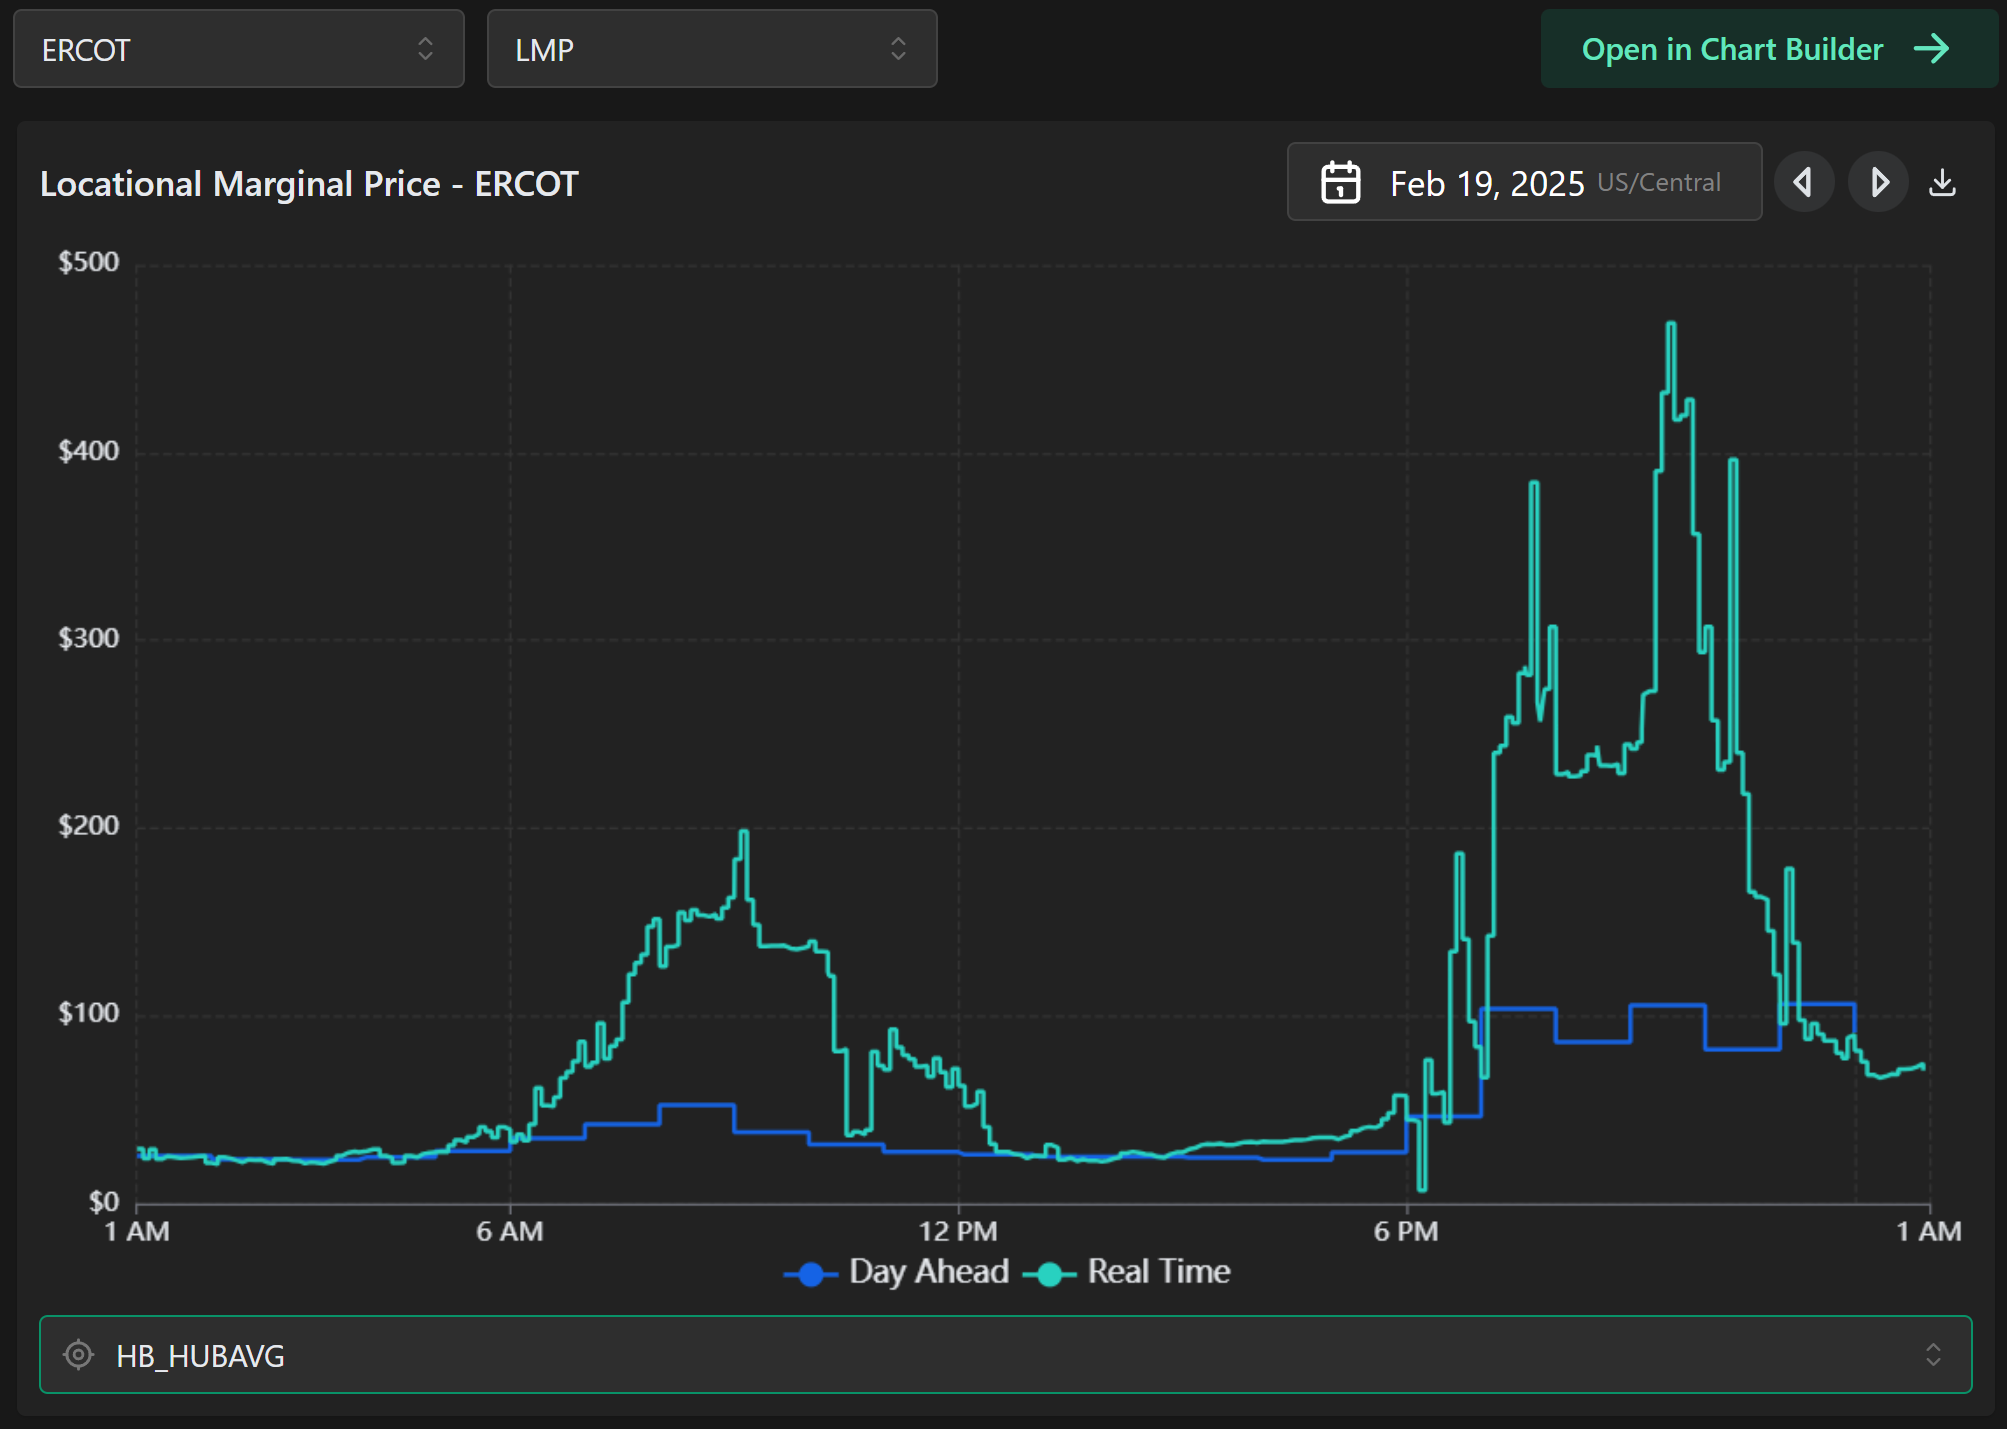
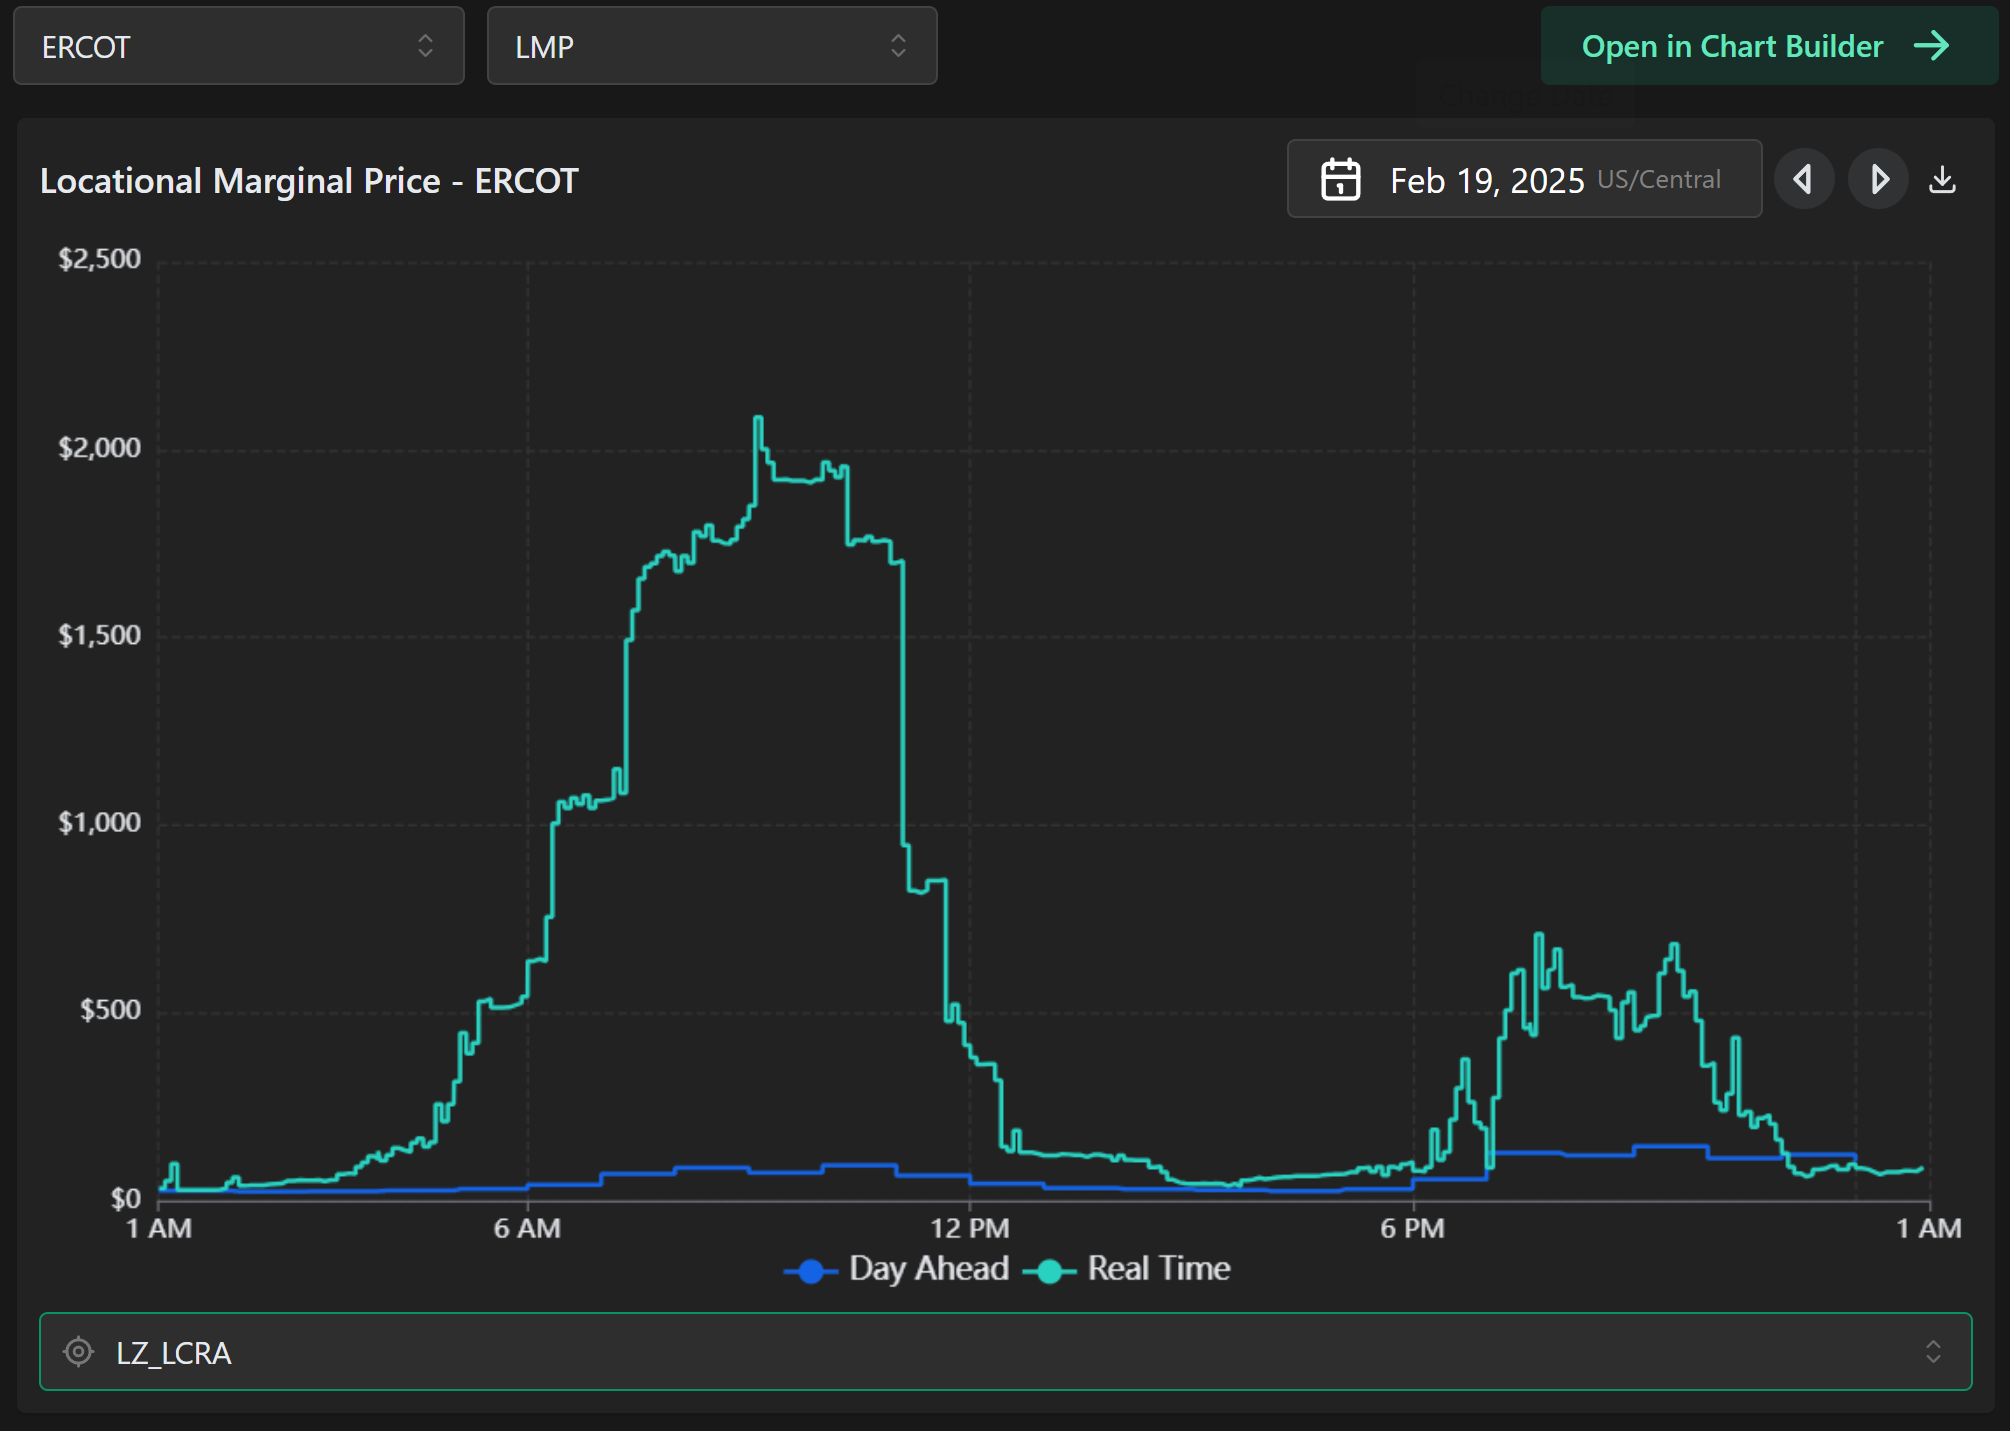
None of the Hubs showed a particularly surprising pattern. The event was in the morning, but prices were higher in both the day-ahead and real-time in the evening. Only when we turn to load zones does something curious show up, with prices for LCRA substantially elevated throughout the morning.
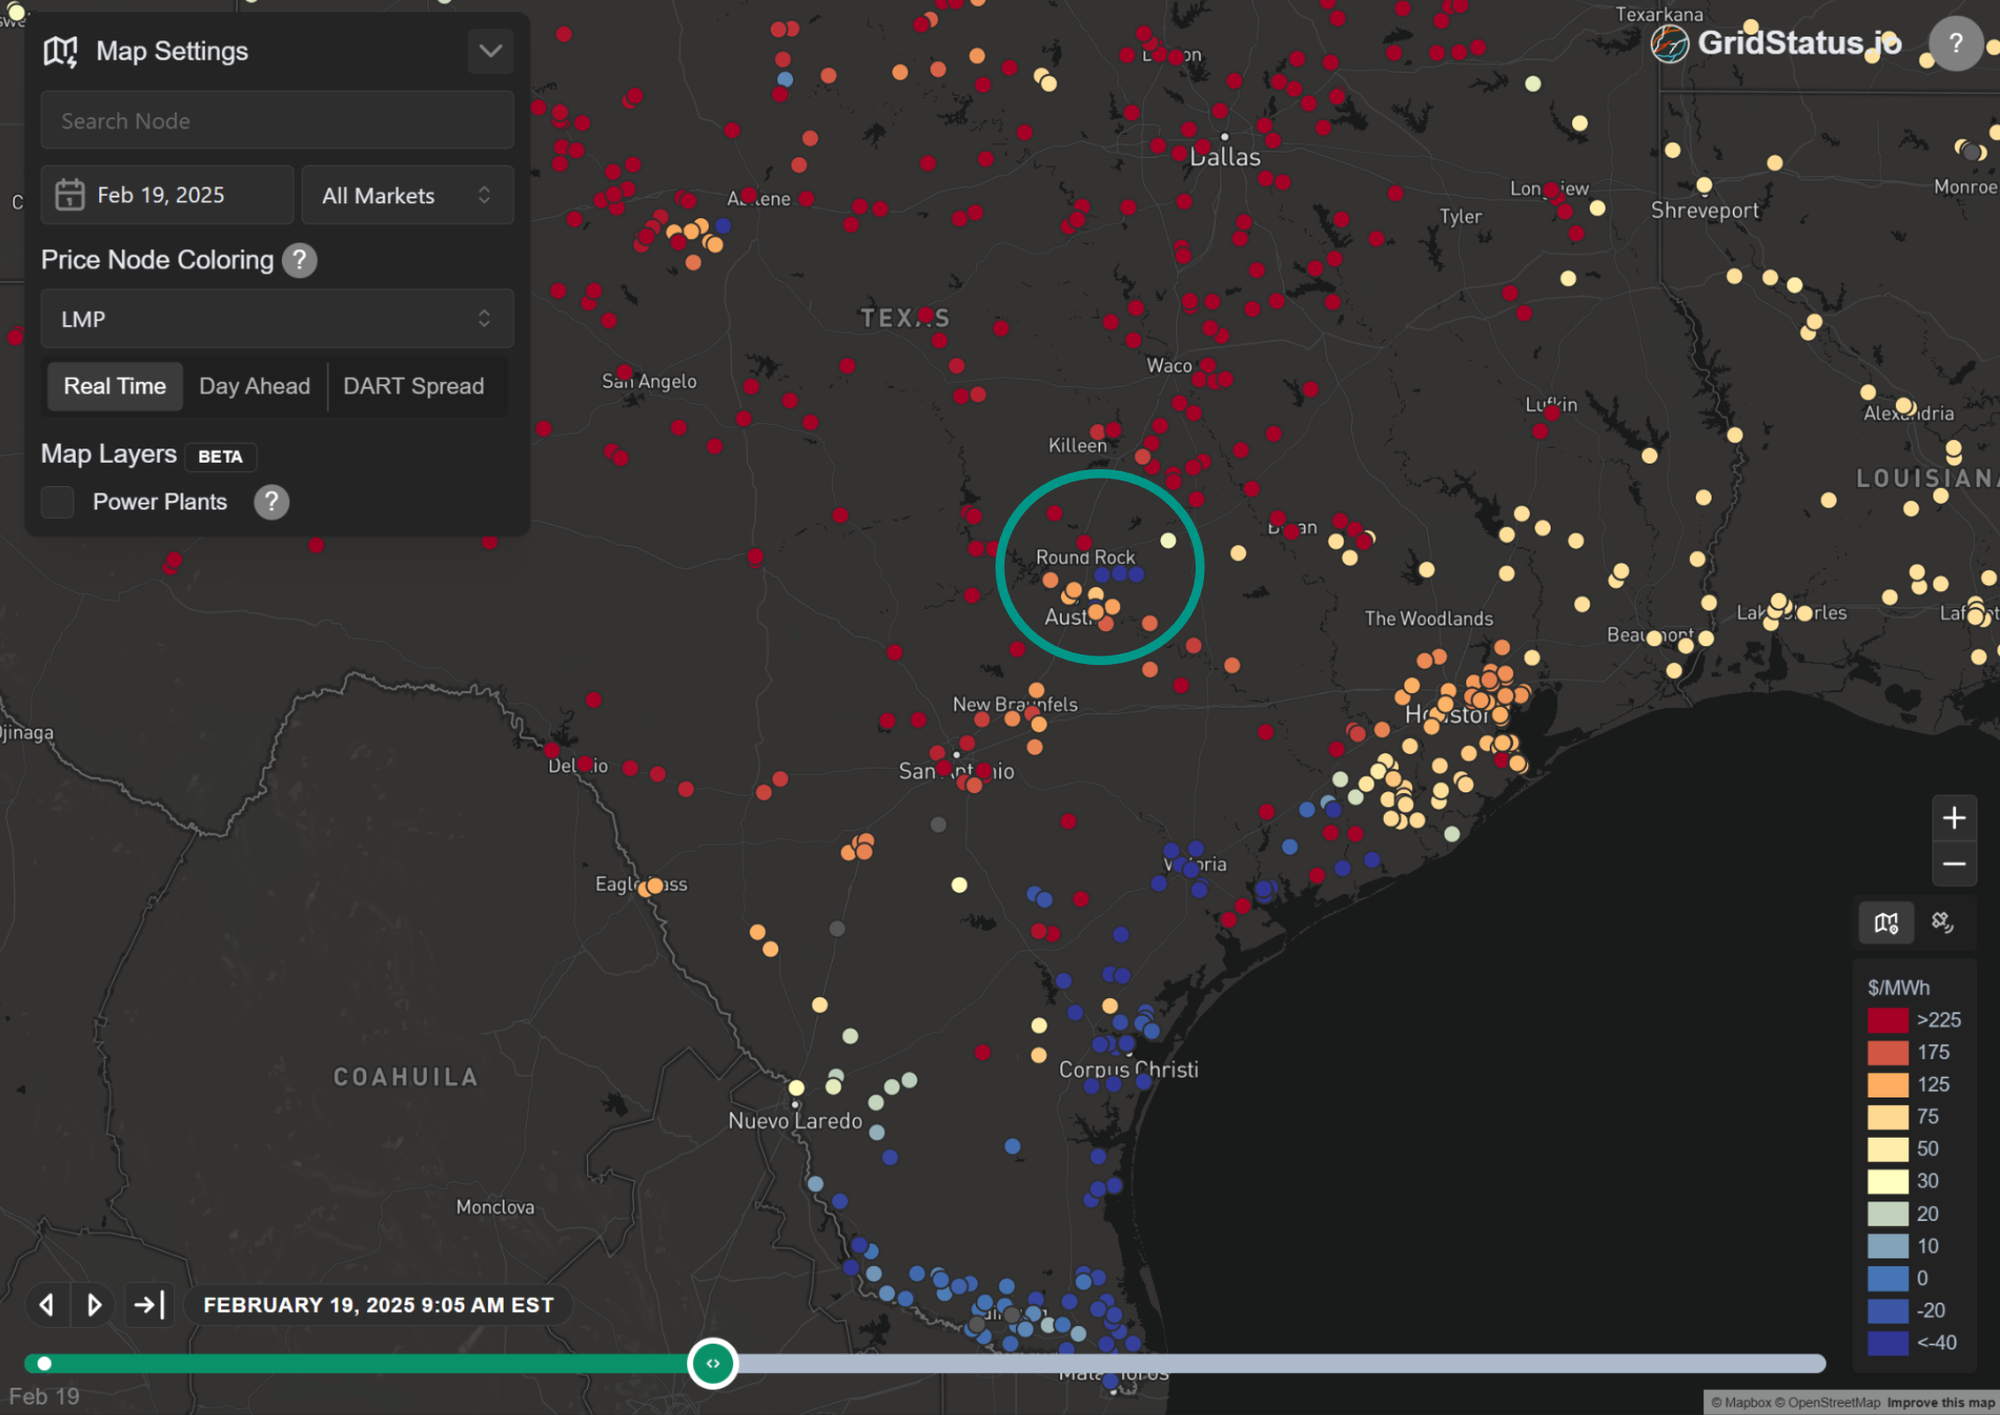
Here, we can turn to the price map set to February 19th set to the time of peak LCRA prices. With some prior knowledge of LCRA's relative territory, the area around Austin looks like a prime suspect due to the mix of high and low prices in close proximity, which can indicate each end of a difficult constraint.
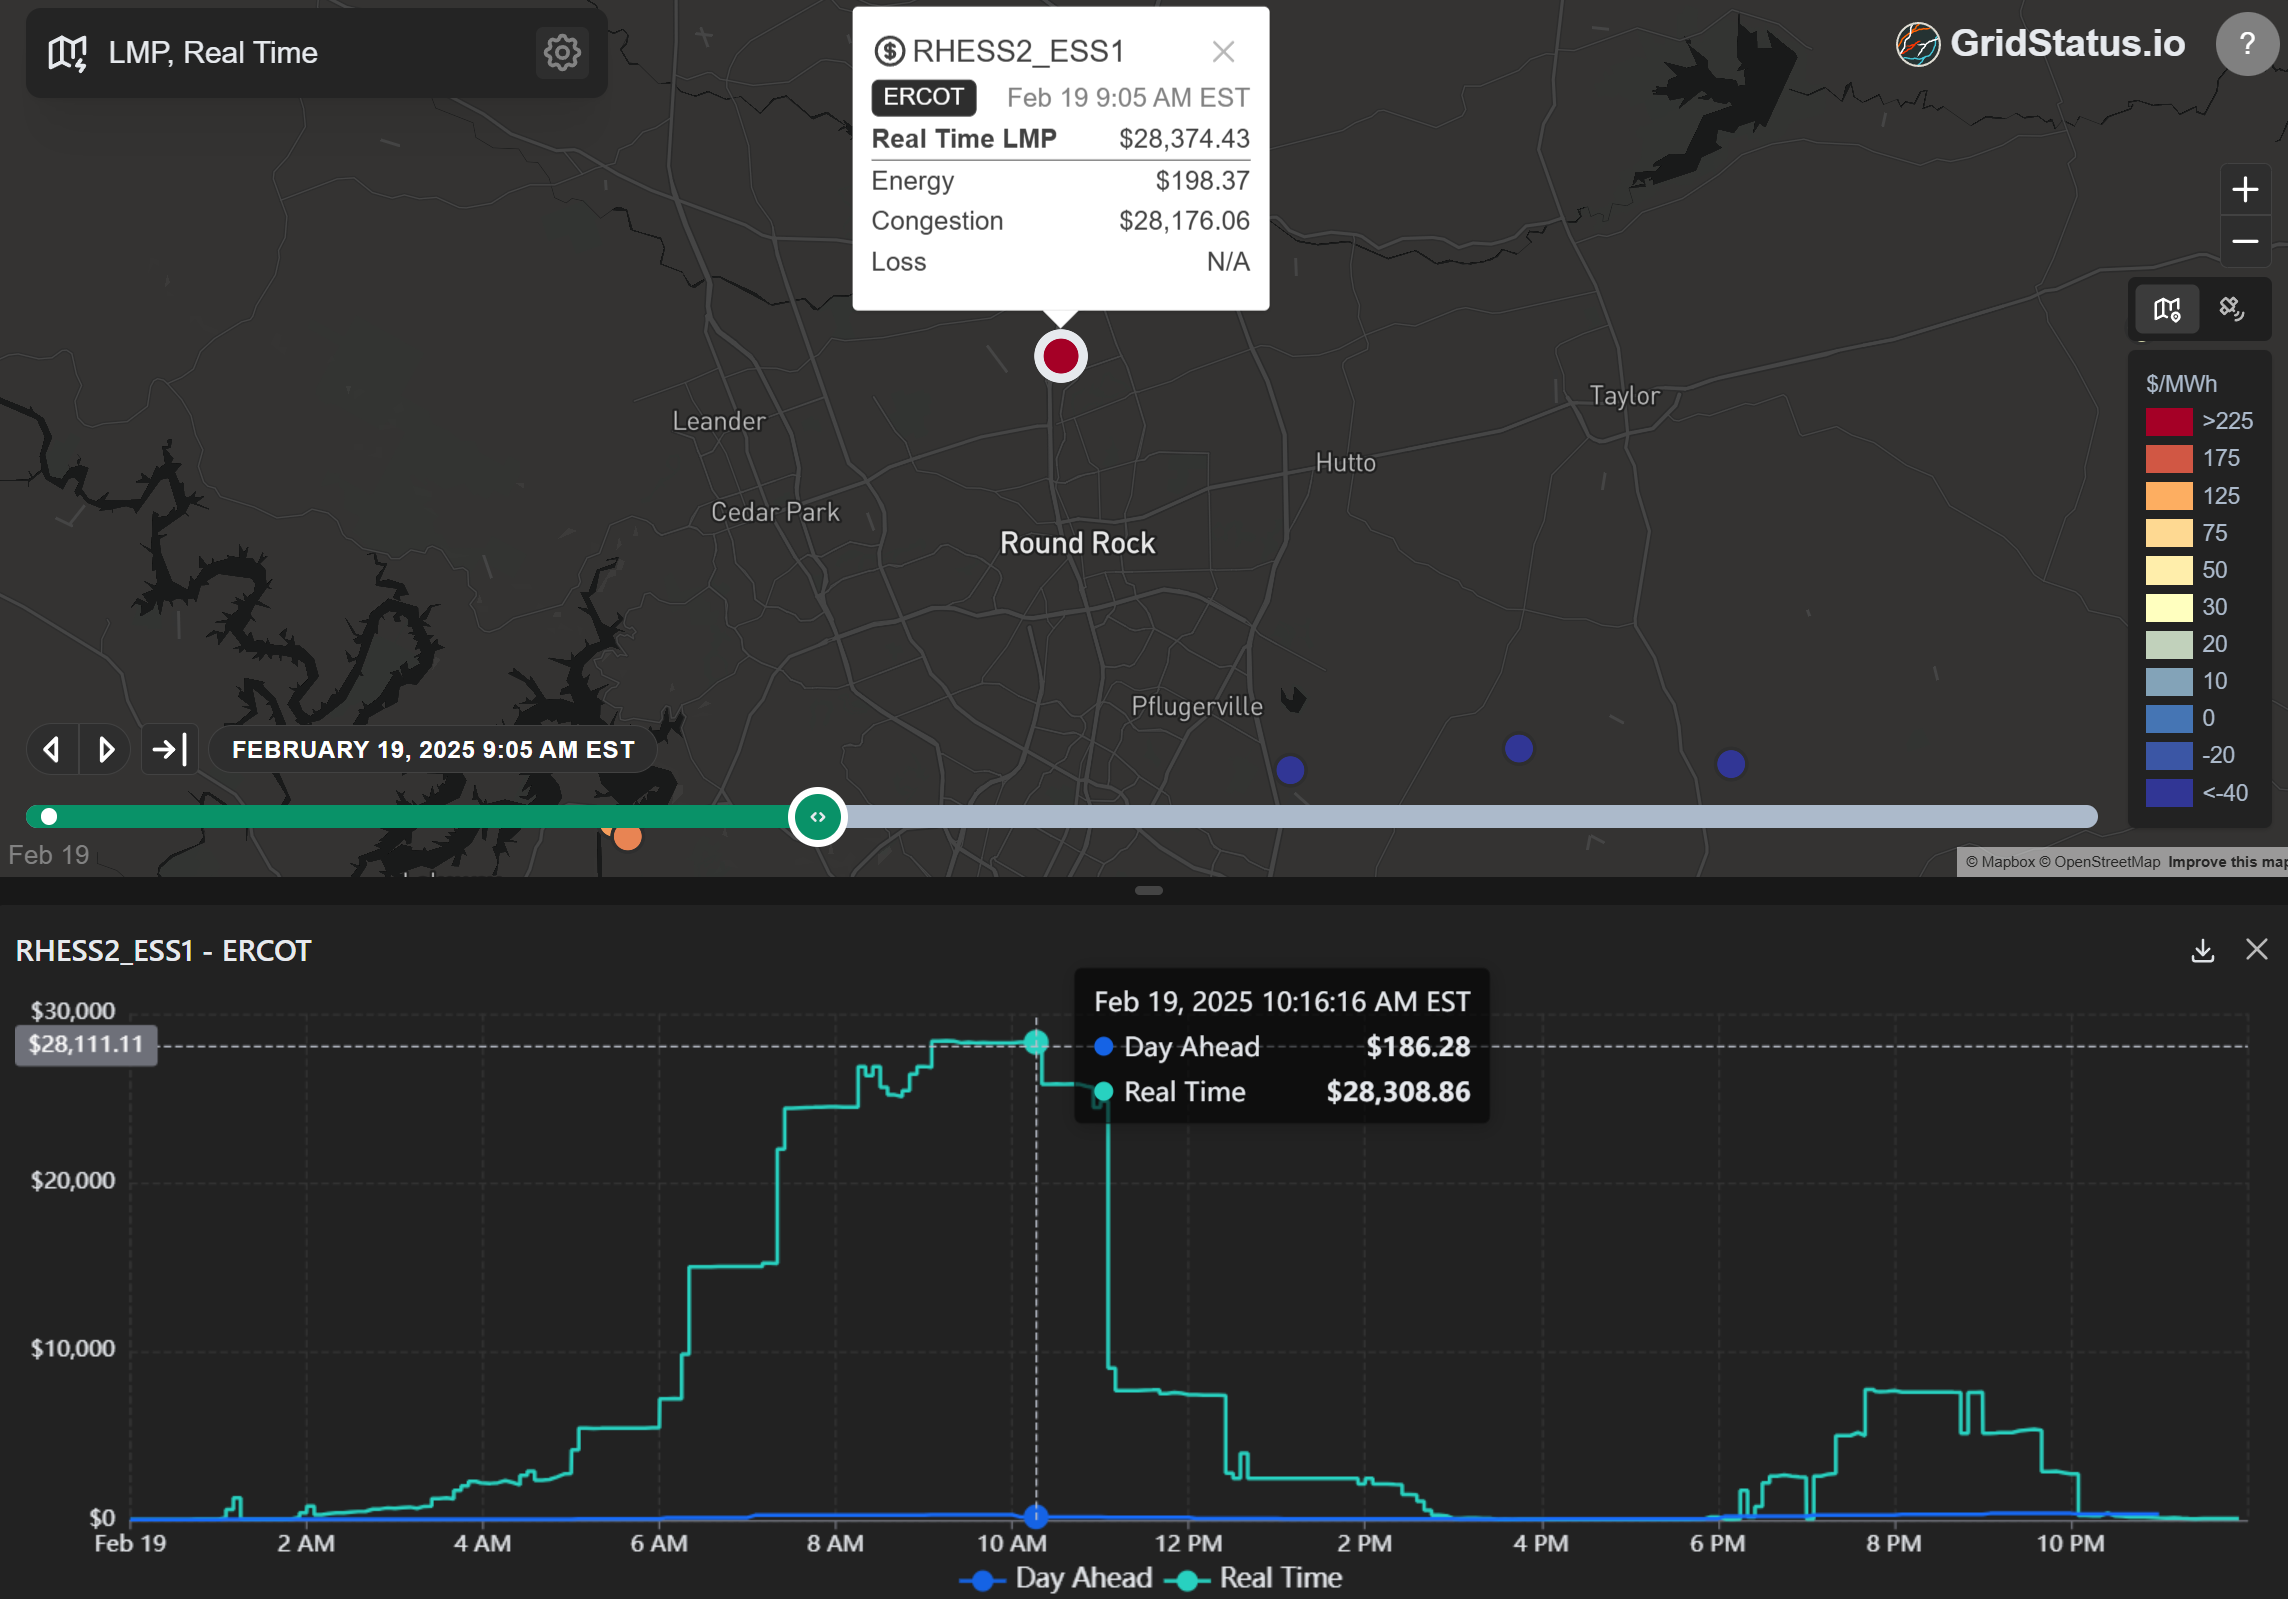
It might not be the first node you hover over or click on, but RHESS2_ESS1 jumps off the page the second you see a value. Clicking on the location shows the extent of these prices - not a single passing interval, but a ramp up to nearly $30k/MWh prices over several hours followed by a plateau above $25k.
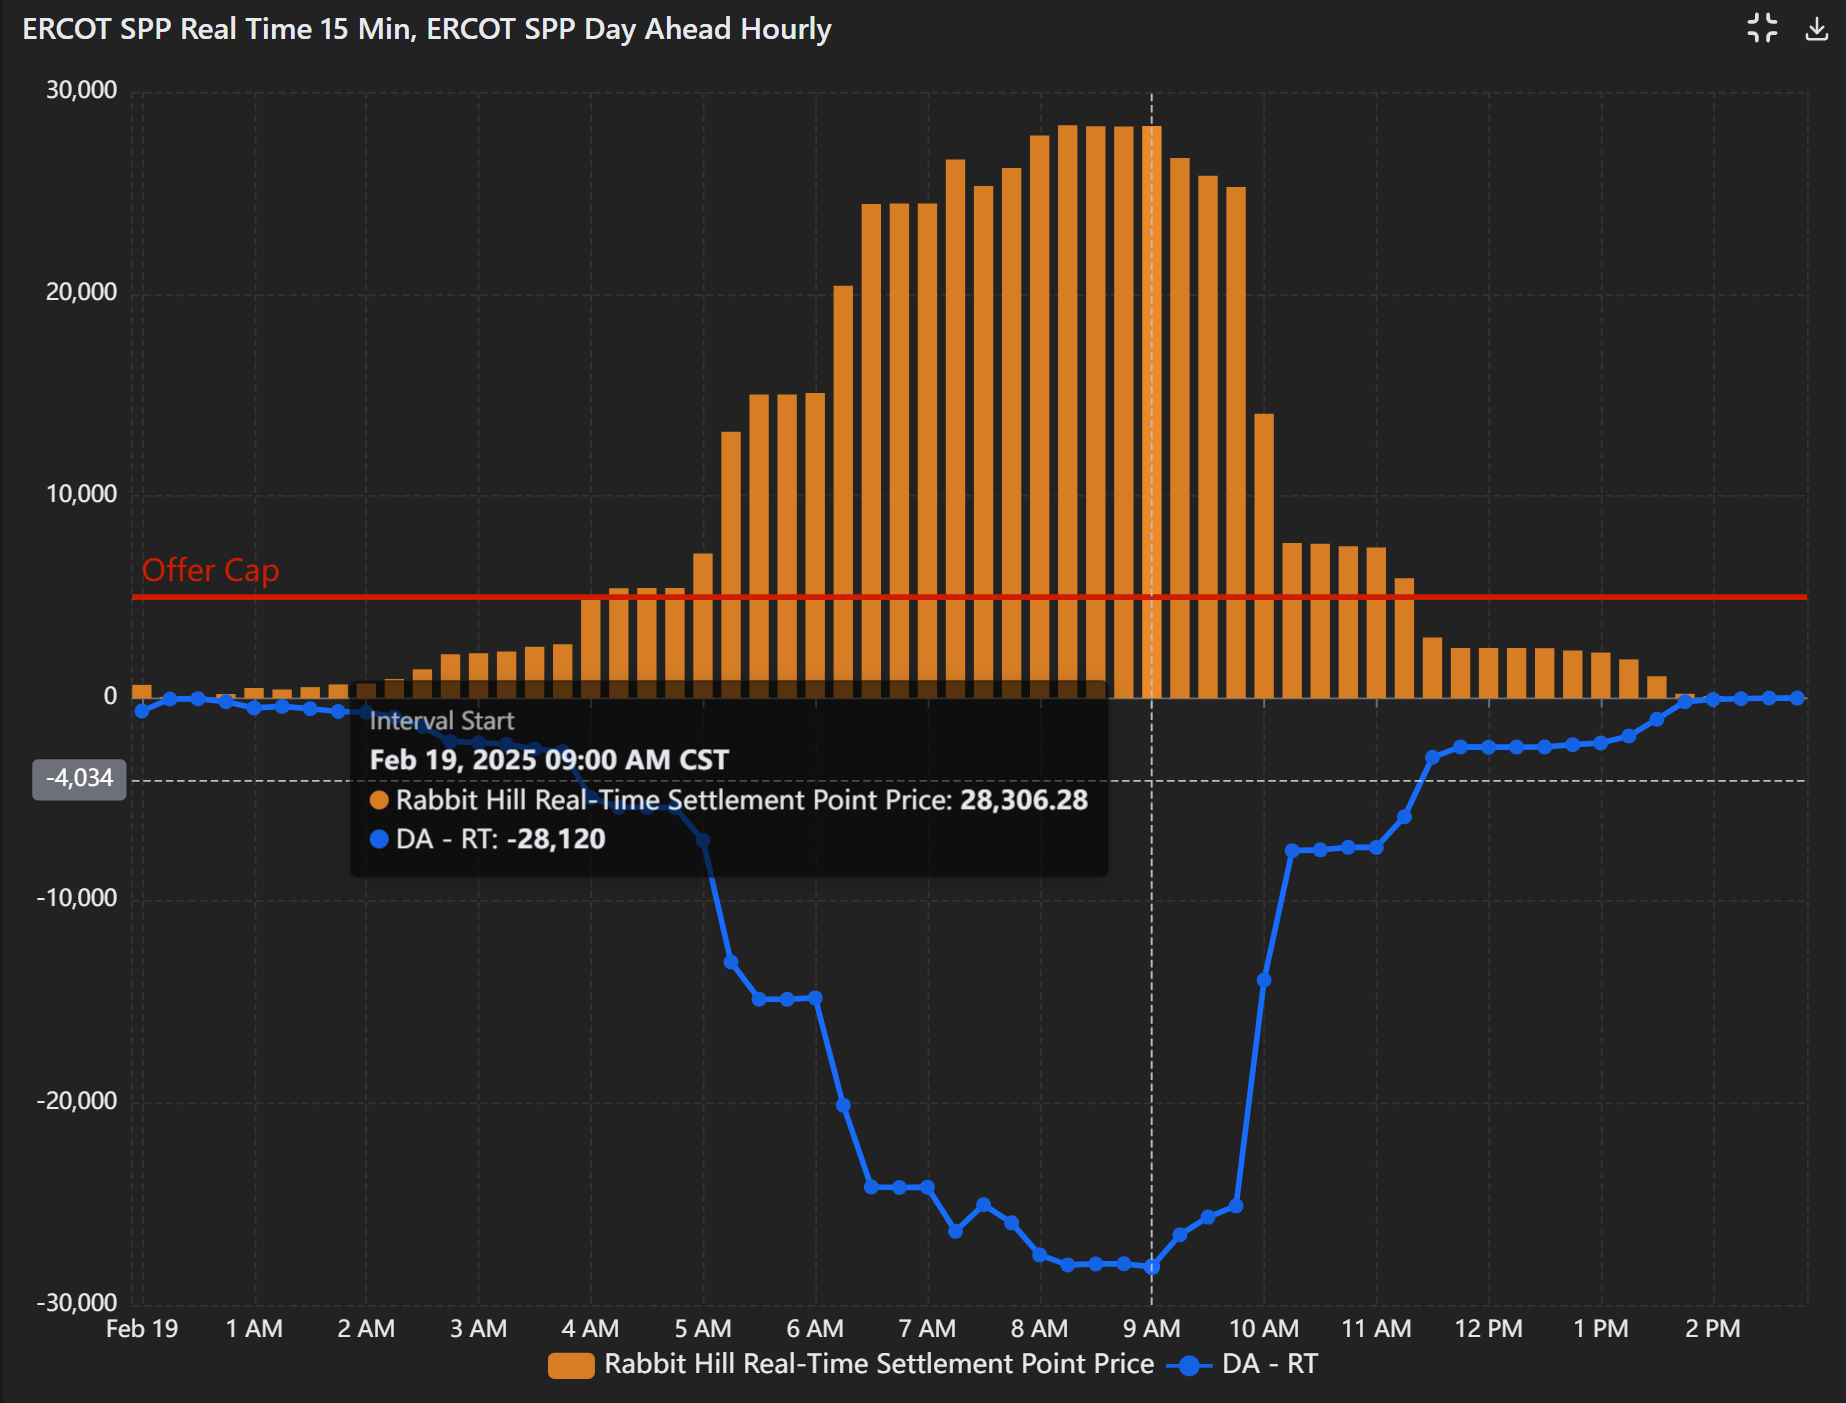
Taking things into the chart builder we can look at the 15-minute settlement point prices for this location over the course of the event. Using a newer feature, "reference marks" I added the offer cap at $5,000/MWh and then used a custom formula to calculate the DART spread, which reached a staggering -$28,120/MWh.
There's also an indirect method of finding these intervals and this location: just check the entire history of prices in ERCOT. While this is typically a compute-intensive operation that would take a long time to execute (let alone loading in data), we sync our data to Snowflake to make these kinds of analyses easier.
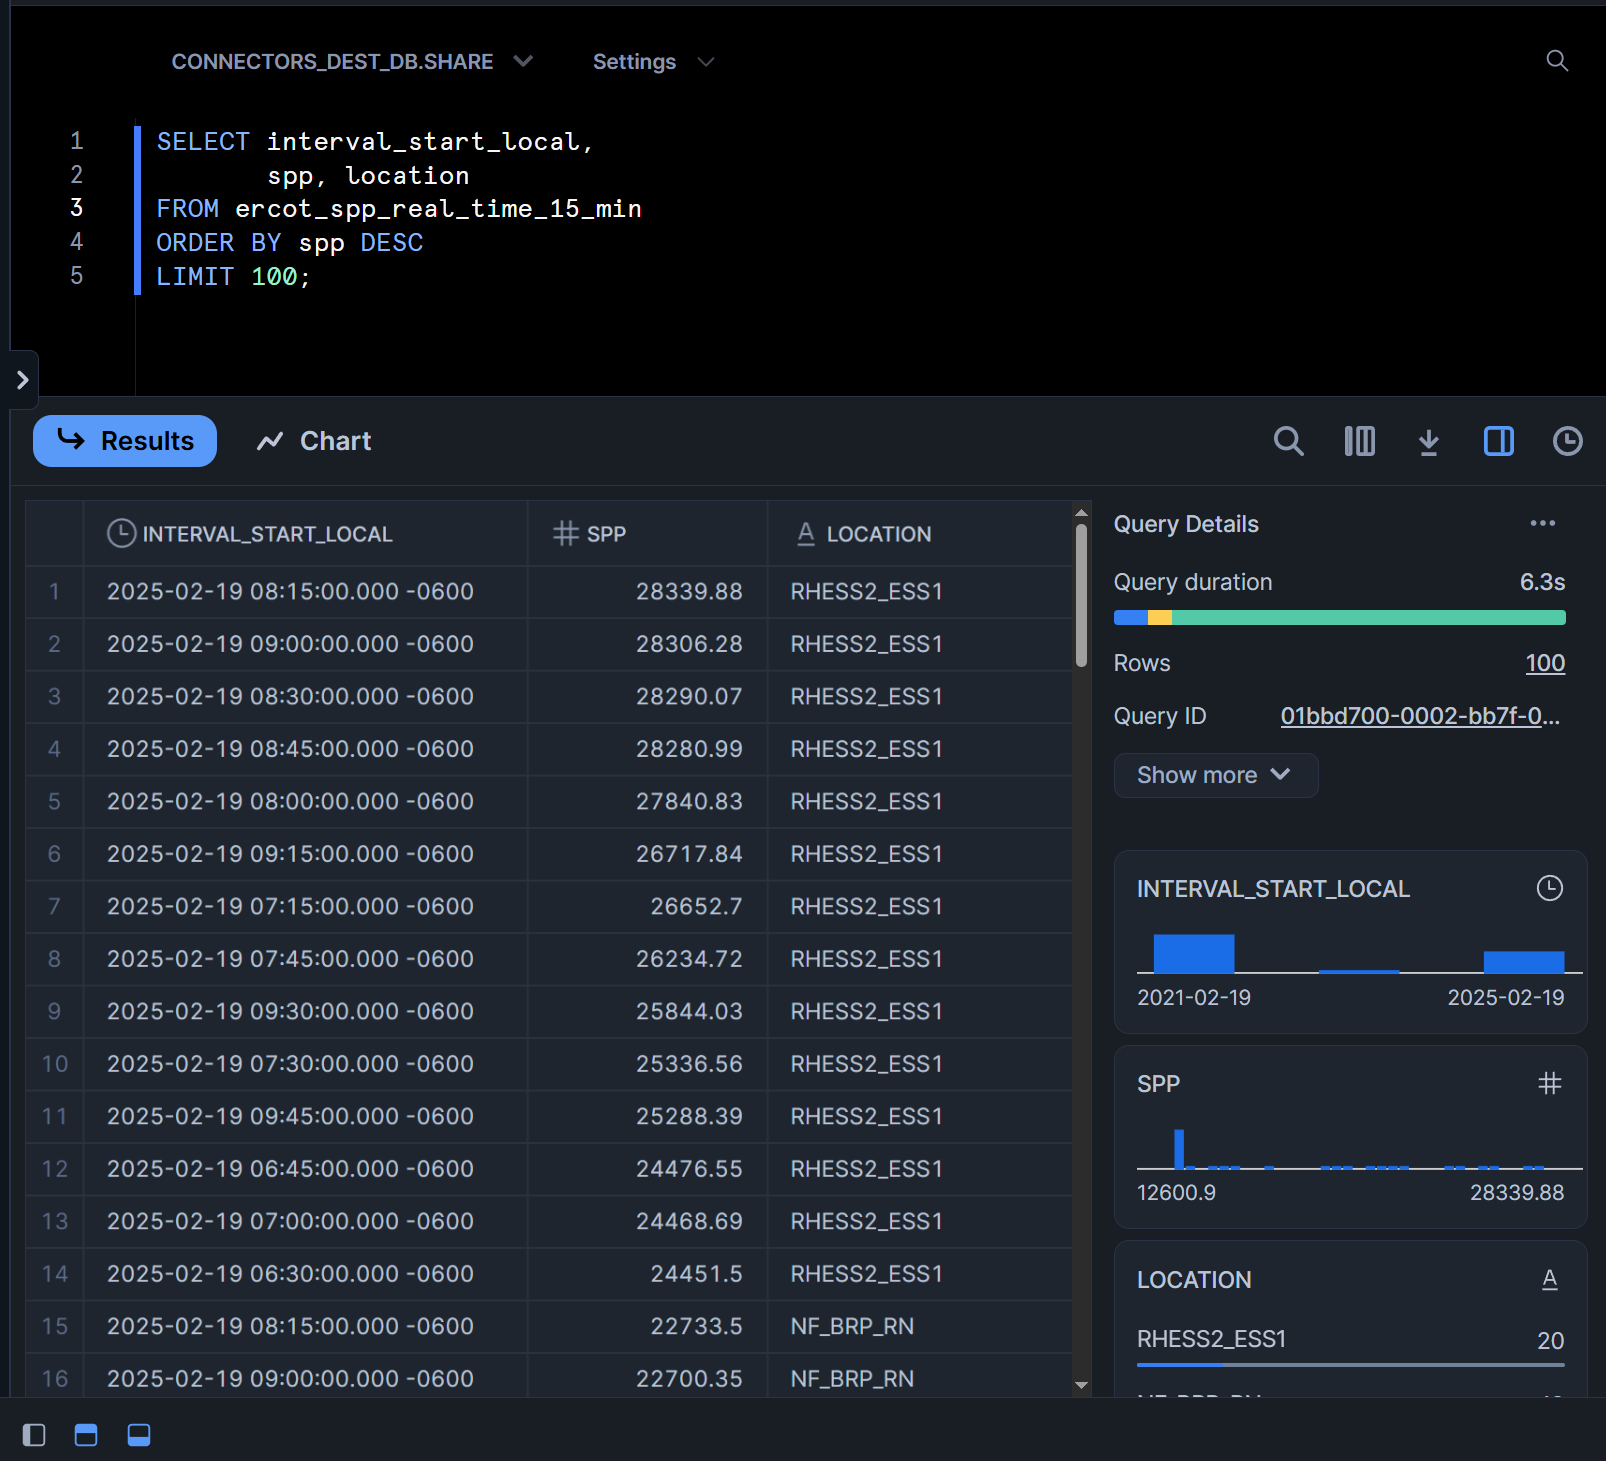
From this, we can see that Rabbit Hill intervals on February 19th were the first 14 highest-priced intervals in the history of our data. In fact, no other day shows up until 34th place.
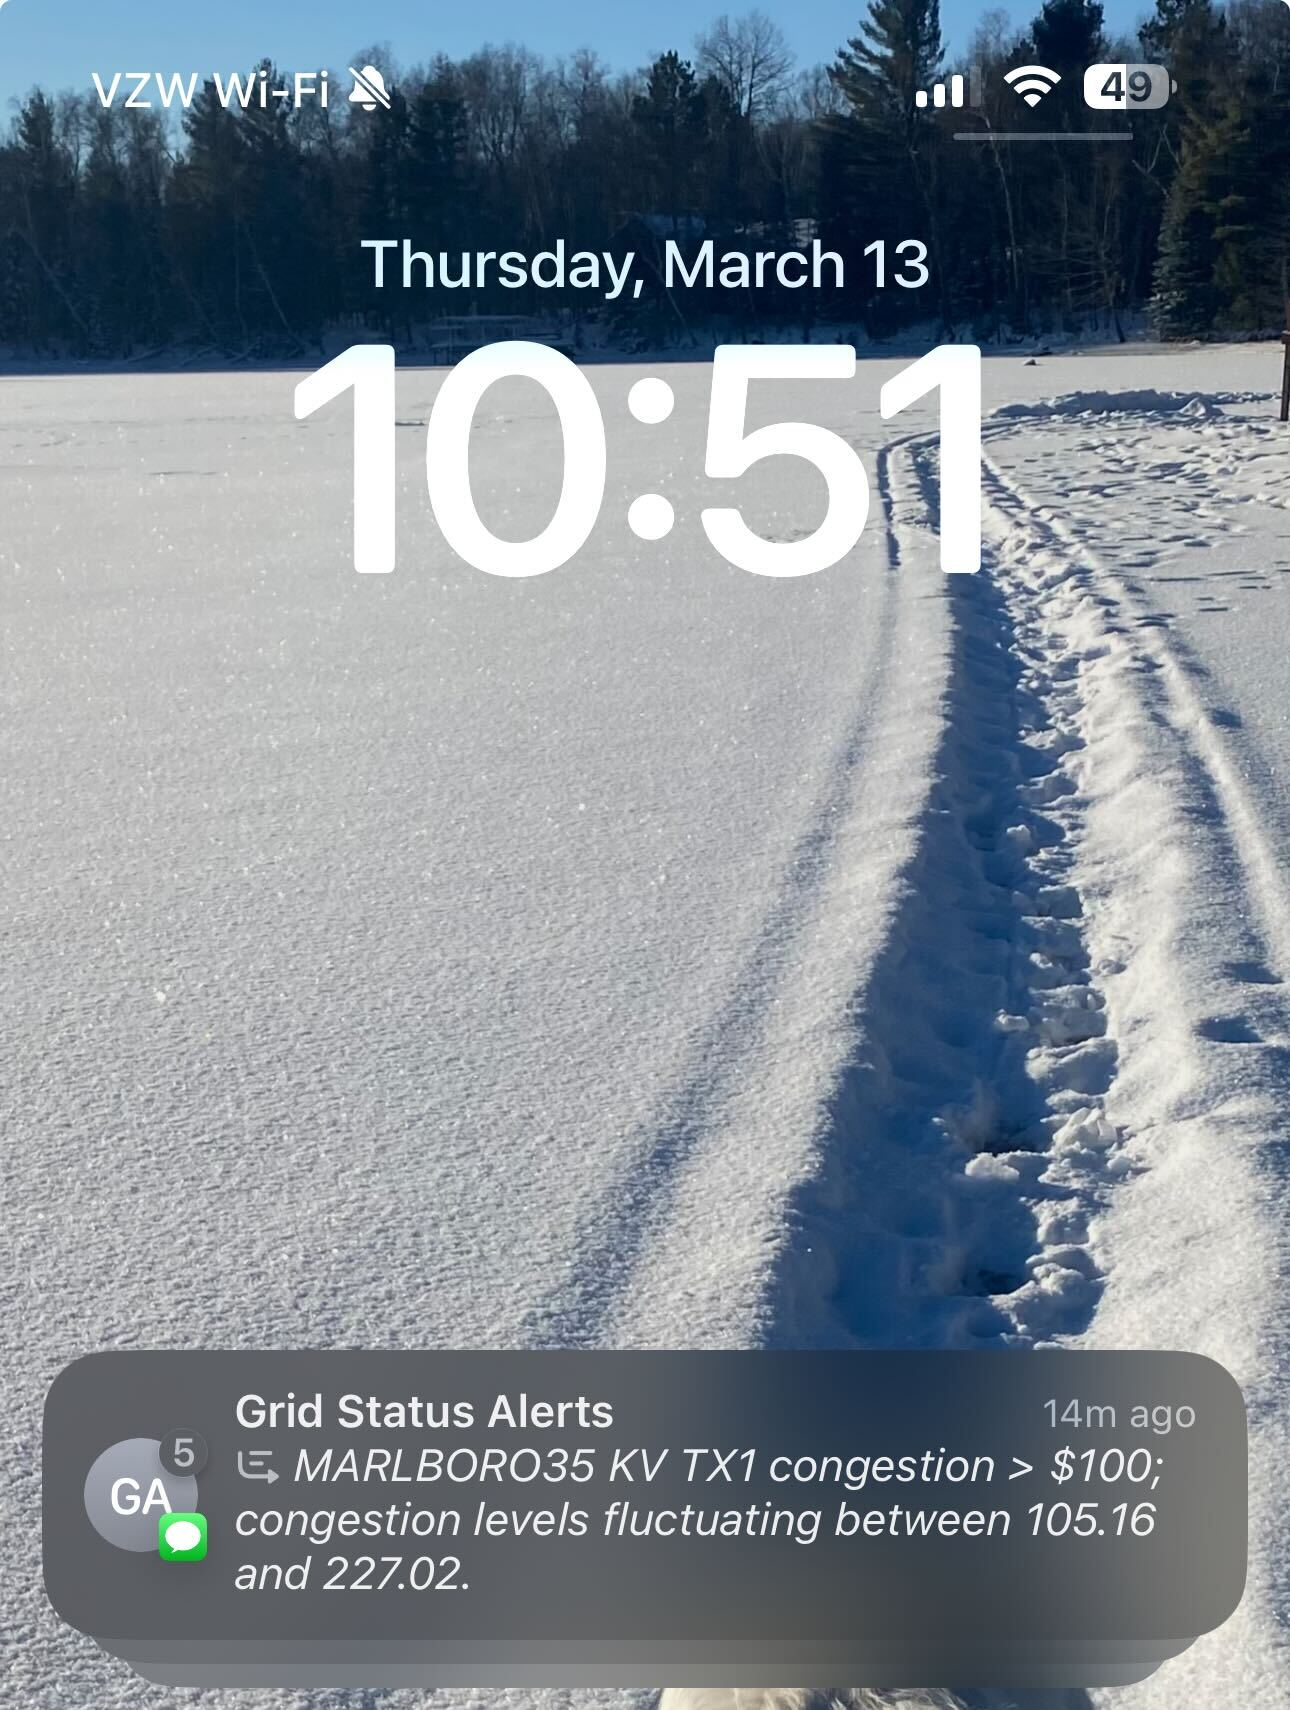
There is one even more unlikely route, if you already had an alert set for this location. We support email and SMS-based alerts on datasets in our database.
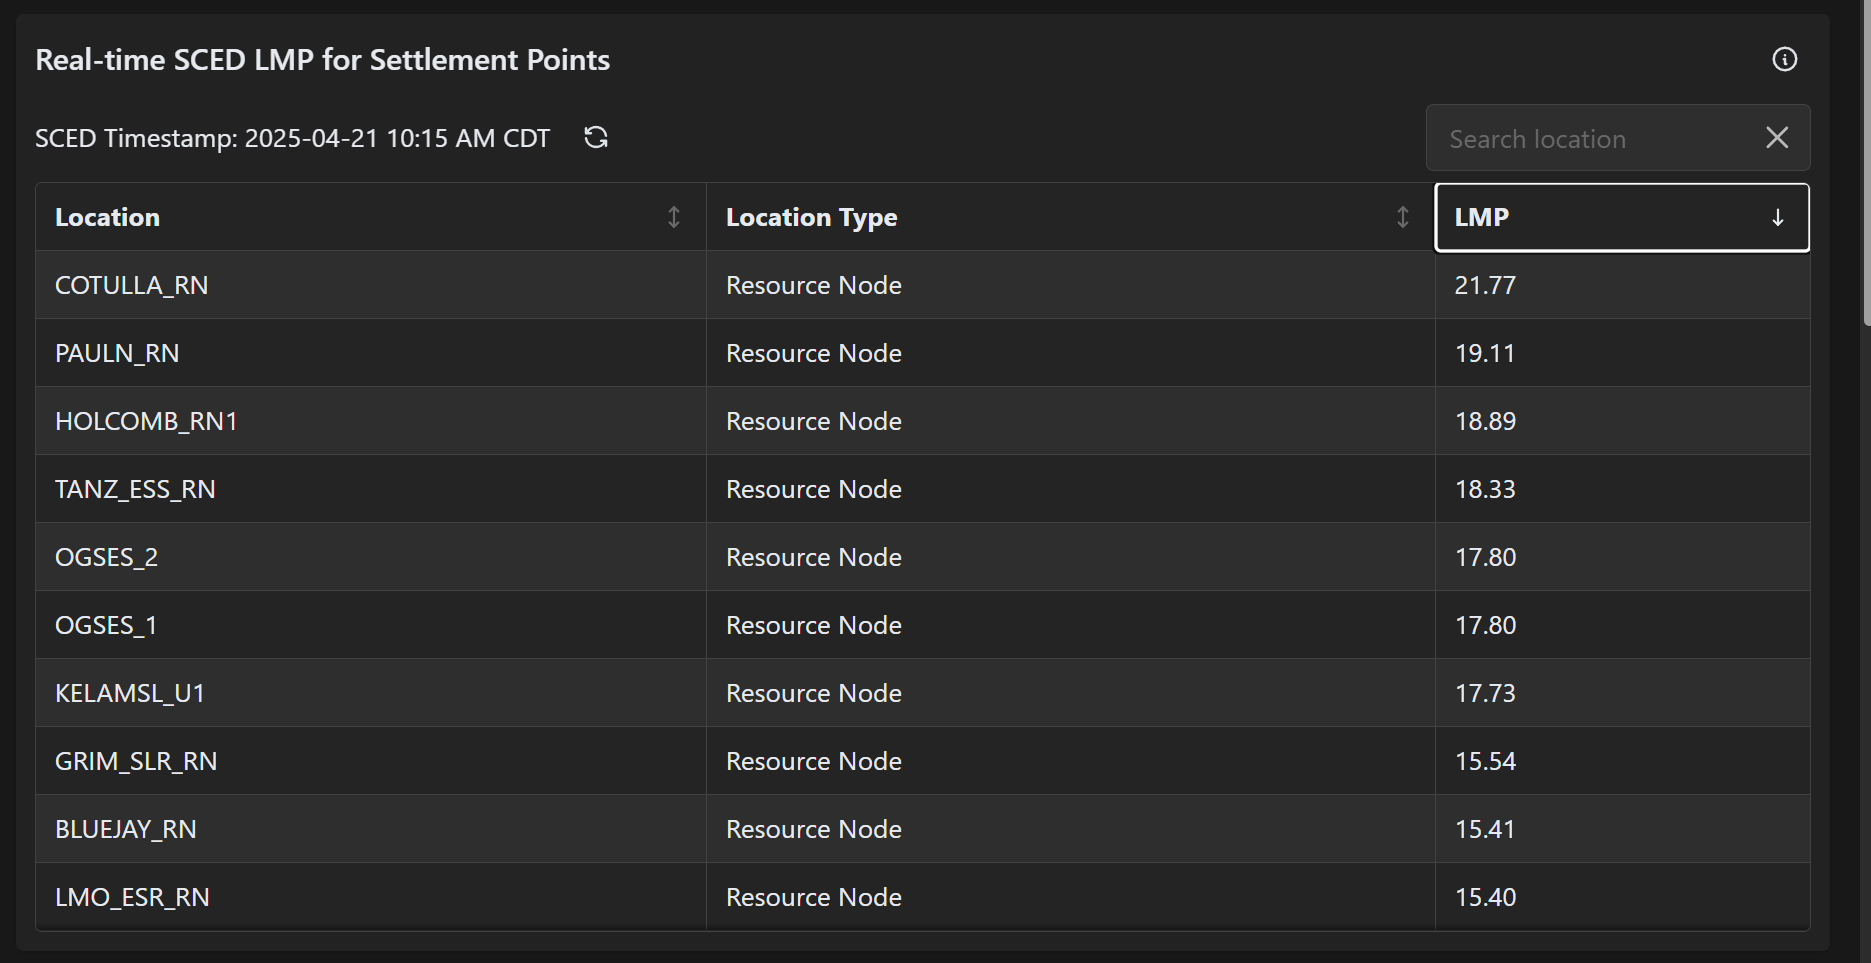
Of course, there is an easier way. If you were tracking the market on our ERCOT live page in real-time, the pricing table auto-updates and can be sorted from highest to lowest.
Wherefore art thou price cap?
Before turning to Rabbit Hill itself, a quick look into these prices.
Casual observers of the markets might be surprised that prices can reach these values, what does a cap mean if it's not the top? Part of this confusion stems from a regular misstatement in reporting and casual conversation alike - the tendency to use price cap in the place of offer cap. ERCOT has an offer cap, but not a price cap. These prices were the impacted by overlapping constraints which juiced local pricing to wild levels, above and beyond the offer cap, the most that the Rabbit Hill battery could offer its energy for, $5,000/MWh. So the important datasets here are constraints and shift factors.
Constraints are tricky in that they can require some pretty substantial context to parse and understand. While we collect this data and serve it via the API and Snowflake, we're still experimenting behind the scenes on the best way to make it accessible in the platform. If you have ideas or preferences, feel free to reach out. We'll keep this simple by pulling the table for one of the highest-priced intervals, filtering to non-zero shadow prices, and applying a bit of formatting.
from gridstatusio import GridStatusClient
from tabulate import tabulate

GS_KEY = os.environ["GS_API_KEY"]
client = GridStatusClient(GS_KEY)

df_constraints = client.get_dataset(
    dataset = 'ercot_shadow_prices_sced',
    start = '2025-02-19 08:40:00',
    end = '2025-02-19 08:45:00',
    timezone = 'US/Central',
    )

df_constraints = df_constraints[df_constraints['shadow_price'] > 0]

df_clean = df_constraints.drop(columns=['sced_timestamp_local',
    'sced_timestamp_utc',
    'constraint_id', 'cct_status', 'from_station_kv',
                                   'to_station_kv', ])

df_clean['shadow_price'] = df_clean['shadow_price'].map('${:,.0f}'.format)
df_clean['max_shadow_price'] = df_clean['max_shadow_price'].map('${:,.0f}'.format)

print(tabulate(df_clean, headers='keys', tablefmt='psql'))
This returns the below table, which shows a high number of constraints where MW limits are being violated.
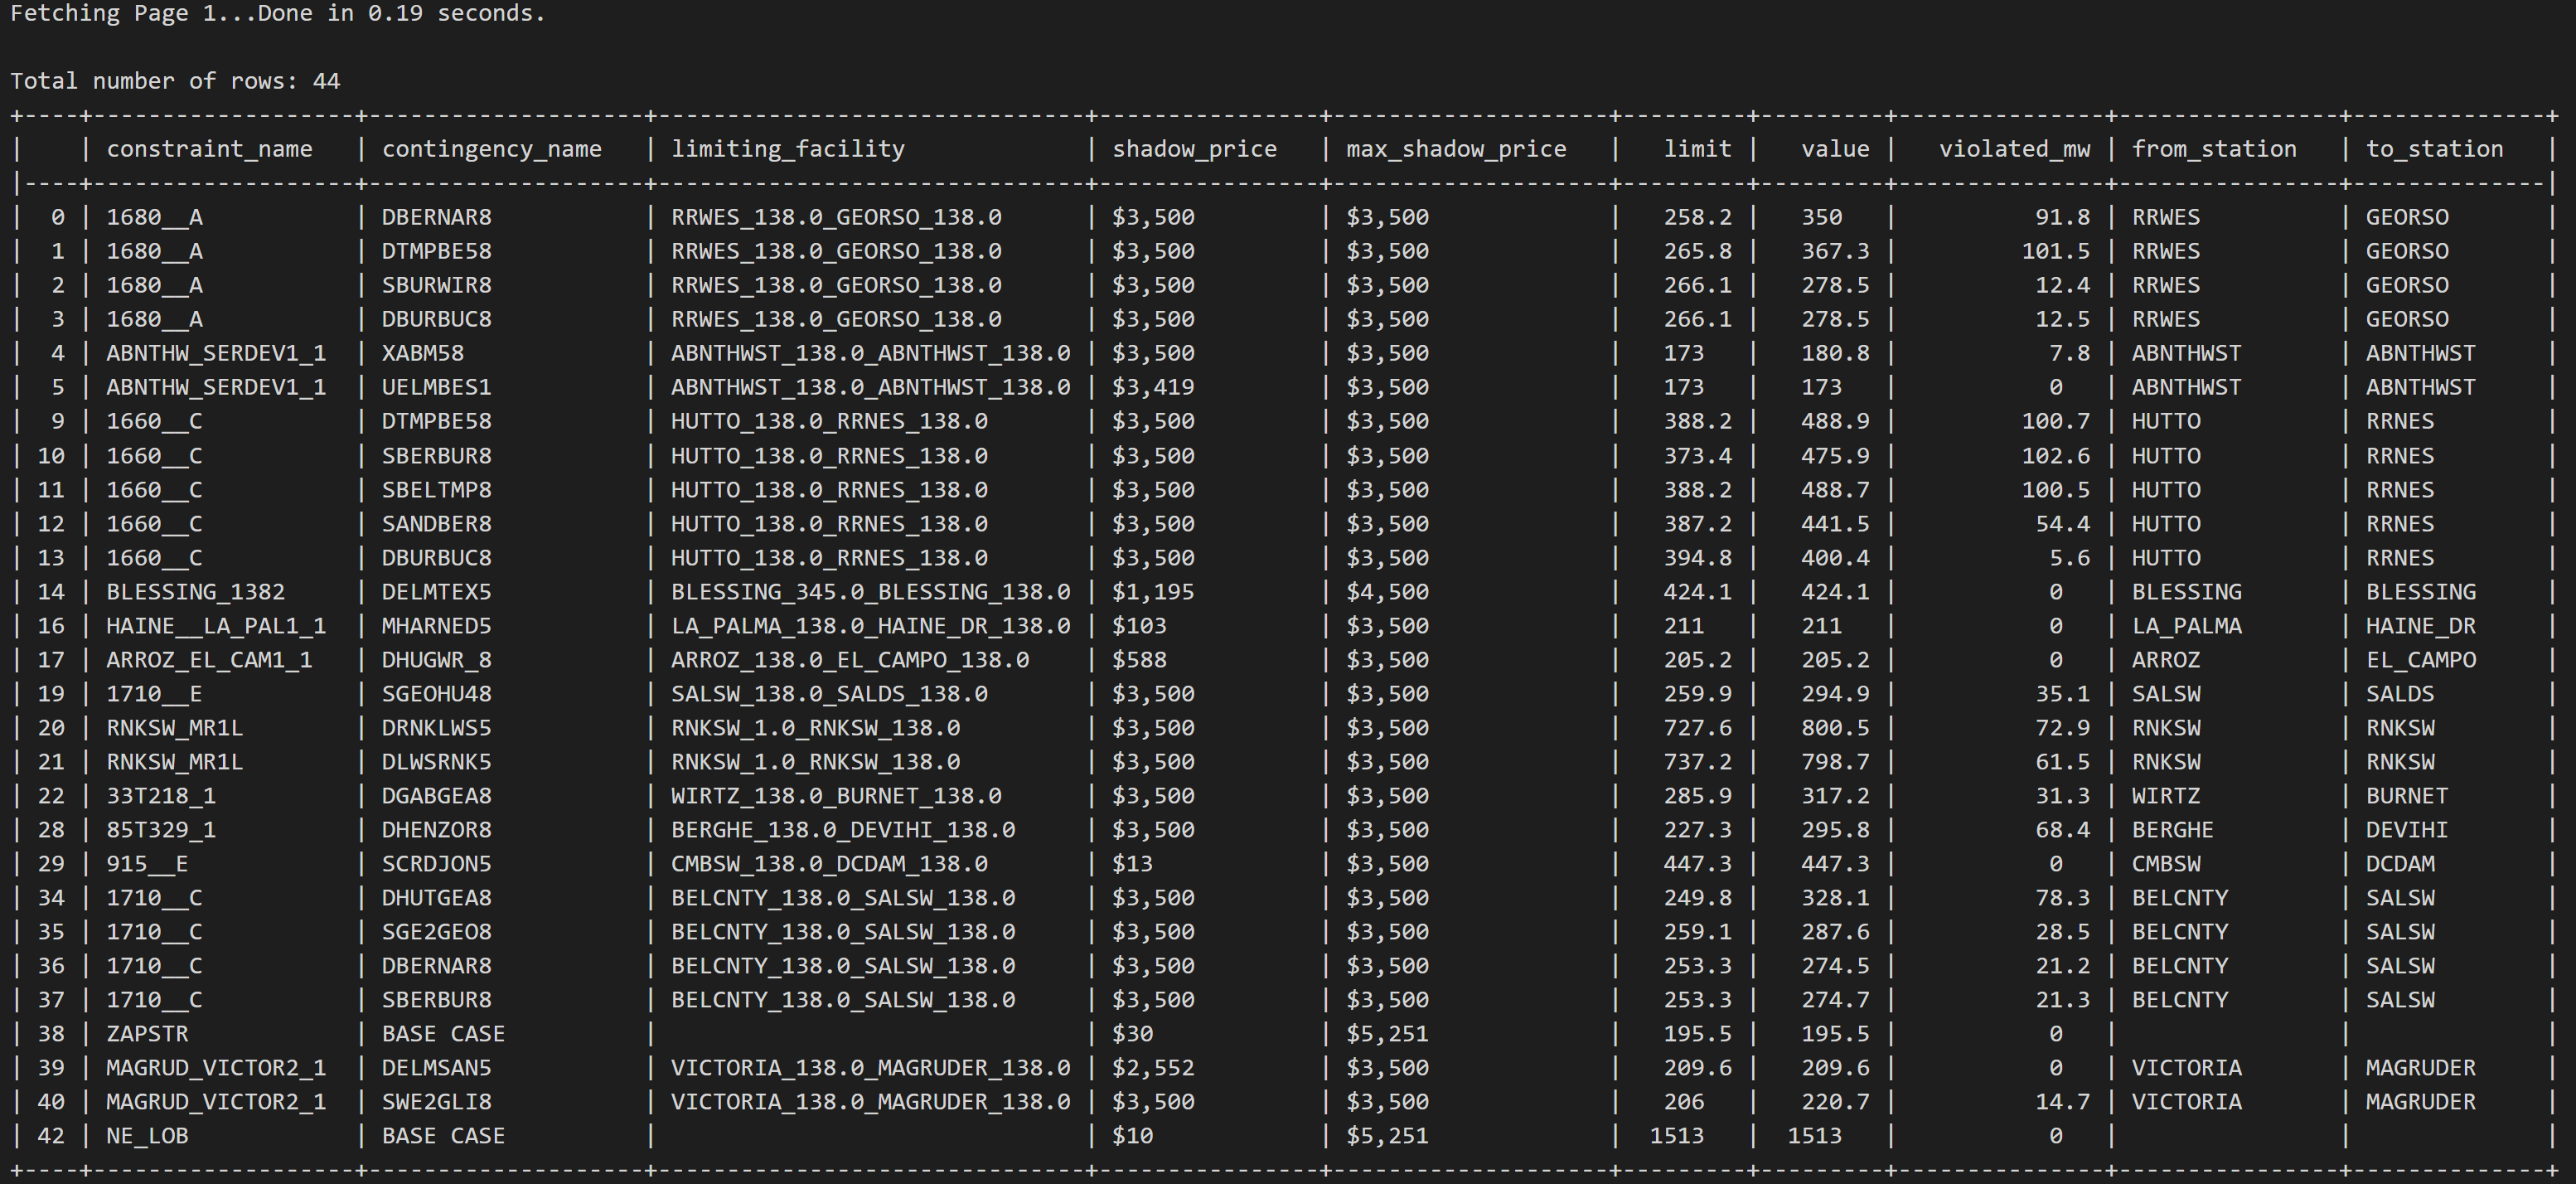
Some of the highest shadow price values share constraint_name and limiting_facility values with different contingency_name values. These overlapping constraints are what ultimately drove the price so high. Now, if you have a map of ERCOT substations and settlement points in your head you may recognize that many of the from and to_station values are in a particular area near Austin. Without that, though, how can you recognize that any of this is related to Rabbit Hill? ERCOT's Monthly Outlook for Resource Adequacy provides a clue.
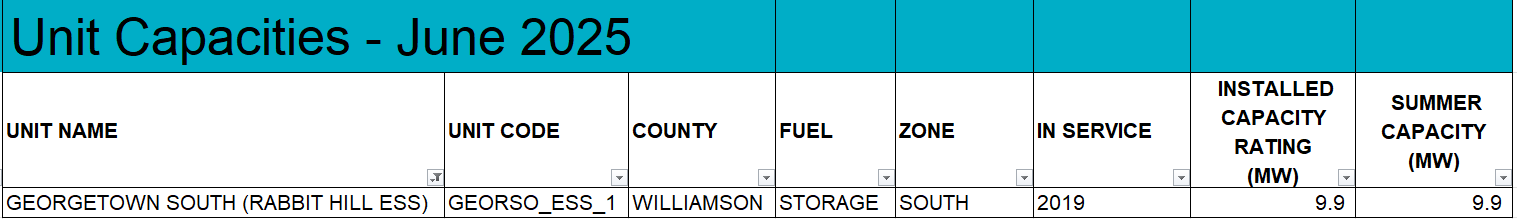
So Rabbit Hill is Georgetown South, and the unit code, GEORSO_ESS_1, matches one of the substation values in the constraint data. With the knowledge that the RHESS2_ESS1 settlement point is at the GEORSO substation we turn to the last puzzle piece, shift factors.
Simply put, shift factors represent the impact of injecting or withdrawing a MW at once location on every other piece of the grid. Unfortunately, shift factors are almost universally considered Critical Energy Infrastructure Information (CEII) and not publicly available. This also means that we can't publish that data publicly despite being an ERCOT member. Fortunately, this data is becoming public in ERCOT following a PUCT vote this past January to approve data access NPRRs which move certain data to the public website. However, it has yet to be implemented (look forward to some cool analyses from us once we've got the greenlight to work with it publicly).
When Rabbit Hill injects 1 MW, most of the impact should occur at GEORSO and adjacent substations, with the shift factor value represented as a %. Applying this % to the shadow_price we finally get to the stacking dollar amounts that led to $28,000/MWh prices. If a MWh injected by Rabbit Hill has a relief shift factor of 70% to the constraints at GEORSO, that's:
($3,500 * 4 * 0.7) = $9,800
Adding up the remaining $3,500 constraints it's not difficult to get to $28,000 with a range of different shift factors. The relief piece is also important, we see negative prices nearby on the system because injecting a MW at those substations would exacerbate the conditions that are generating the congestion price. Understanding whether your MWs are going to relieve or exacerbate a constraint is critical to successful operations, particularly for batteries.
Lagomorph Logistics
Now, finally, we turn to Rabbit Hill itself. First, let's build a quick one-off chart to see some of this unit's history leading up to the event.
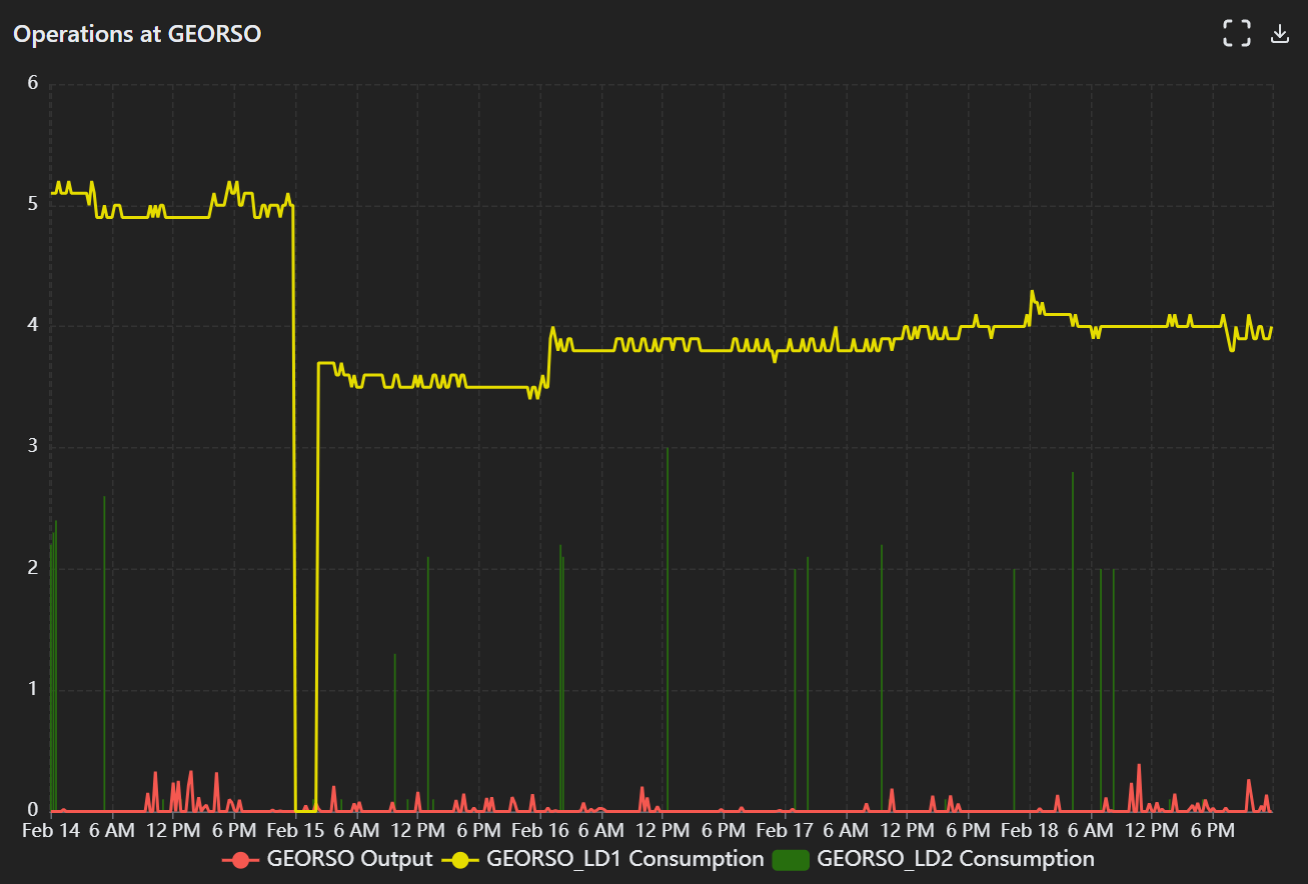
Right off the bat, there are two loads at the substation that appear in the SCED data. Unsurprisingly, data suggests that GEORSO_LD2 is the one we're interested in. ERCOT's Real-Time Co-optimization plus Batteries Task Force (RTCBTF) published a list mapping together the gen and load sides of batteries earlier in the year, which indicated LD2 as the correct pair with GEORSO_ESS_1 (Rabbit Hill). Additionally, we can pull the data for both locations without start and end arguments then check for the first time they show up.
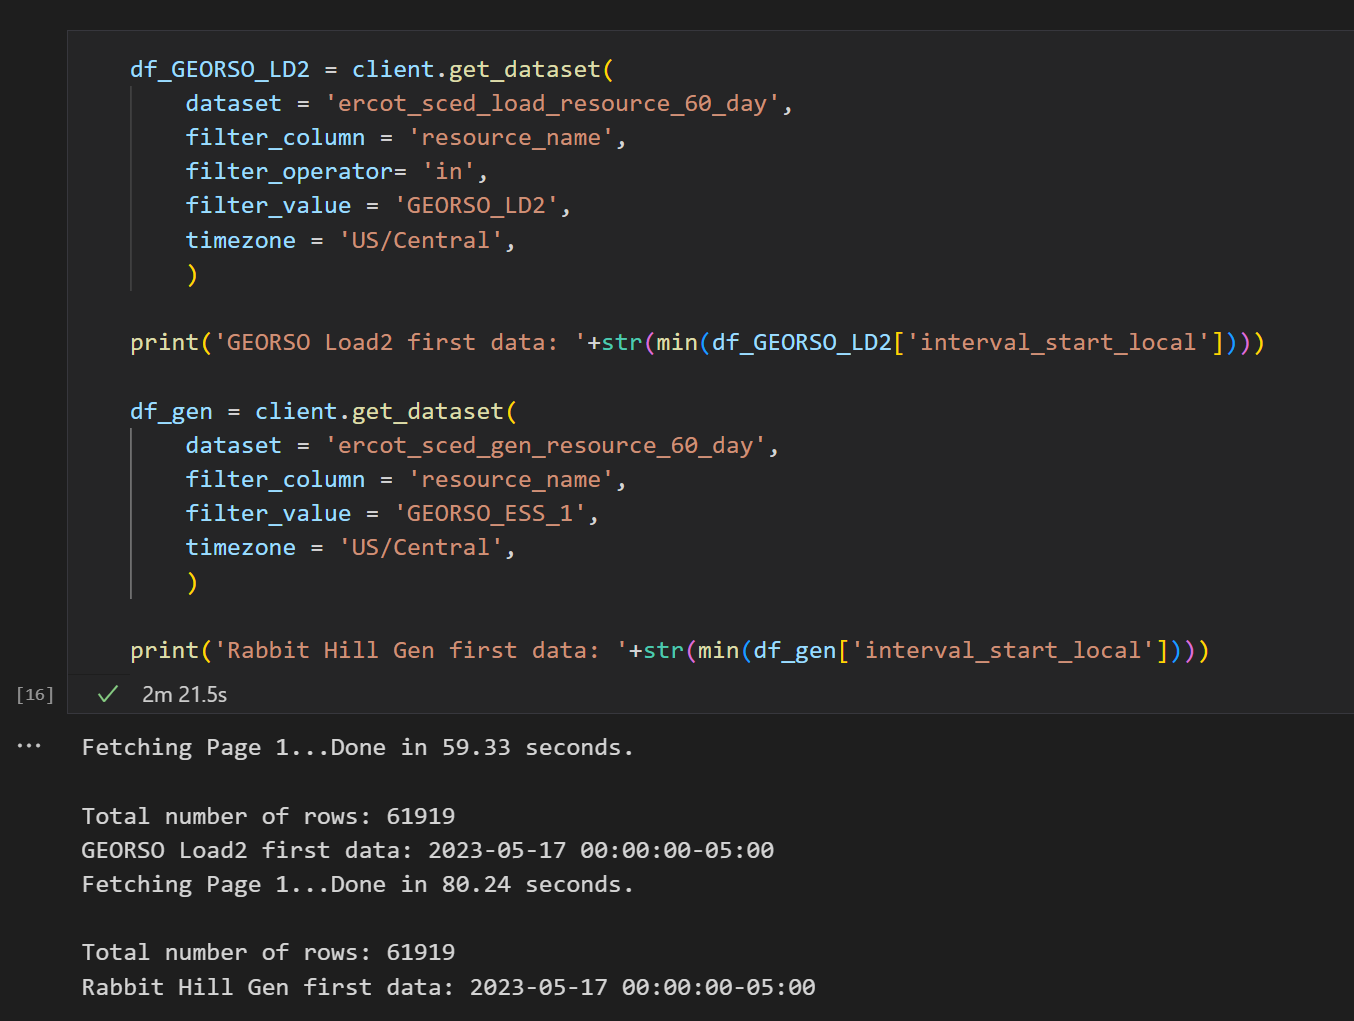
The dates match, and while not in the screenshot, I did check GEORSO_LD1 as well, its data begins on November 2nd, 2018, well before Rabbit Hill came online. Battery data will get a useful facelift when ERCOT implements the RTC+B project, as batteries will become unified assets instead of their current split nature.
So now that we know the names for each side of Rabbit Hill, how did it do on the 19th? It did ok.
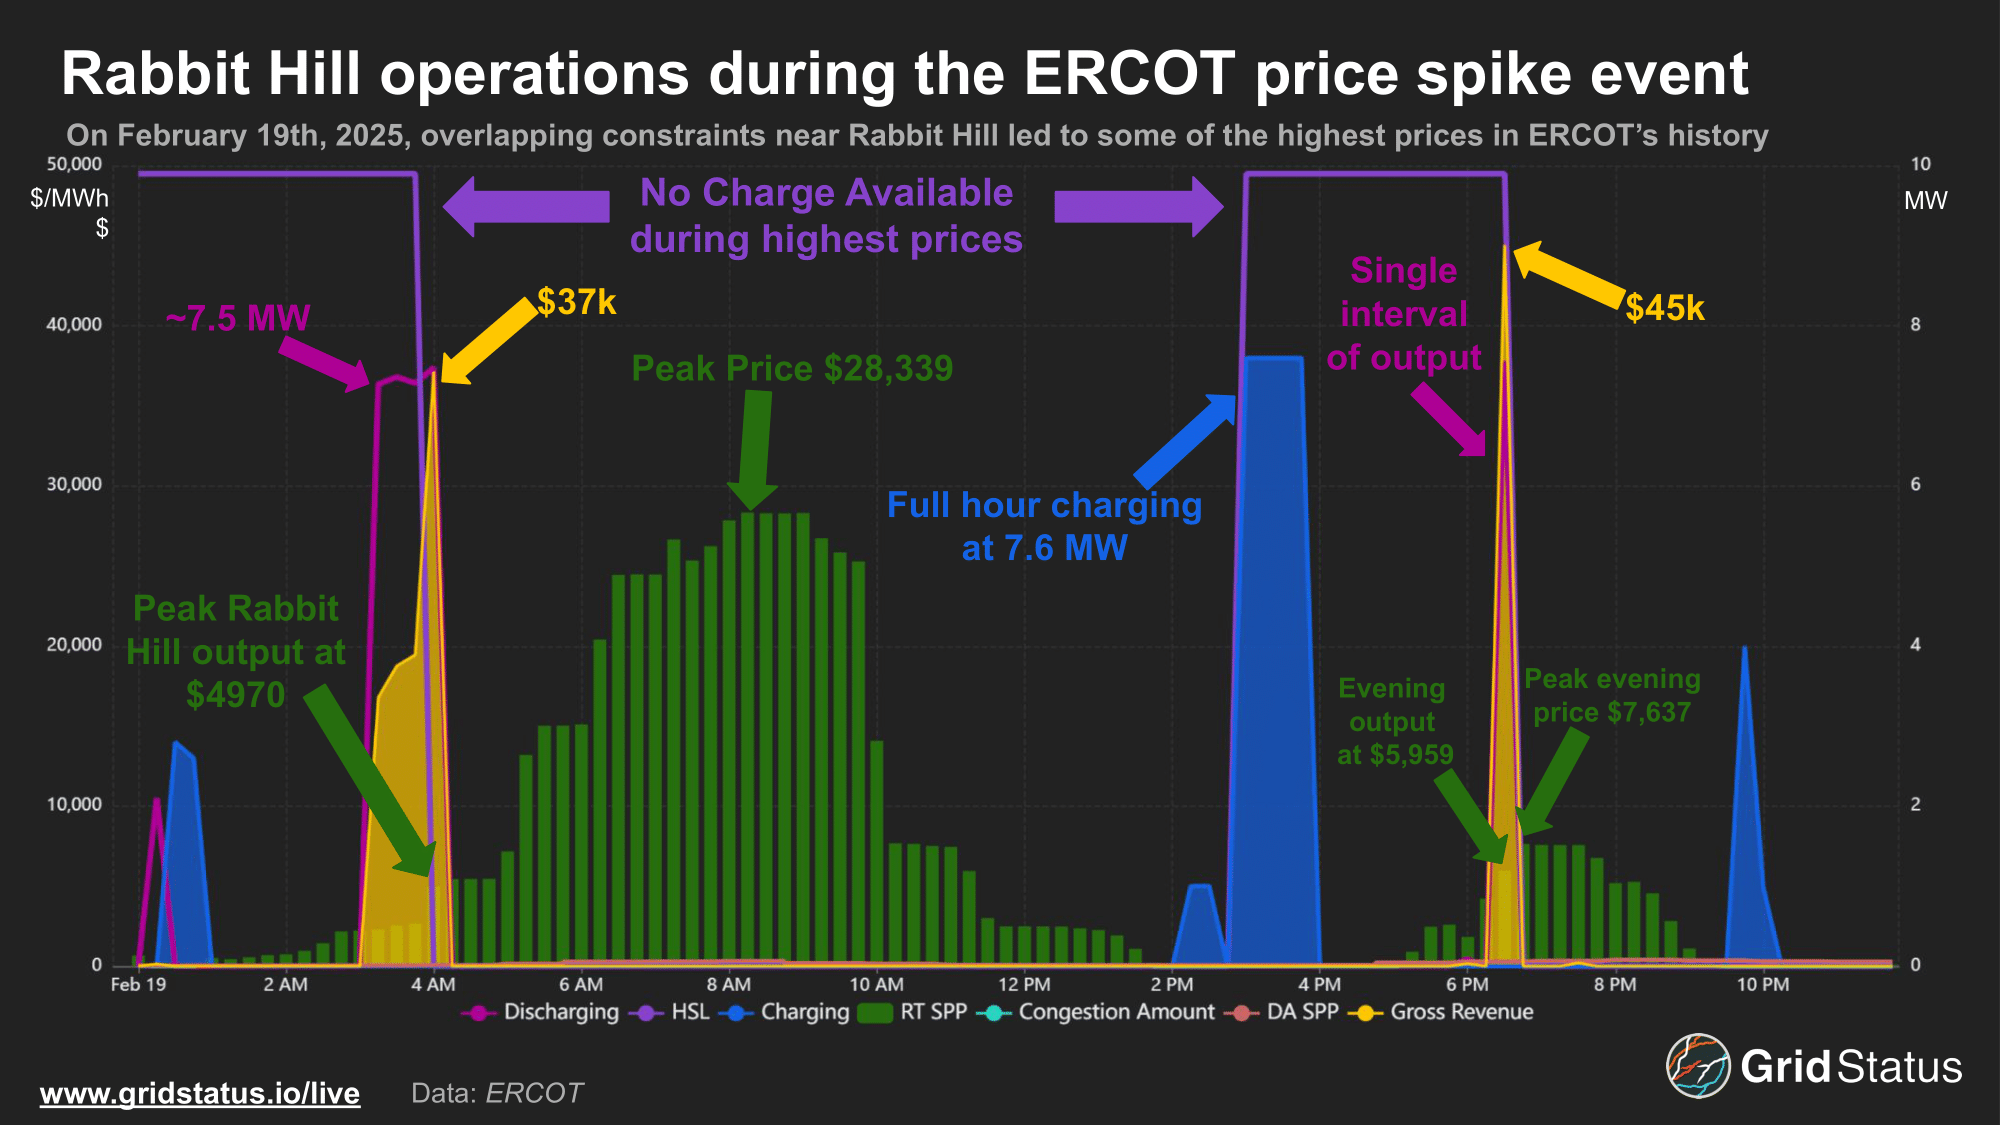
Unsurprisingly, it's hard to predict all-time-highs. Rabbit Hill discharged at the beginning of the morning price spike, before prices reached $5,000/MWh. It did a bit better in the evening, managing to hit a price of nearly $6,000, but there was still another $1,600 in runway to go. The battery's HSL, or High Sustained Limit, was set to zero through most of the highest prices, indicating it couldn't discharge during the worst of the congestion. The one thing Rabbit Hill didn't have to worry about was conflicting commitments from the day-head or ancillary services. Battery operations are a series of tradeoffs, and their symmetrical nature means some products are inherently in conflict. Each hour scheduled is its own decision tree.
It's also important to note that Rabbit Hill, owned by Ormat, is a relatively old battery by ERCOT standards, originally coming online 5 years ago, in April of 2020. This means that some amount of degradation has likely taken place, with the project's current capacity limited without any initial overbuild or additions. The project's history is also early enough to be a bit fraught, as Ormat's original technology partner went bankrupt within 8 months of signing a supply and operations agreement.
If you're interested in more examples or want to know how to track your own assets in Grid Status through an external data connection feel free to reach out or schedule a call.