Forest Fires Challenge Solar Forecast Models in New York
Last week's wildfires in Canada produced a significant amount of smoke that drifted into the United States. How did this affect the electrical grid?

Wildfires in Canada last week sent smoke billowing into the United States. Looking at photos of the situation, we suspected that the smoke impacted solar production. But, how much?
The smoke reached New York state on Tuesday, June 6, and caused air quality to deteriorate significantly through Thursday. Visibility declined to below 2 miles during the hours of peak smogginess.
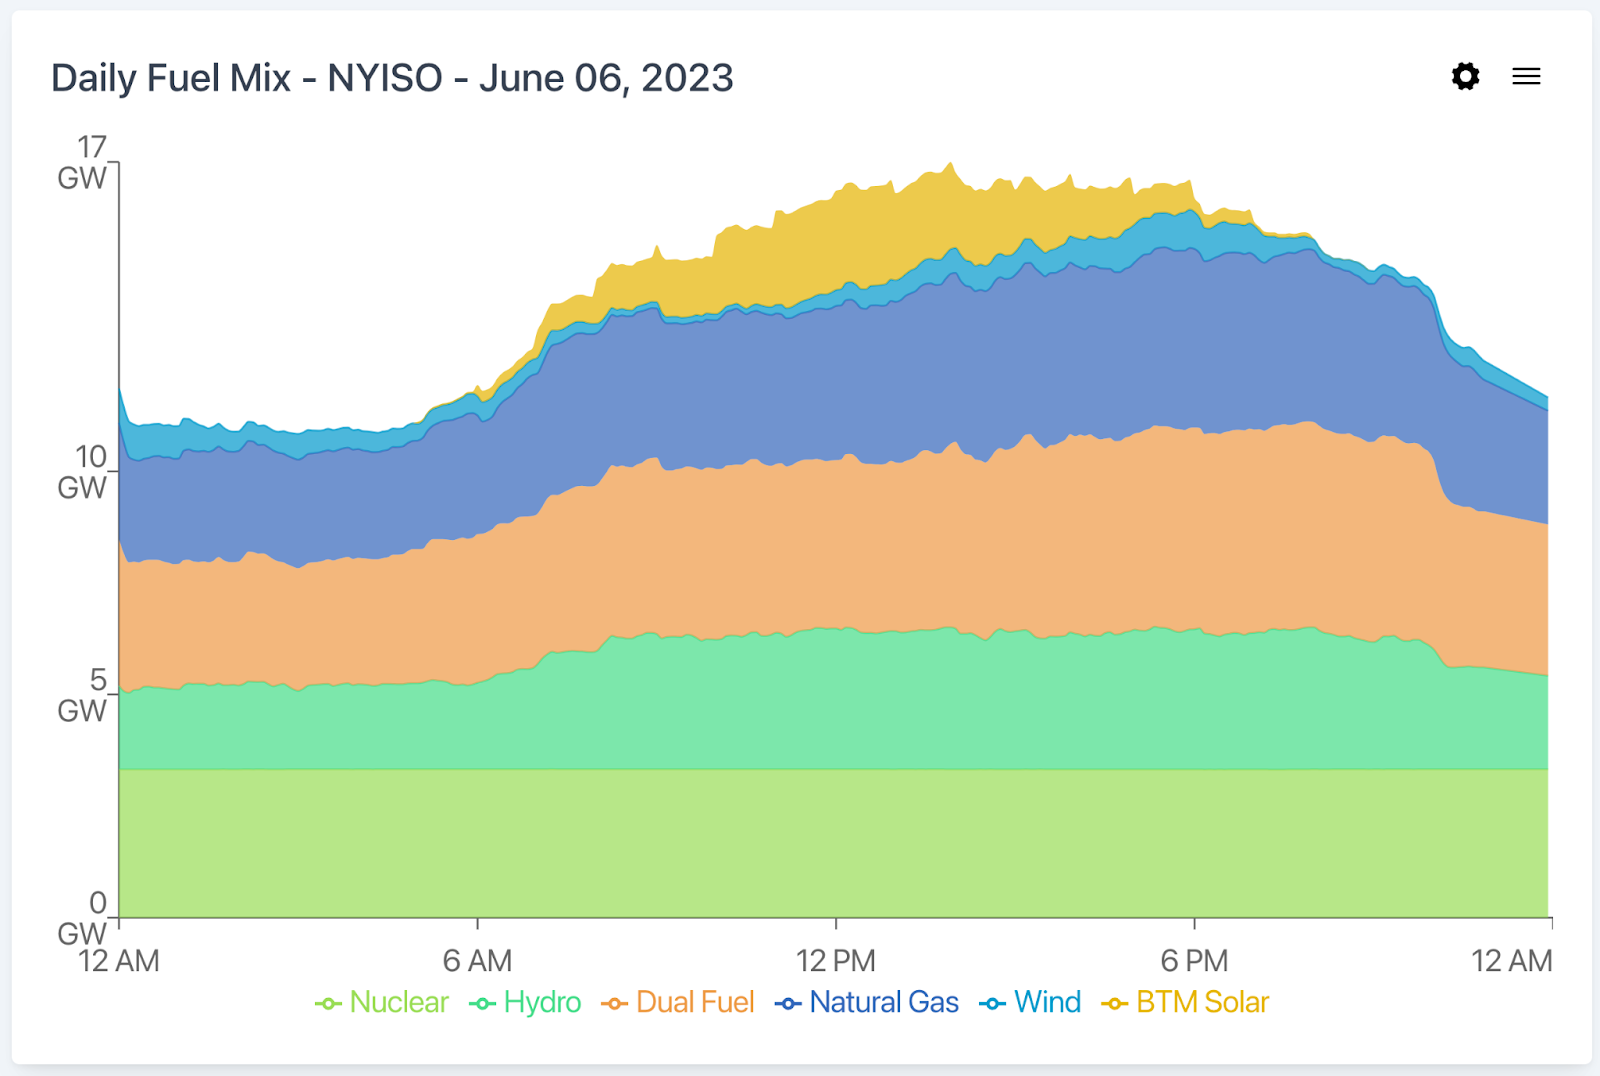
To answer our question, we first had to add two new data series to Grid Status - the New York Independent System Operator’s (NYISO) BTM Solar Forecast and NYISO's Estimated Actuals for BTM solar. Both datasets are now available across the site including the fuel mix data for the first day the smoke arrived in New York.
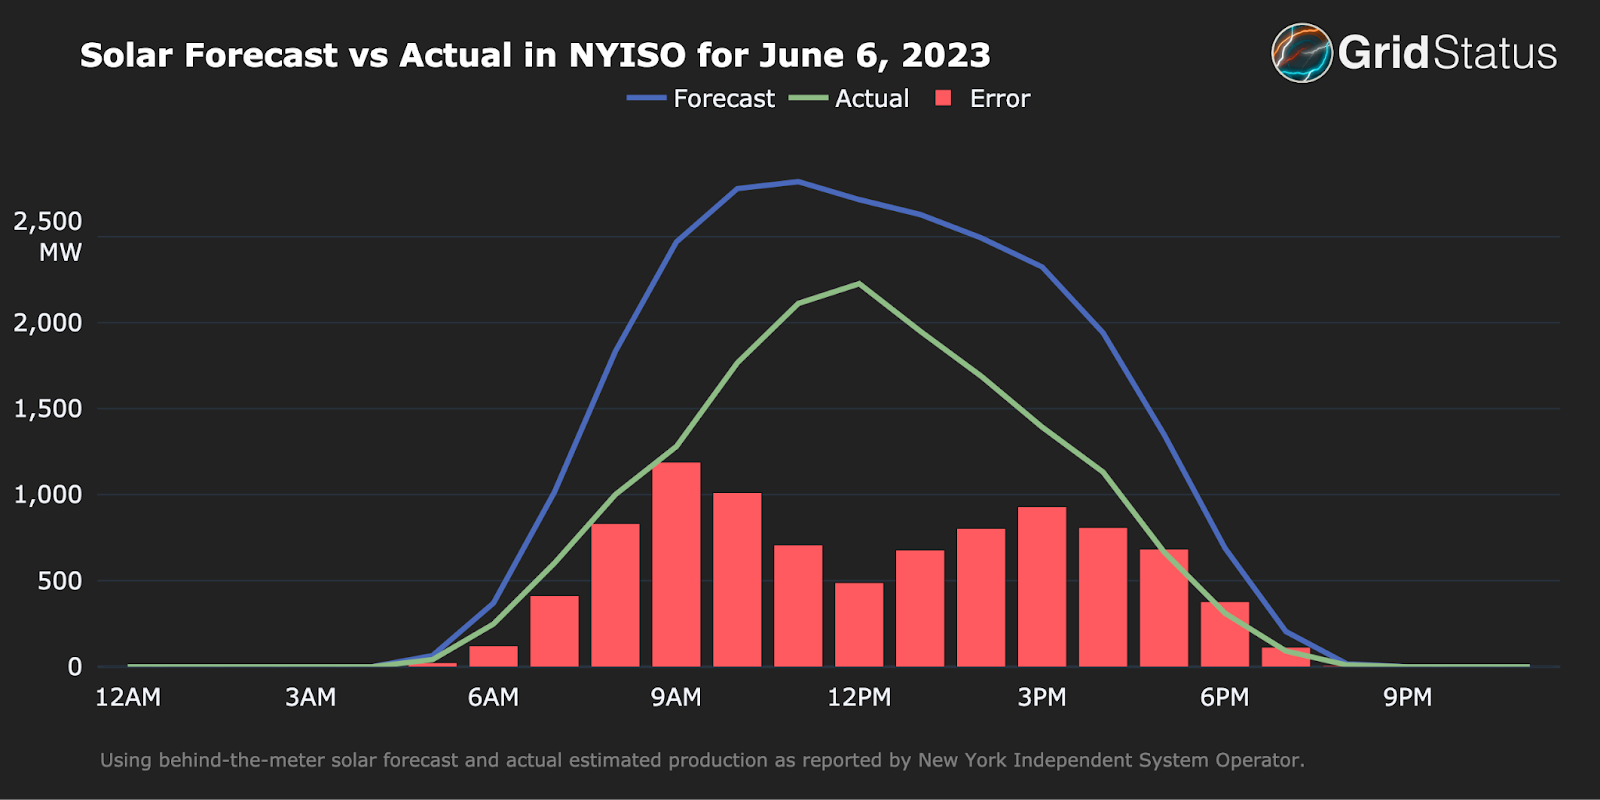
With the day-ahead forecasts of BTM solar generation as well as an after-the-fact estimate of the actual production in hand, we can calculate the forecast error. We assume the forecast incorporates all other relevant aspects of the weather, so the forecast error is an approximation of the effect the unexpected wildfires had on solar production.
We can also calculate and plot the total forecasted and actual production for each day since November 2020 and highlight the days the smoke was in New York last week.
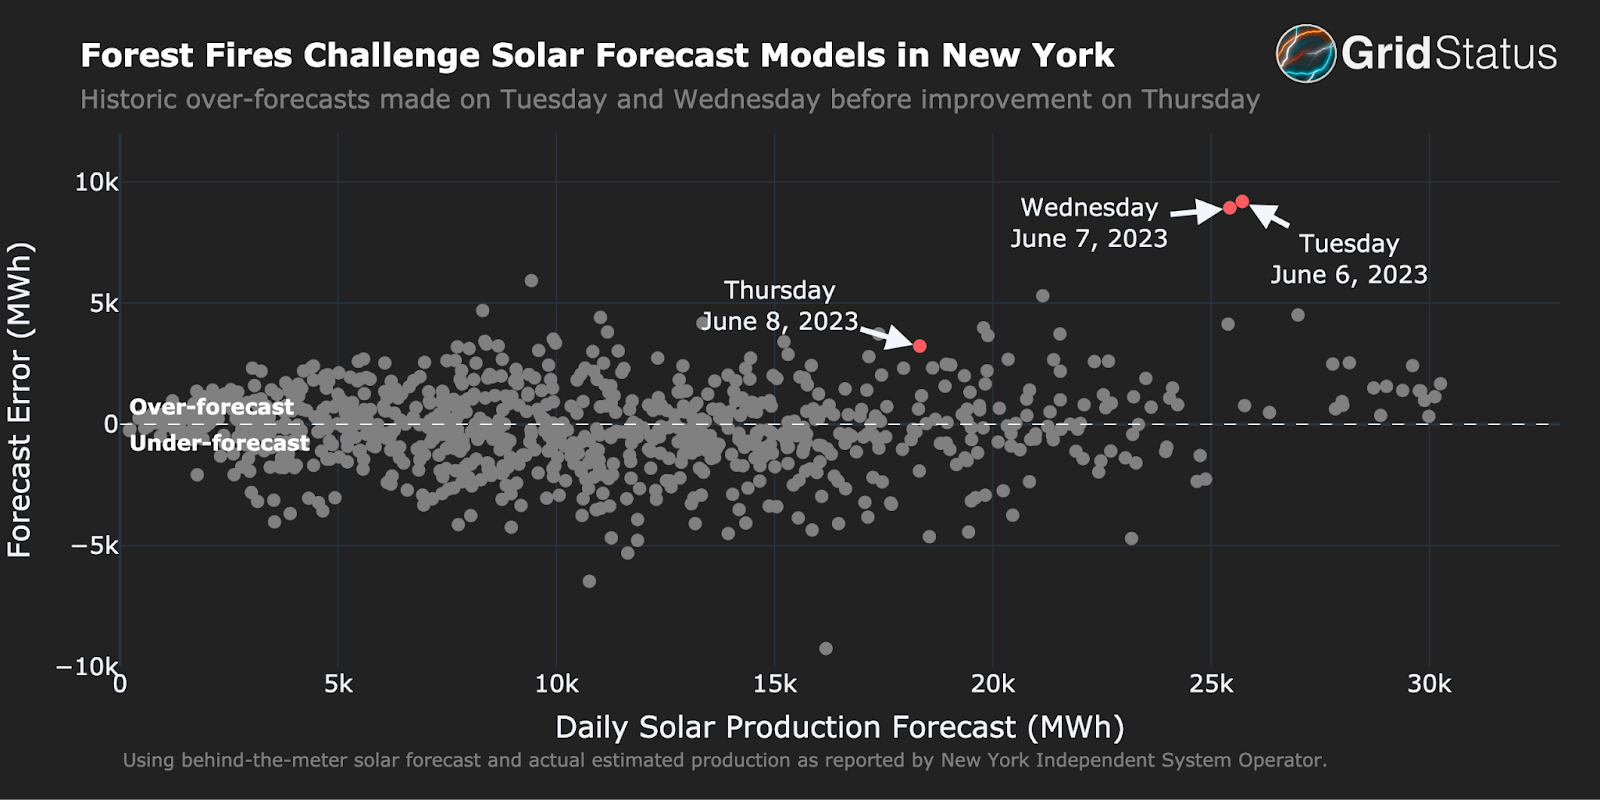
Looking at each day's forecast error, Tuesday, June 6 and Wednesday, June 7 are clear outliers. NYISO over-forecasted solar production by about 9 GWh in total each day! This is over 50% greater than the previous largest over-forecast in history (~6 GWh on Sep 6, 2022).
We can clearly see that wildfires challenged the forecast models for our electrical grid. Current grid planning tools and day-to-day forecasting models are unlikely to consider the knock-on effects of wildfires in a neighboring country, let alone more exotic risks that may be posed by a changing climate.
On Thursday, June 8, the forecast error decreased, though it was still elevated. Was the forecasting model learning? The AQI indicator for PM 2.5 in the lower Hudson Valley had declined only slightly compared to the 6th, but visibility was substantially higher. Without comprehensive information from the NYISO on their forecasting model it is difficult to decompose the effects of prevalent-but-lessening smoke and day-to-day forecast improvements via model learning.
Conclusion
As we prepare for the future of the grid, this shows the importance of grid operators making data available on all aspects of their operations. Even a best guess, such as the estimated actuals of BTM Solar production that NYISO publishes in this case, can support important inferences about the impact of weather and climate events on grid operations and outcomes.
This post is supported by funding from GridLab.