What Happens When a Nuclear Plant Suddenly Shuts Off?
Nearly instantaneously, a significant portion of nuclear generation in New England disappeared. This abrupt outage created measurable effects across the grid that we explore in this post.

Early in the morning of May 30th, 2023 a substantial portion of nuclear generation in New England abruptly disappeared.
This outage represents an instantaneous loss of nearly 14% of demand at the time - a massive contingency.
Despite no immediate impact on grid reliability, this sudden outage created measurable effects across the grid. Tracing these ripple effects is critical for understanding the operational intricacies of the electric grid.
In this post, we will walk through our step-by-step thought process of using data from Grid Status and other public sources to investigate which specific plant went offline and other noteworthy impacts the outage had on the grid.
Not a Planned Outage
At first glance, we assumed this was a late-shoulder-season planned outage.
If you go to the website of the Nuclear Regulatory Commission (NRC), the status of all active nuclear units is listed by Region. New England is in Region 1. On 5/30/2023 the page looked like this:
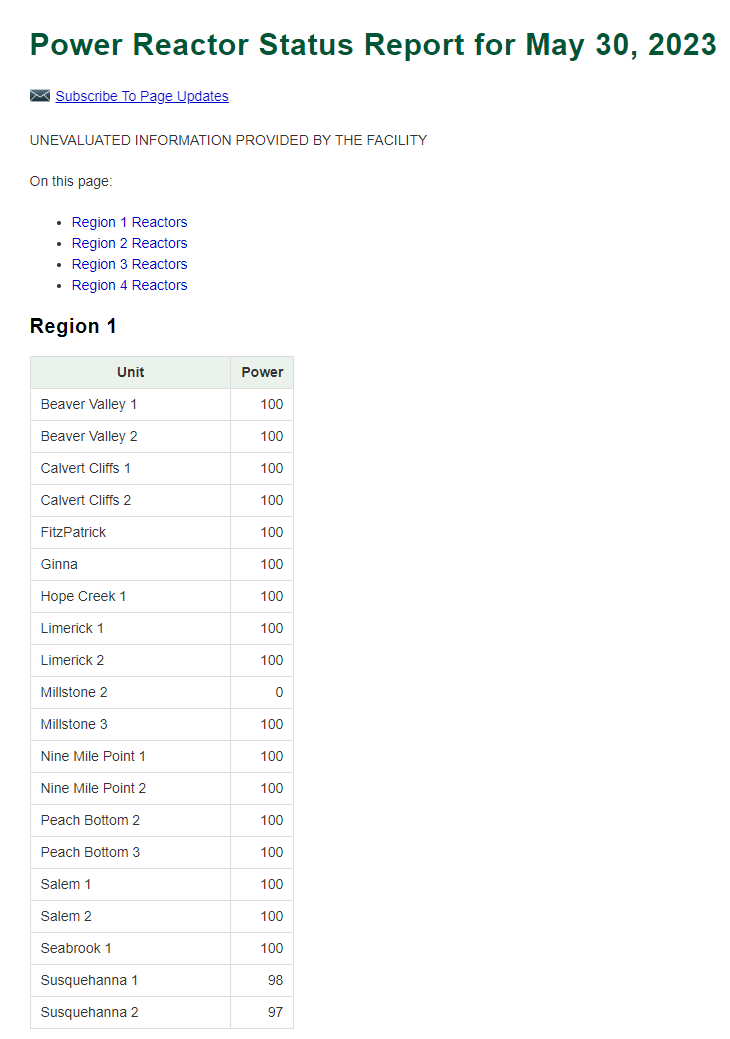
One unit was at 0 power, and a quick online search shows that Millstone Power Station Unit 2 is in Connecticut and is offline for refueling, question answered, right?
Unfortunately, no. Millstone Unit 2 went on outage almost two months ago and has yet to return, so it couldn’t account for the sudden drop in production.
At this point, it should be a relatively simple matter to query an ISO’s generator outage data and determine the culprit, if all ISOs made such a thing readily available. Instead, we will use public information - some currently in Grid Status, some currently under evaluation for future analysis modules - to try to determine the unit with an unplanned outage.
Examining the Impact on Wholesale Prices
A comparison of the day-ahead (DA) and real-time (RT) system-wide price can highlight the occurrence of large "shocks" to the system. When real-time prices deviate from the day-ahead prices, it typically signifies a challenging period for operators and the market solver, requiring that rapid transmission of a powerful pricing signal.
Below is the day-ahead and real-time 5 minute Hub data. Notice anything?
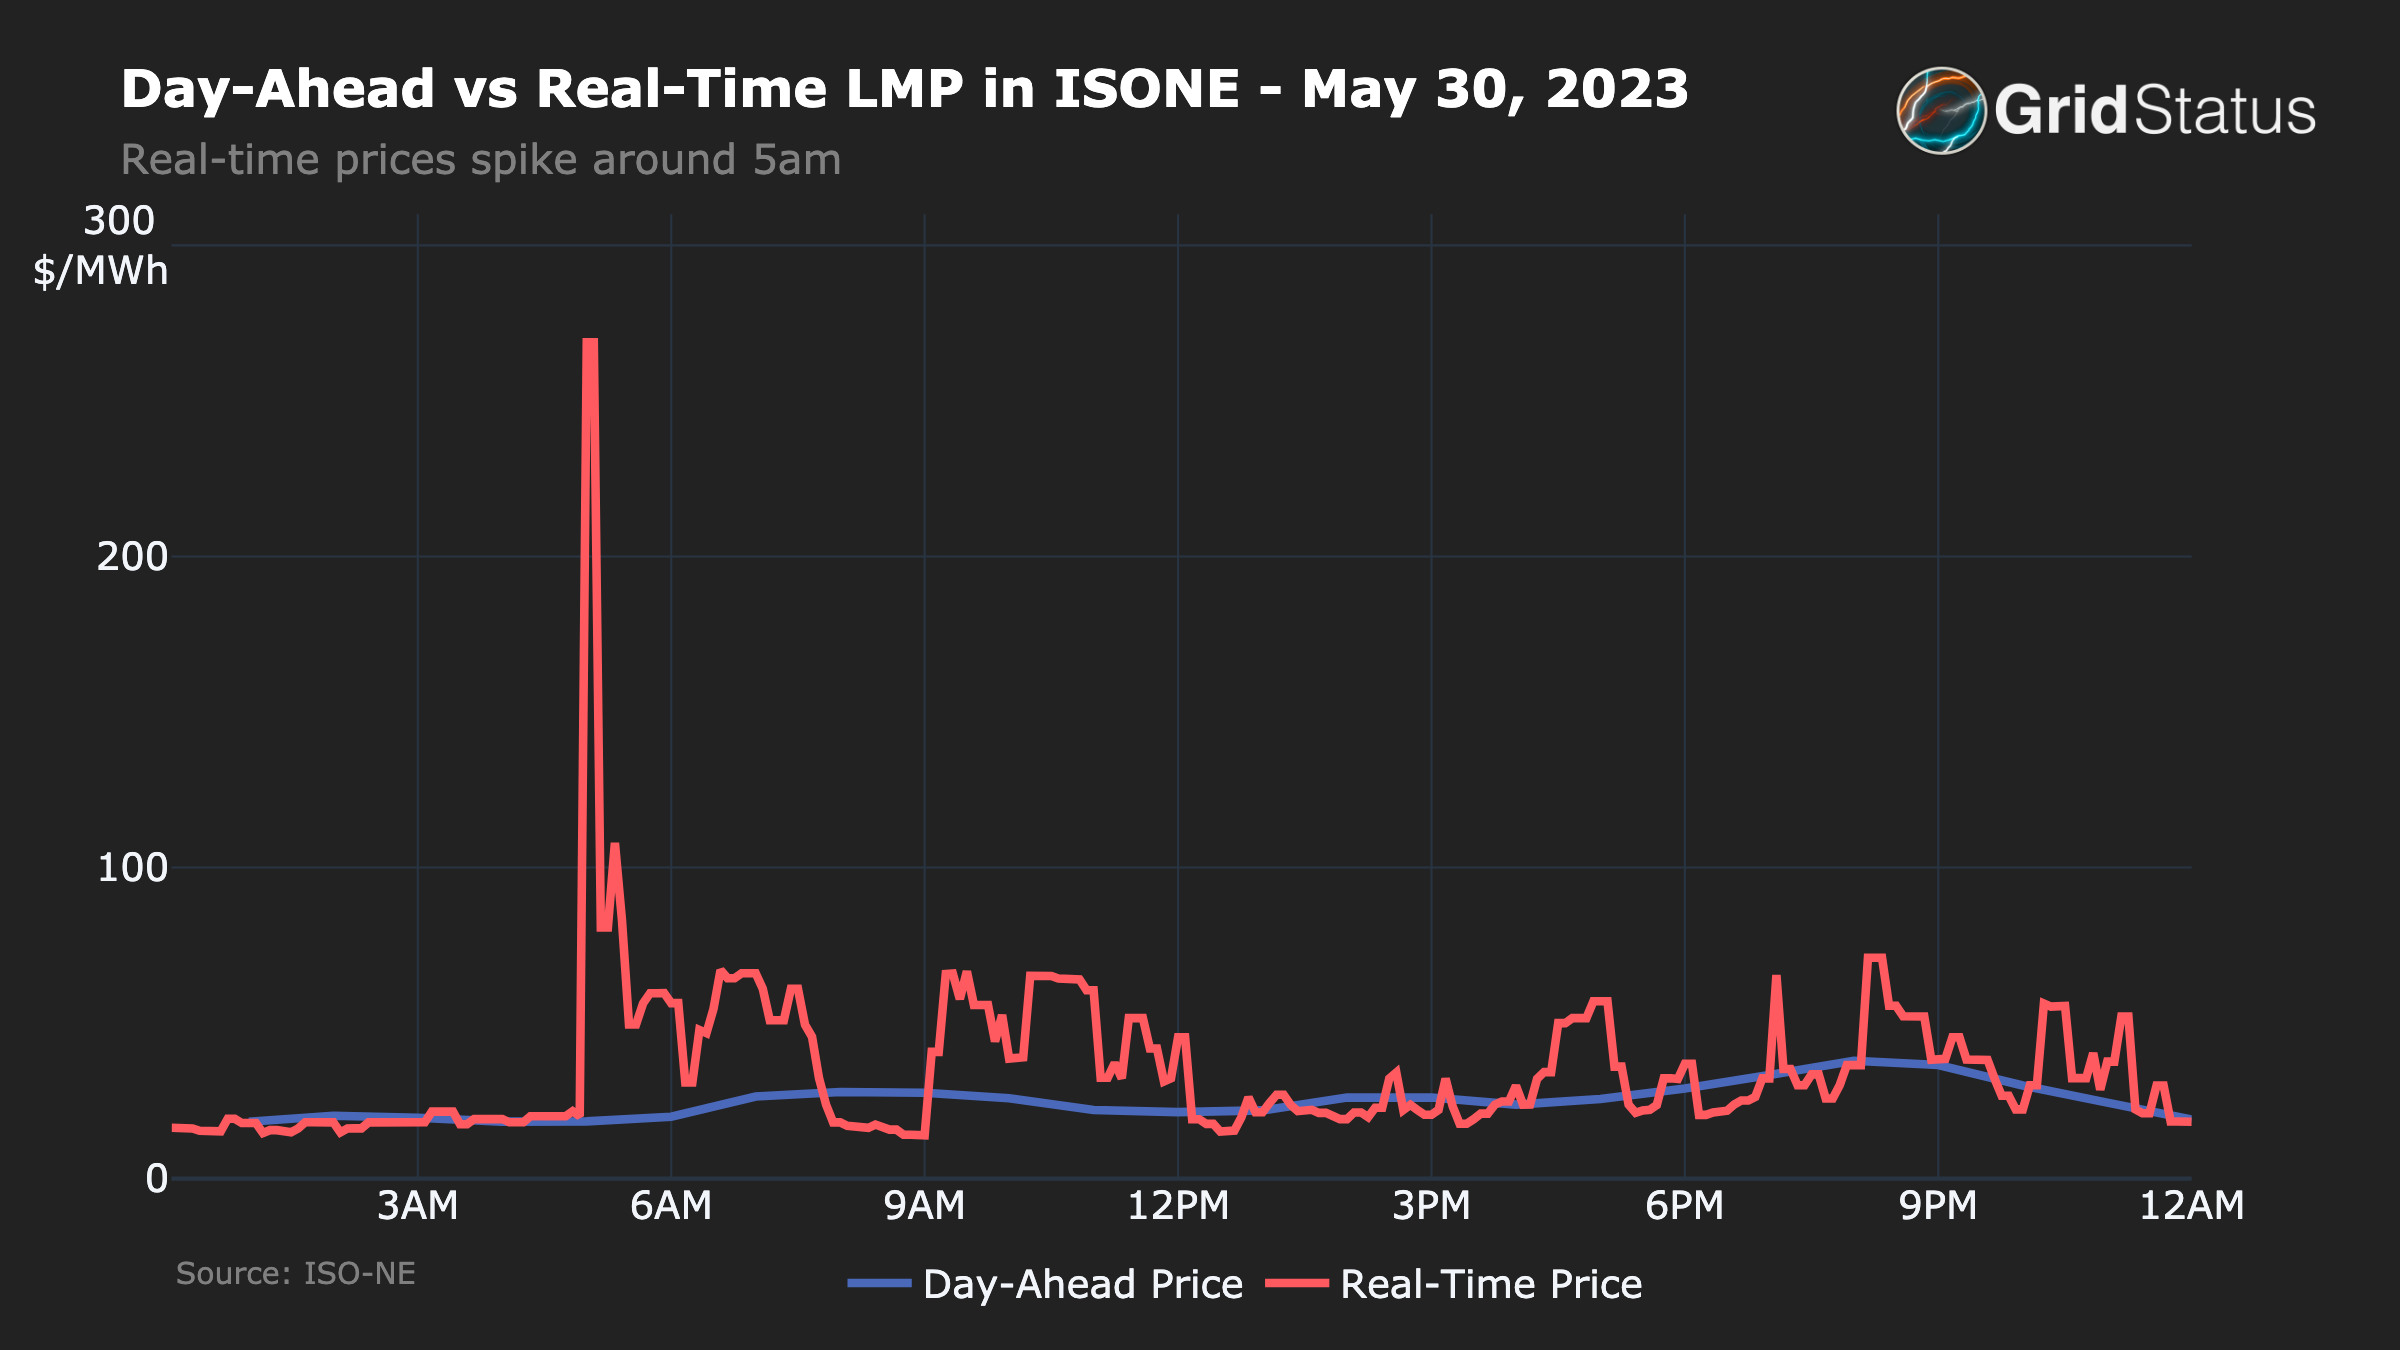
A large discrepancy between DA and RT shows up slightly before 5AM. Now, let’s layer in nuclear generation
A perfectly timed price spike in RT which coincides with the drop in nuclear generation is exactly the type of signal we are seeking to suggest a deviation from the usual grid operations.
Oil on the Margin
Before we continue hunting for the plant that went offline using real time data, what else about the grid operations can we learn from this pricing data?
This high price indicates that oil likely became the marginal fuel on the grid. This is clear due to (a) relative efficiencies of fast response natural gas and oil units in New England where battery penetration remains low and (b) the fuel prices.
Per the EIA, natural gas spot prices in New York were only $1.50/MMBtu on the 30th. While New England is further down the pipelines, even an additional dollar to the price would leave a 10 heat rate gas turbine at only $2.50 * 10 = $25/MWh before adding in additional costs. It’s really hard to get up to a $266/MWh cost of energy if natural gas generation is on the margin. It is much more likely that a less efficient oil unit running on more expensive fuel with pricier maintenance adders is the marginal fuel and setting the price of electricity.
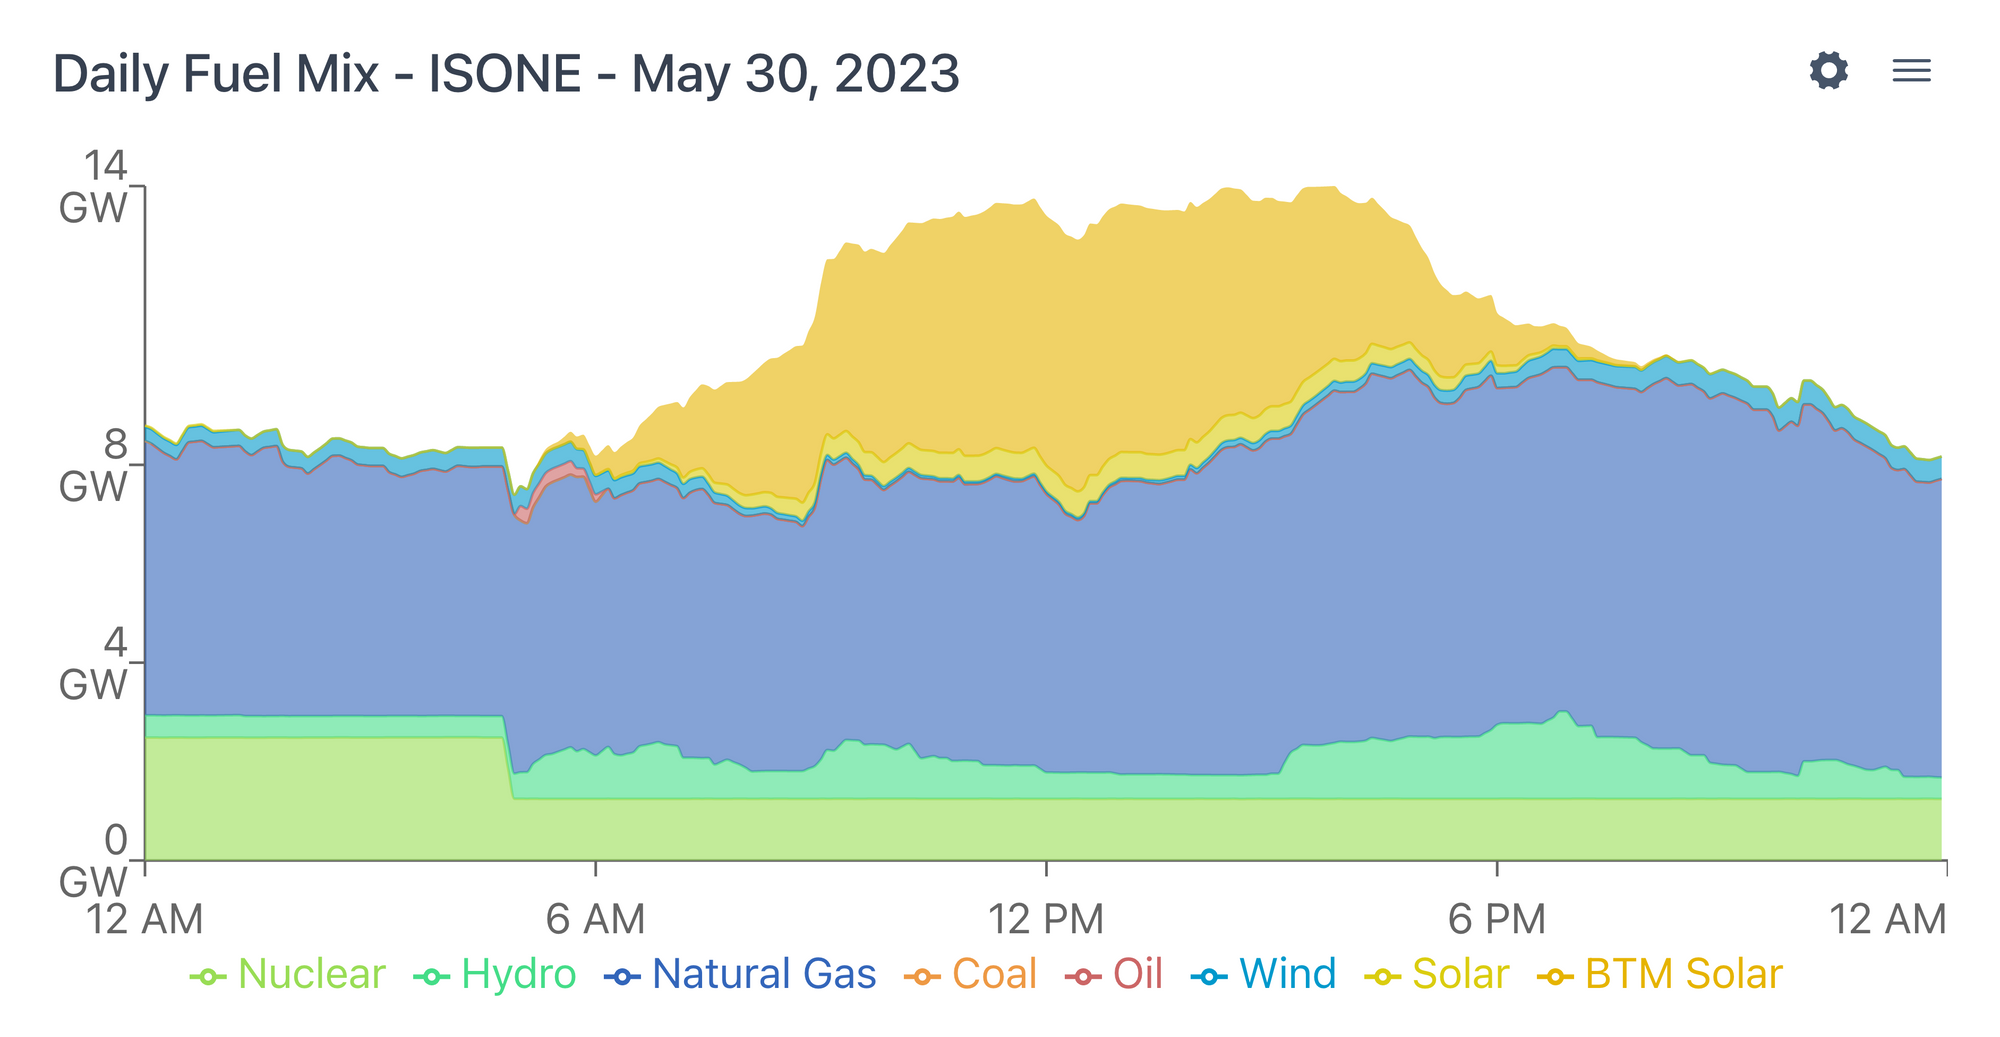
The math is further confirmed by the fuel mix data where we see about 290 MW of oil appearing on the grid at the same time the nuclear production drop occurs.
Emissions from Oil
Oil coming online to fill the generation gap from the nuclear outage is noteworthy because it increases the carbon emissions on the grid more than any other source. In this case, the prices likely weren’t high enough to turn off enough demand, which is not normally that elastic.
However, there might be a willingness to decrease usage for the sake of reducing emissions, particularly among those who charge their electric vehicles overnight. Let’s do the math:
- About 290 MW of oil was running for about an hour
- A level 2 home EV charger typically charges at 12 KW.
- Accounting for ~5% in losses, ~25,000 EVs which were otherwise charging could have to stop in order to replace the oil generation on the grid.
- That number is nearly 60% of total EVs registered in New England States as of the end of 2021 according to the Department of Energy.
Although it is unlikely the entire volume of vehicles would have been charging at the appropriate time during this event, this demonstrates the latent beneficial potential of flexible electrification to reduce emisions in the future.
Which Nuclear Plant went offline?
On the day following the outage, the NRC published an incident report indicating the trip was at Millstone Unit 3. However, could we have determined which plant went offline earlier?
First, we should determine the capacity of the remaining units. Every ISO has a regular report which contains system information, generators, and predictions for the upcoming seasons, a load and capacity report. In NYISO, this is the Gold Book, in ERCOT it’s the SARA and CDR, ISO-NE has the CELT.
The CELT file shows 3 units, Millstone 2 and 3 in Connecticut, and Seabrook in New Hampshire. Nuclear stations tend to run close to full out at all times, so losing a unit typically means a loss of generation equivalent to their capacity. Complicating our investigations, the capacities of Millstone 3 and Seabrook are similar and, greater than 1.2GW, the size of the load drop, so unit size is not enough to determine the culprit.
Looking at the Nodal LMPs
The next step to identify the correct unit is to return to price data in Grid Status, but get more granular.
We should be able to discern something from LMPs at each unit’s node around the time of the generation drop and system-wide price spike. But how can we determine which of the 1000+ nodes in ISO-NE corresponds to a specific unit?
Grid Status has the PNode table published by ISO-NE that contains the Node IDs of specific generators. Filtering this to the Millstone Units and Seabrook we can retrieve their Node IDs. From there, we return to the API and plot the real-time 5-minute data for these 2 (since Unit 2 is on outage already) nodes along with .H.INTERNAL_HUB.
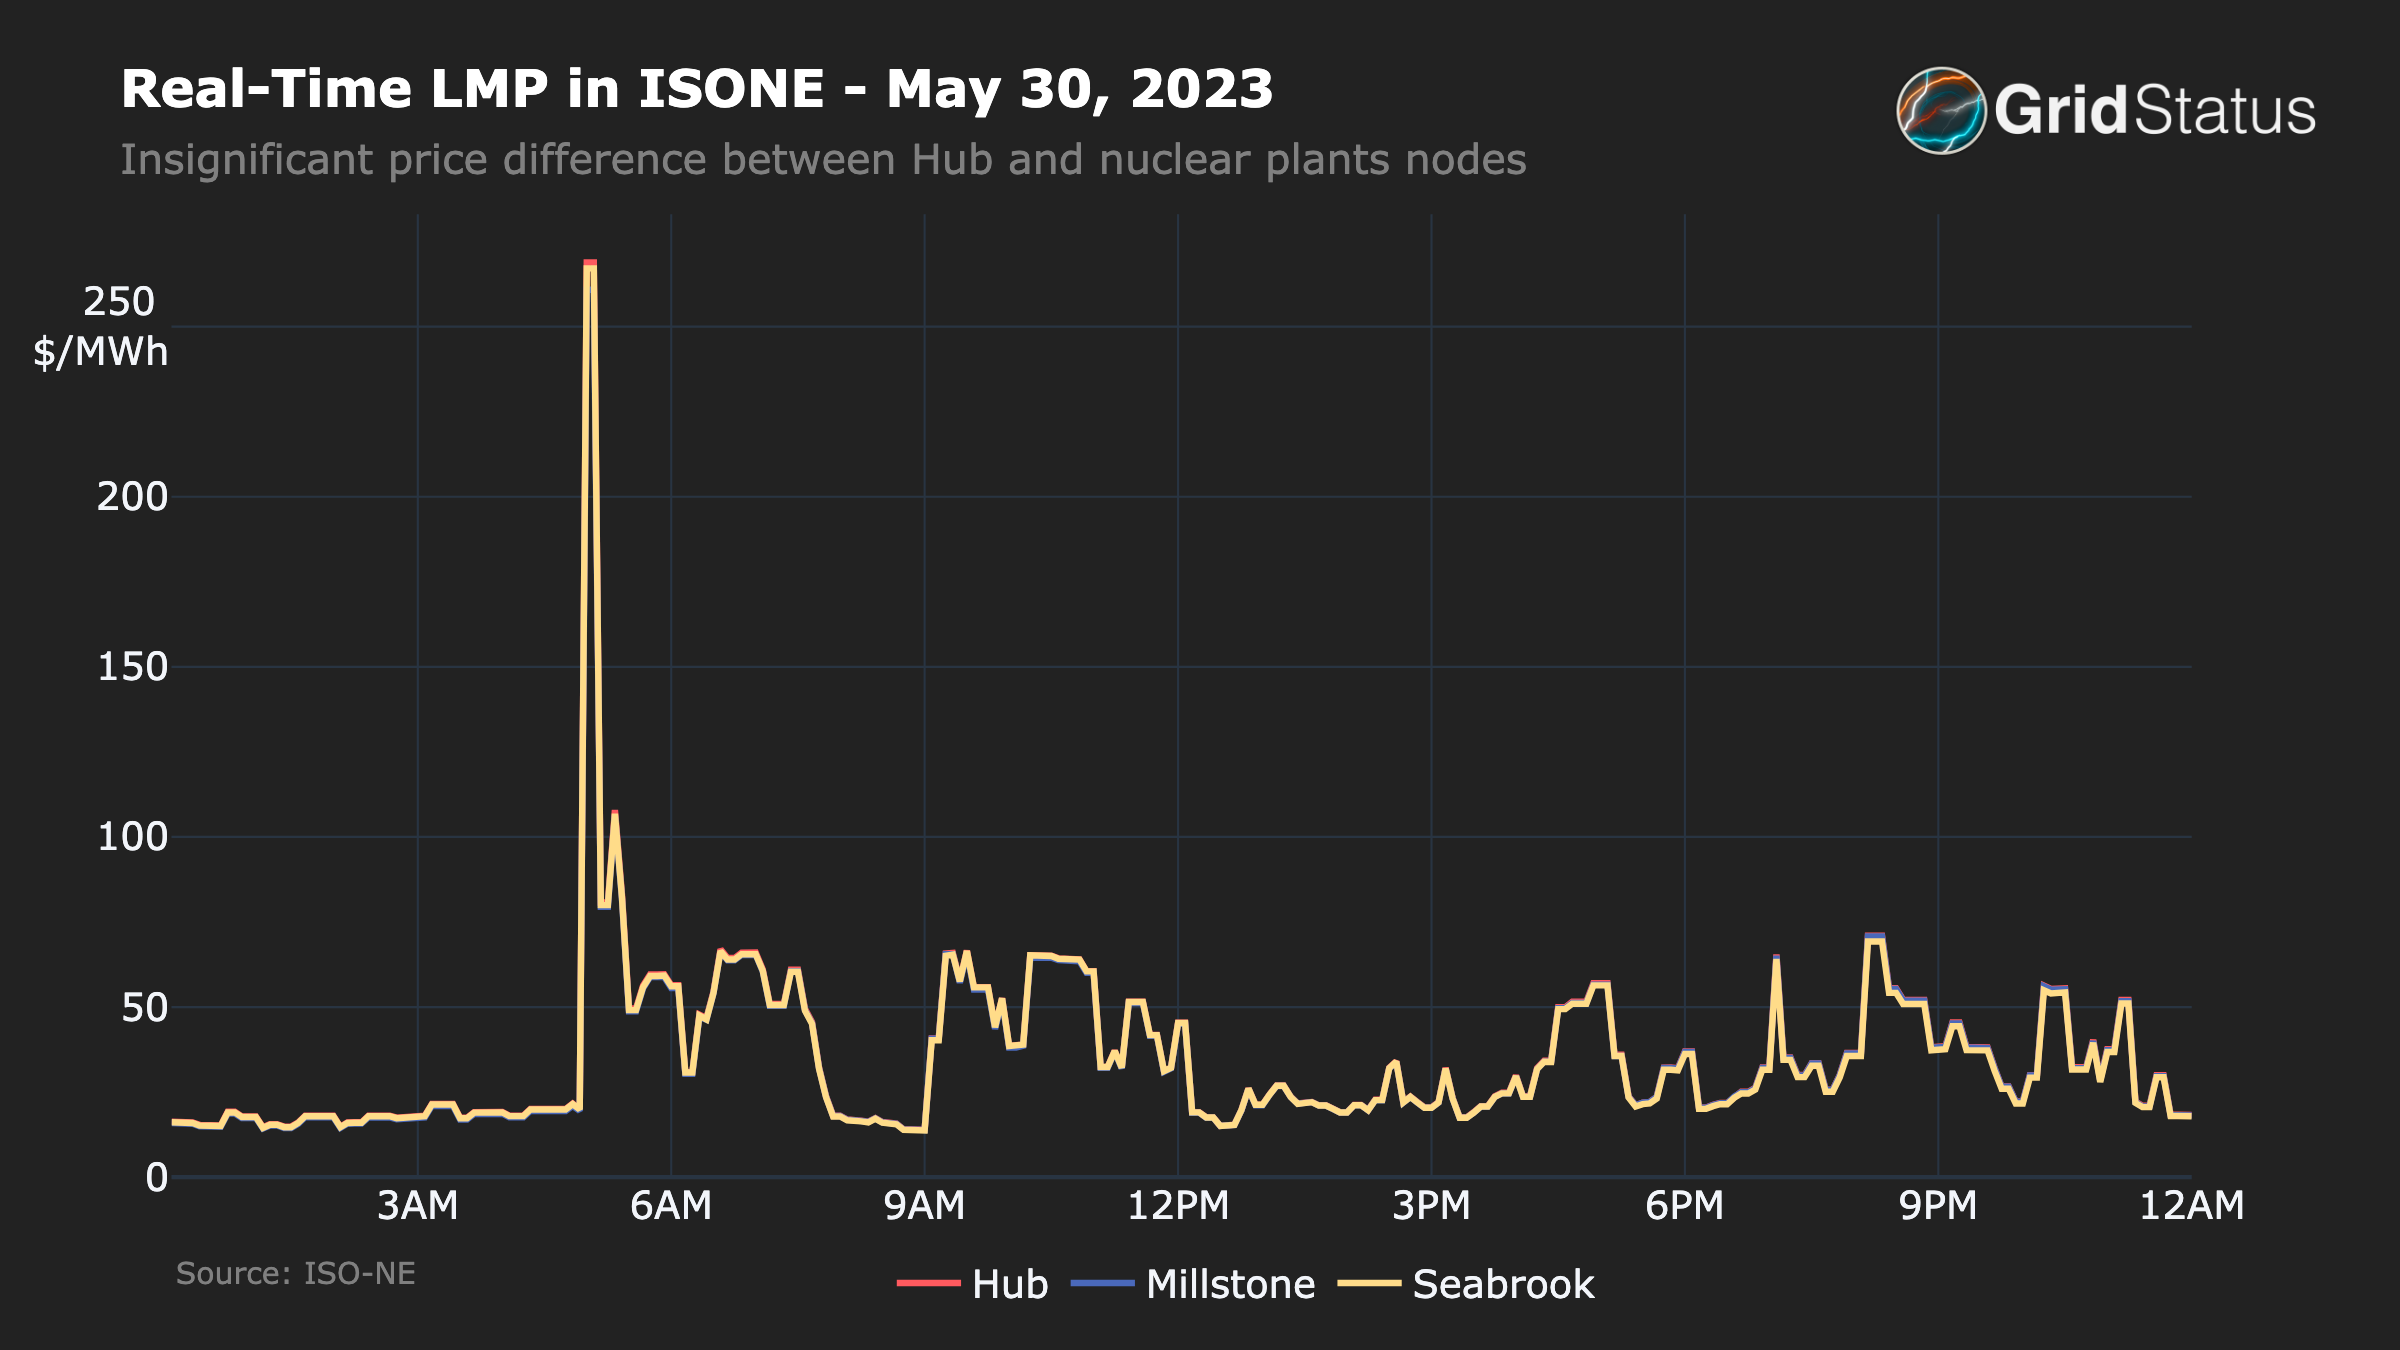
Unfortunately, this tells us very little - the prices between the 3 locations are nearly identical!
ISO-NE is not like ERCOT, CAISO, or NYISO where sudden internal problems often lead to very clear internal price separation. The relatively (a) low system load, (b) somewhat “gold-plated” transmission, and (c) previous upgrades in the main load pocket (Boston) allow events in one location on the system to more readily align LMPs throughout the entire ISO.
We can also split the LMP into its components: energy, loss, and congestion. While the energy component is identical and its magnitude swamps the other parts, when limiting the y-axis we can observe a material difference.
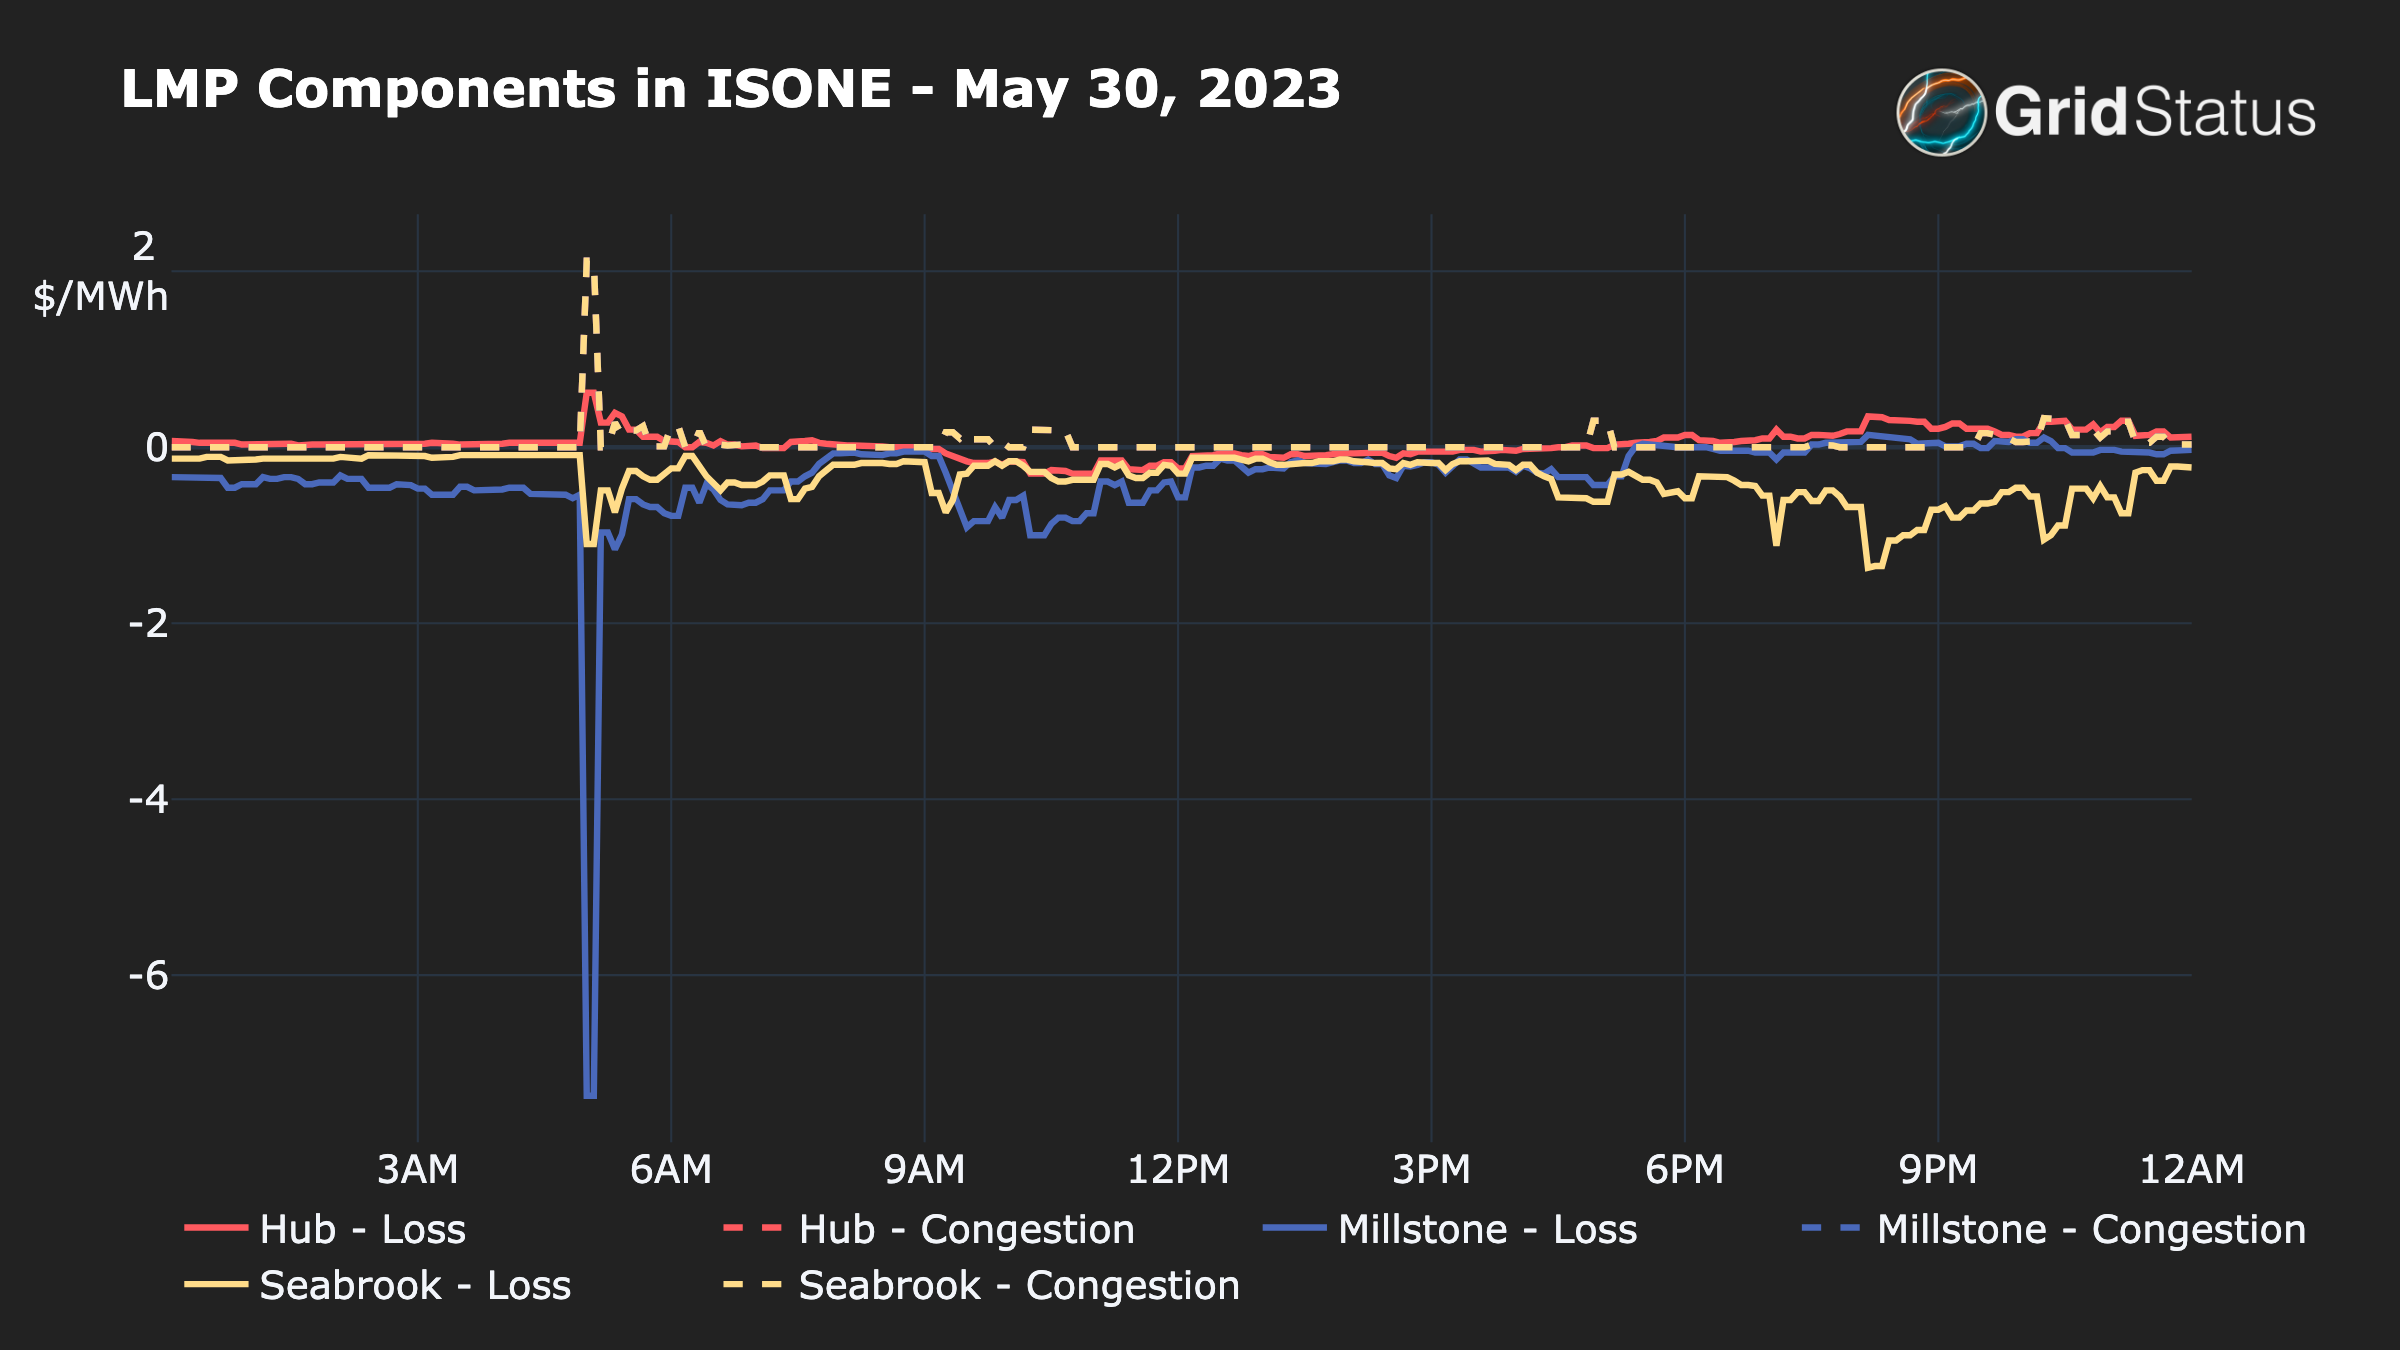
Small differences, but still something. The loss at Millstone is more than $6/MWh less than at Seabrook. This negative value reduces the total value of the nodal LMP. This is somewhat counterintuitive if you think an outage at Millstone should mean high local prices to get more local generation online, but local generation isn’t always available and physical constraints on the transmission system must be considered.
What else do Loss and Congestion Tell Us?
With this information in hand, let’s continue with price data, but over more nodes. We can isolate the price spike to right before 5:00 AM - let’s take a look at 4:55 across all nodes. We’ll categorize nodes by dispatch zone and then take the average value of each component and stack them.
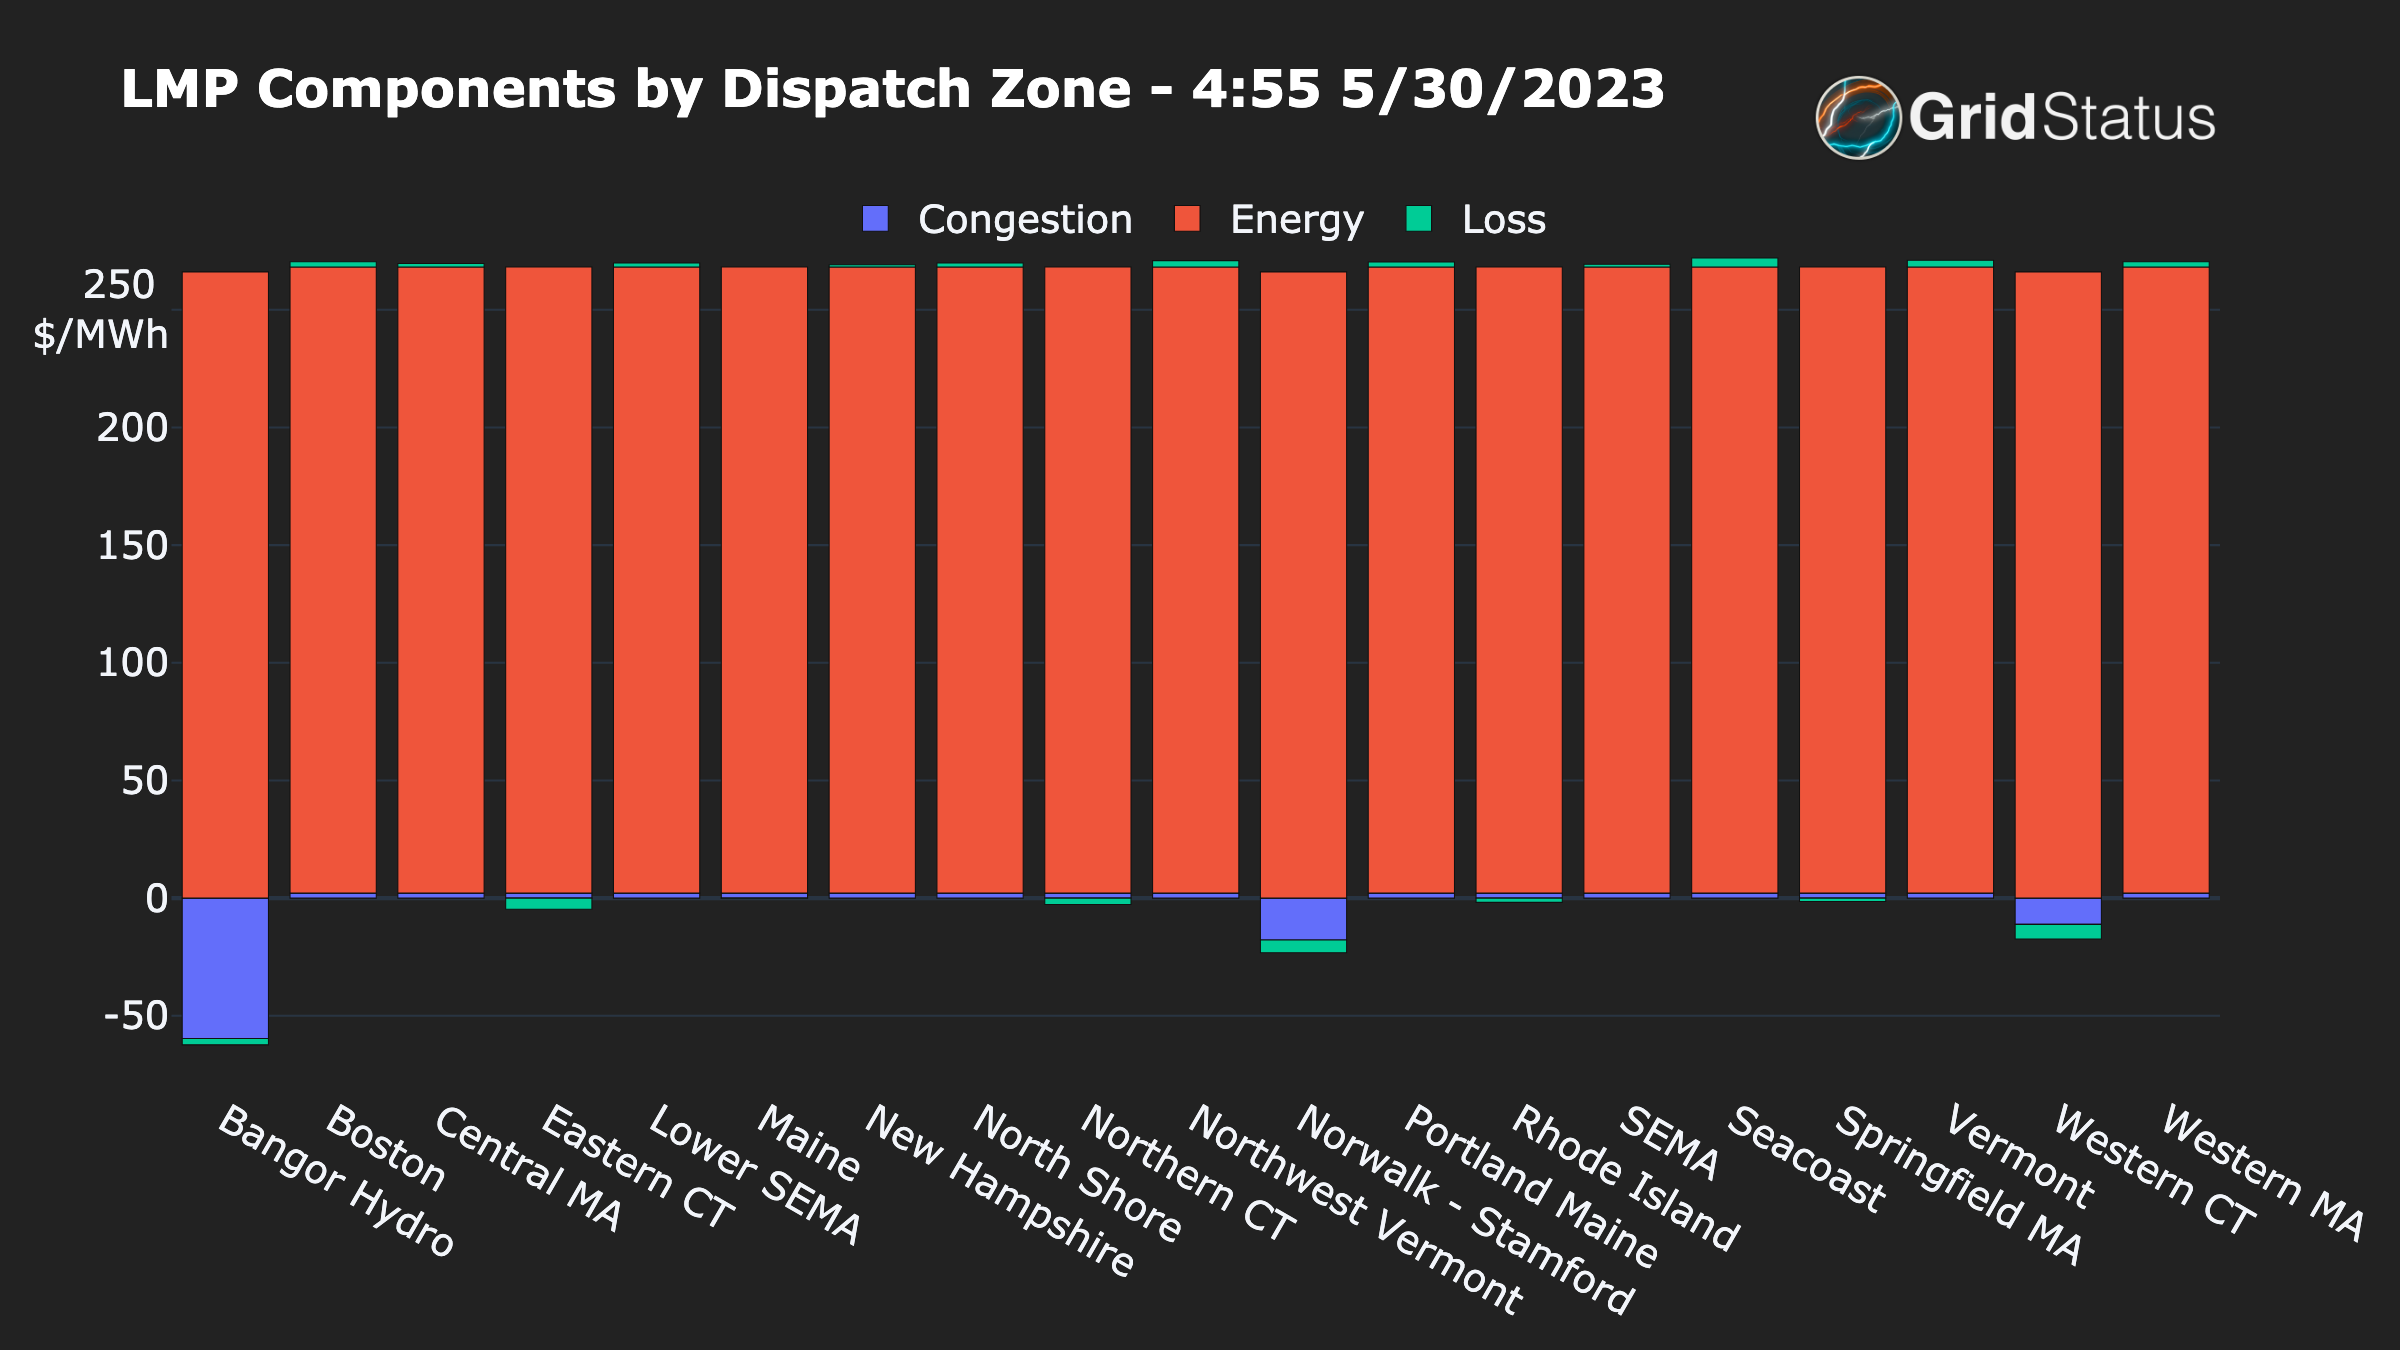
Now we’re getting somewhere! While most of the system sees a modest $2 congestion cost, the opposite ends of the system - Western Connecticut and Maine - are experiencing negative pricing, the solver is telling the system to relieve certain transmission lines by making it less profitable to put more generation onto them. The previous graphs which failed to capture this were either focused on the system-wide price, or only the LMPs at Millstone 3 and Seabrook, none of which experienced a significant price excursion.
The lack of a price response at those locations speaks to the sometimes counterintuitive nature of grid operations - electrical topology does not equal geography.
Back to the LMP components, the loss component also flips around between positive and negative, what happens if we sort by that?
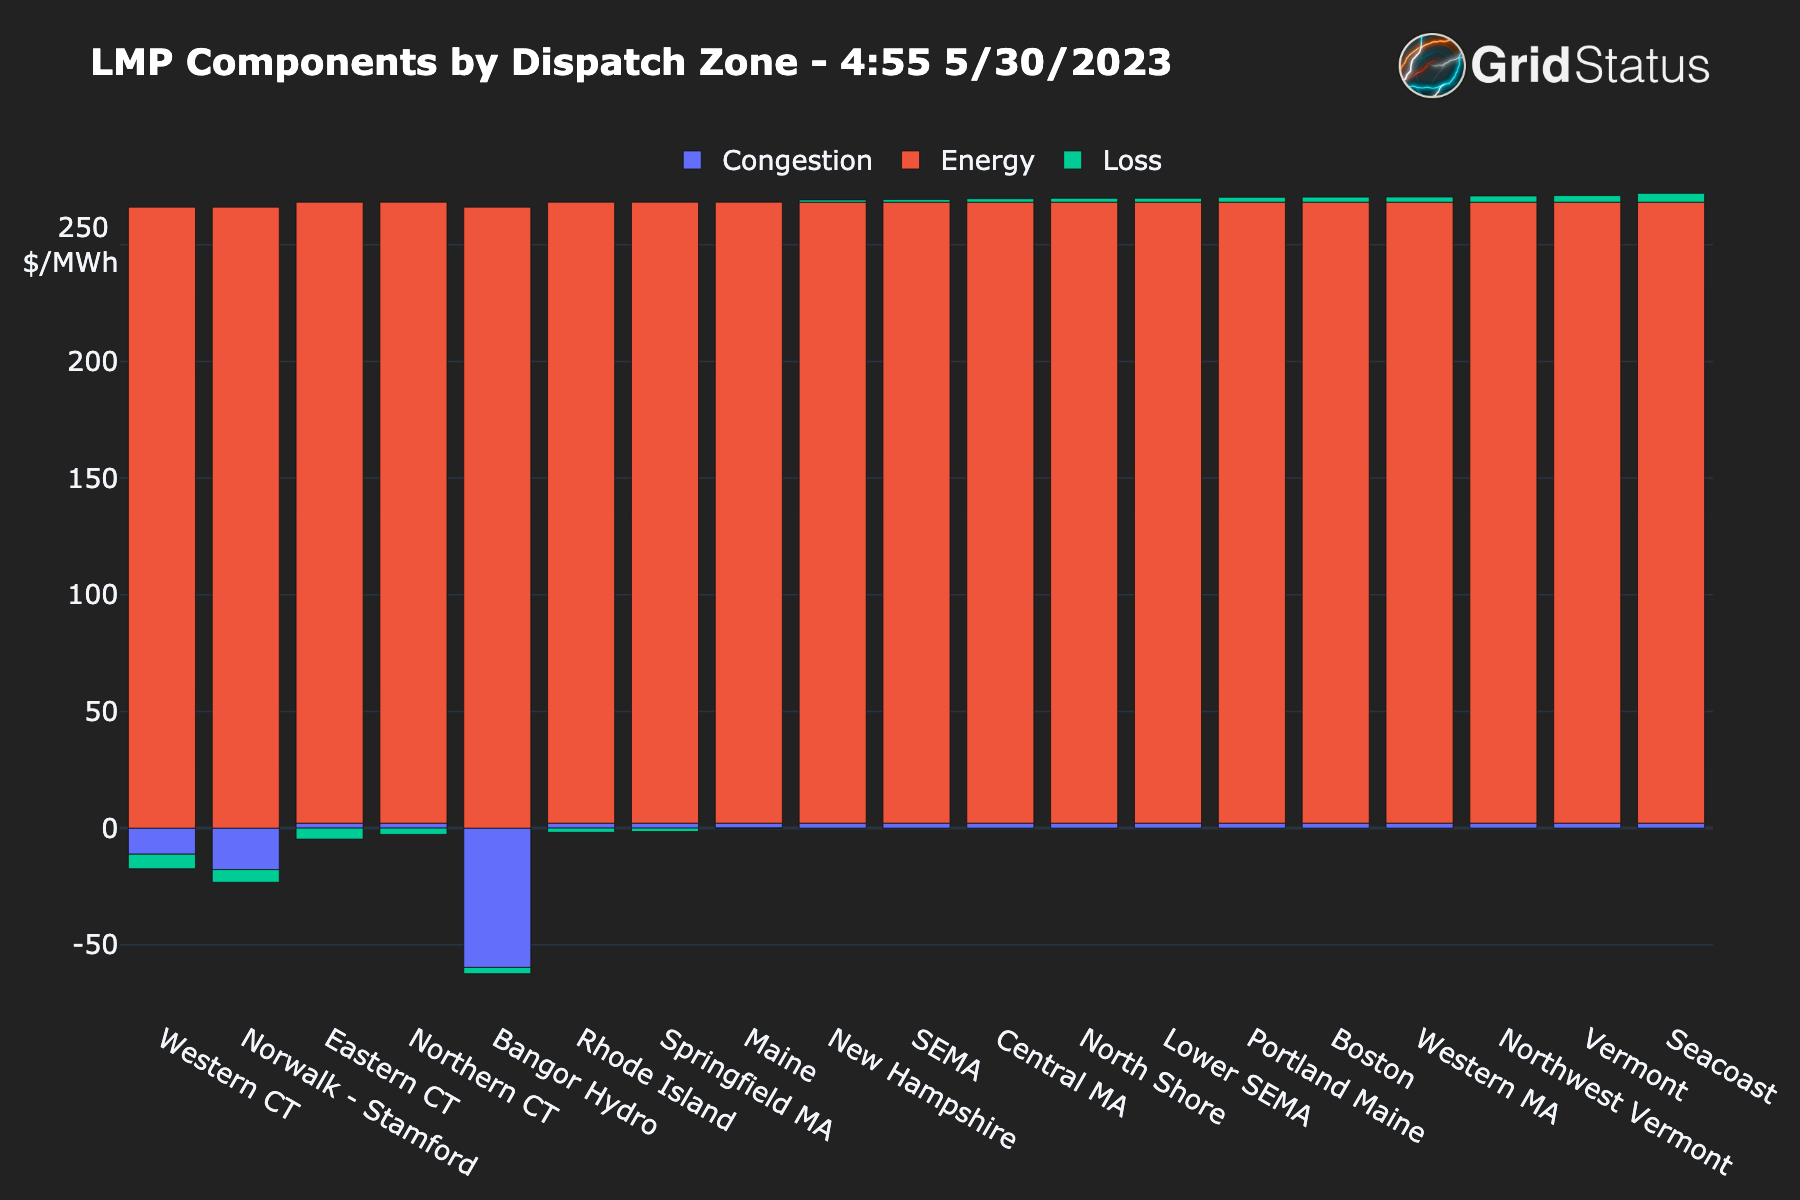
Other than the continued outlier of Bangor (again, opposite end of the system) the current loss components clearly have a geographic tilt in the distribution - concentrated in Connecticut.
From here we do a bit of inference - if Seabook had gone offline, it is less likely that we would be seeing such a hot spot of congestion in Western CT and this geographic orientation to the loss component.
While it is possible that the congestion in Western CT is purely driven by the response of generation to the trip given Connecticut's relative preponderance of peaking units compared to the rest of New England (44% of the gas turbine and internal combustion units by capacity via the CELT report), the congestion and loss factors together do suggest the correct plant, Millstone 3.
Congestion in Western, but not Northern Connecticut speaks to the locations of peaking units and the relative flows on lines in those areas at the time of the event, Western Connecticut and Norwalk have two thirds of the peaking units in the state compared to the northern and eastern regions’ one third. At this point we were satisfied by our exploration of this event via data currently in Grid Status.
Conclusion
In an era increasingly subject to correlated failure modes, it is essential to understand what to look for in situations like this to fully grasp the intricacies of the grid's operation.
This post is just an example of what Grid Status hopes to provide: comprehensive access to electricity data for advanced analyses of our dynamic and rapidly evolving electrical grid.
This post is supported by funding from GridLab.