The Sun Also Rises in the Eastern Interconnection
MISO and PJM have finally seen substantial solar growth over the past year, but this new generation resource is also affecting the existing stack, altering the operations of coal and gas.


The two largest grid operators in North America, MISO and PJM, have been slow to change.
That wasn’t always the case. MISO was a leader in wind development, but deployment has slowed nationally. PJM was an early front-runner in battery storage, but their participation in the RTO has cratered. Both markets have fallen behind CAISO and ERCOT in bringing new resources online.
Despite this stagnation, the sun is now peeking over the horizon. While these markets remain dominated by gas and coal, solar has finally become a notable percentage of generation across both PJM and MISO. This April, solar generation in PJM and MISO hit record highs and is beginning to reshape how other resources operate.
After years of delay—driven by minimal load growth, varying state policies, and barriers like PJM’s capacity market and interconnection backlog—the resource evolution in PJM and MISO is finally picking up momentum.
In this post, we explore:
- Why east-west orientation affects solar output in MISO and PJM
- How gas and coal operations are changing in response to solar growth
- What’s driving emissions higher even as renewables hit record levels
Wider Horizons
The rollout of solar generation in PJM, similar to other new energy sources like batteries, has been notably rocky. Interconnection backlogs and an infamous application freeze have slowed development, putting PJM behind other large ISOs. Despite these hurdles, April saw a considerable jump in generation compared to previous years.
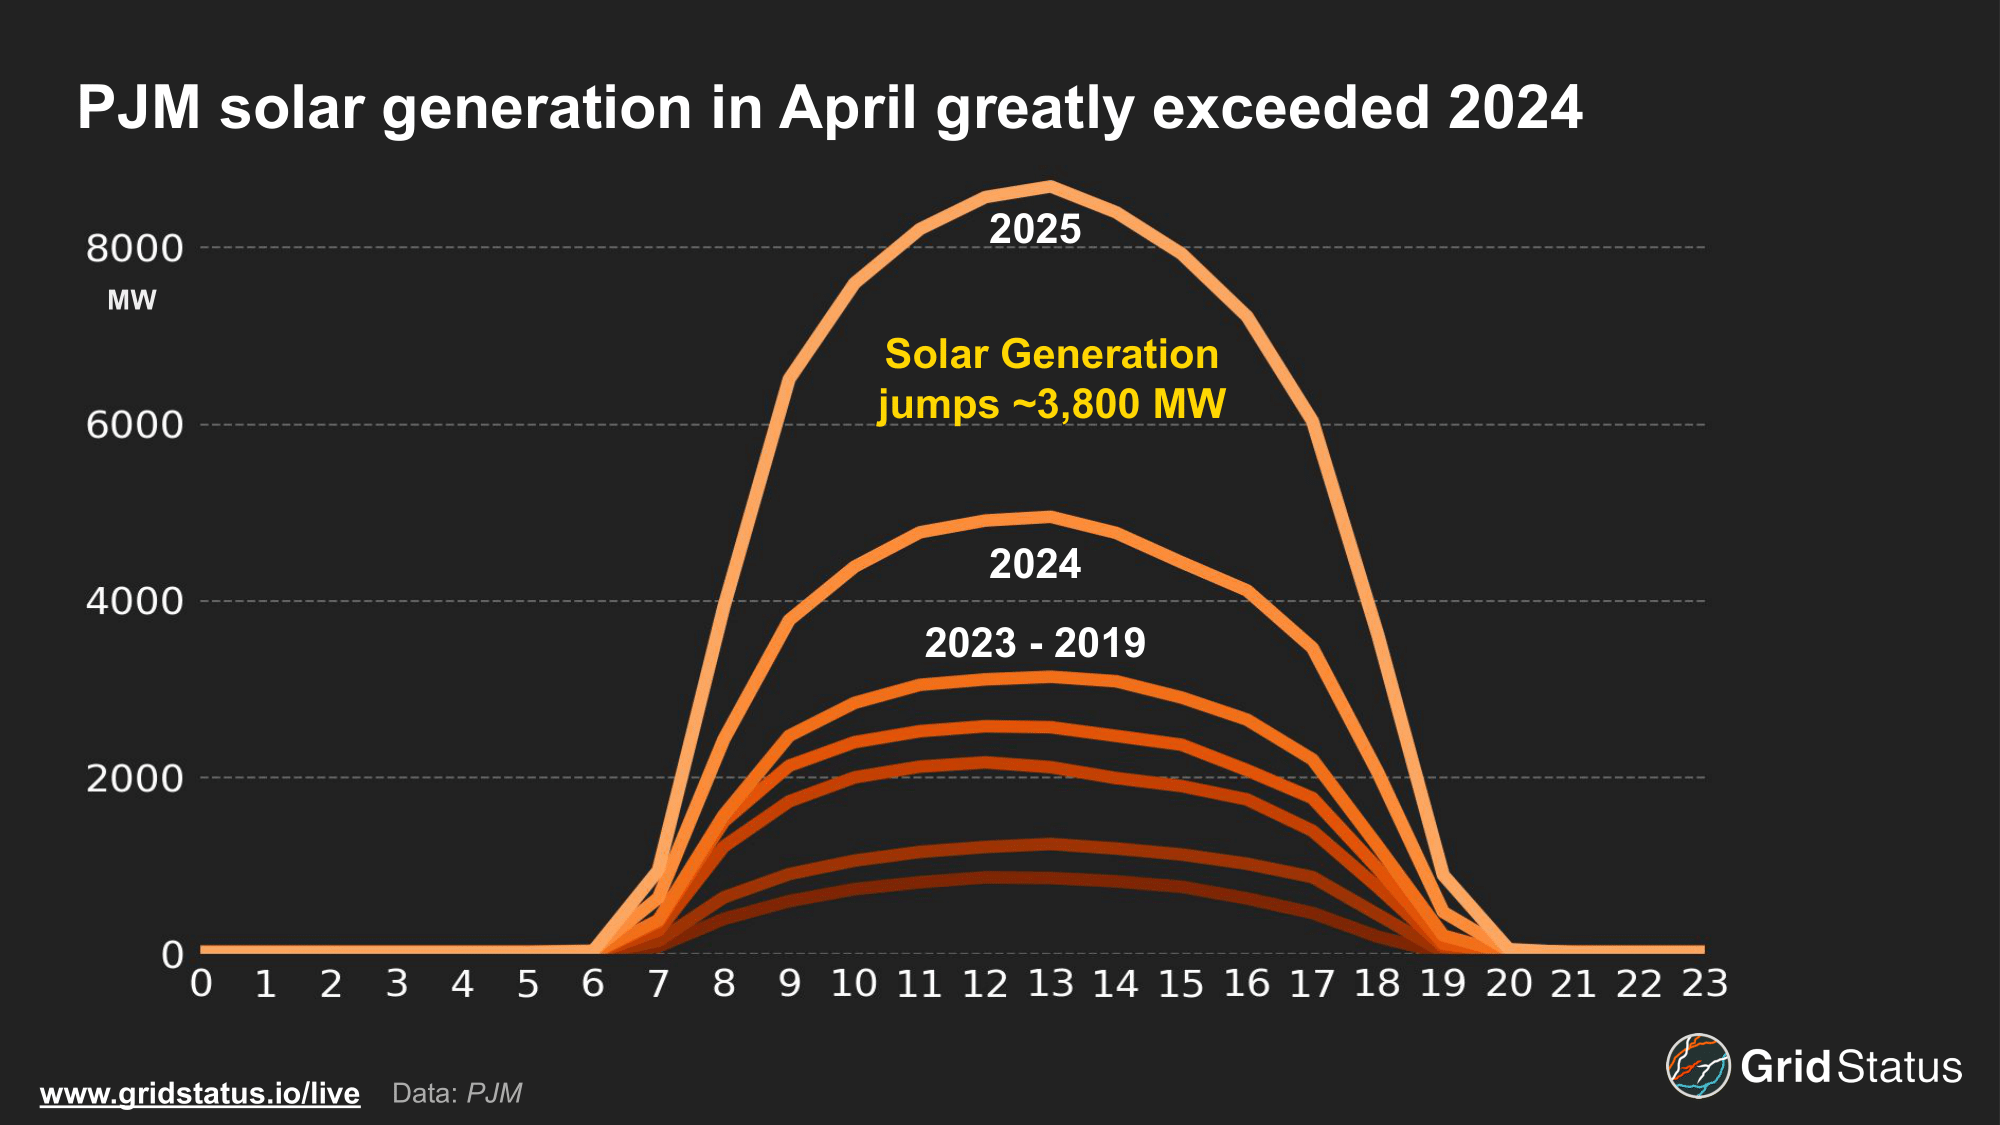
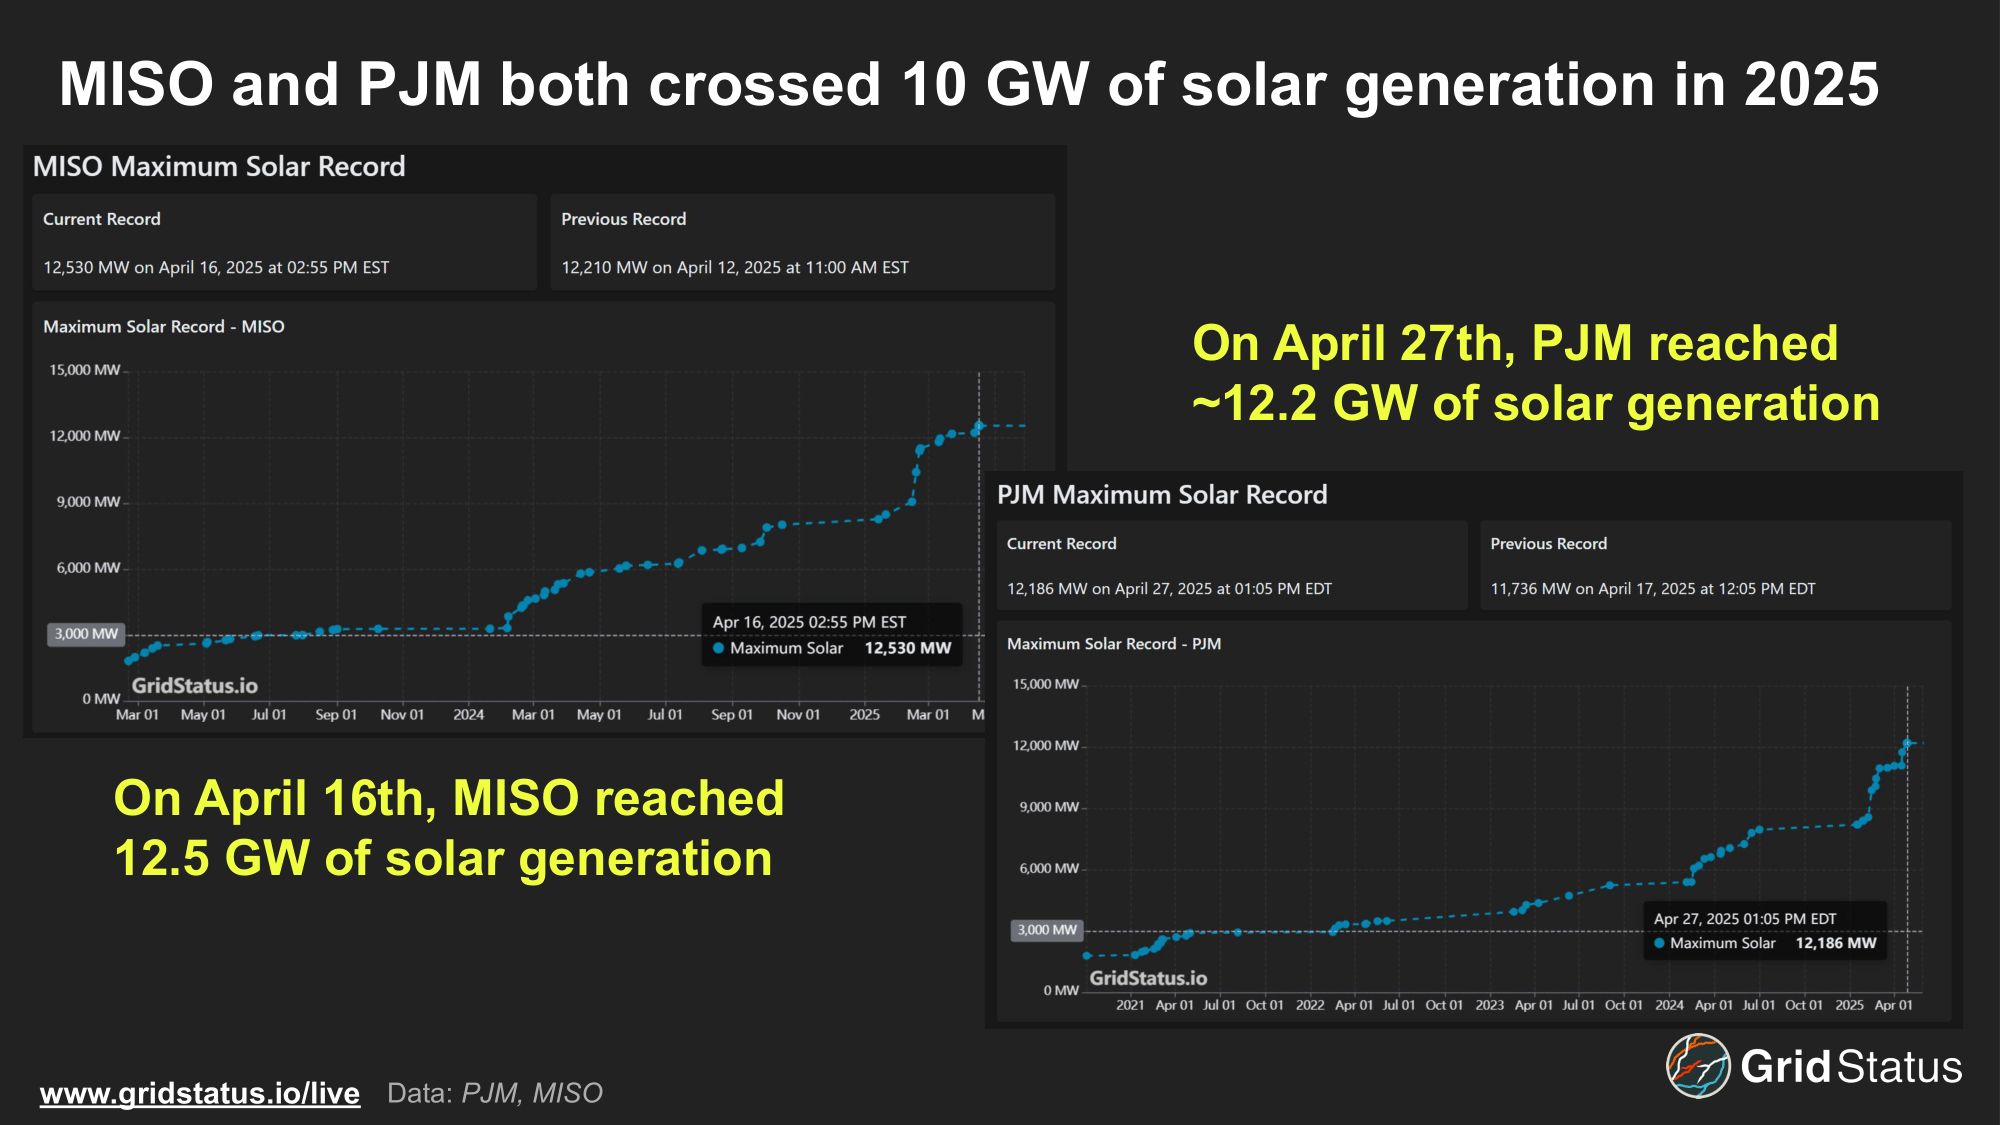
Solar generation jumped nearly 4 GW compared to April 2024. April also saw record solar production hit 12.2 GW, breaking the prior record that was hit just 10 days earlier. Increased development across the PJM footprint also led to a shift in the solar profile itself.
As development expanded in the Western half of the region (rather than remaining concentrated in the east) the aggregate solar curve has widened. PJM’s territory is spread out East to West, stretching from New Jersey to the border of Illinois and Iowa. This width allows for more hours of generation across the RTO and creates a rounder and more robust curve than smaller, N-S markets like CAISO.
This becomes clear when normalizing two days of record generation. Taking this year’s record and a prior from April 2021, the impact of Western buildouts is hard to miss.
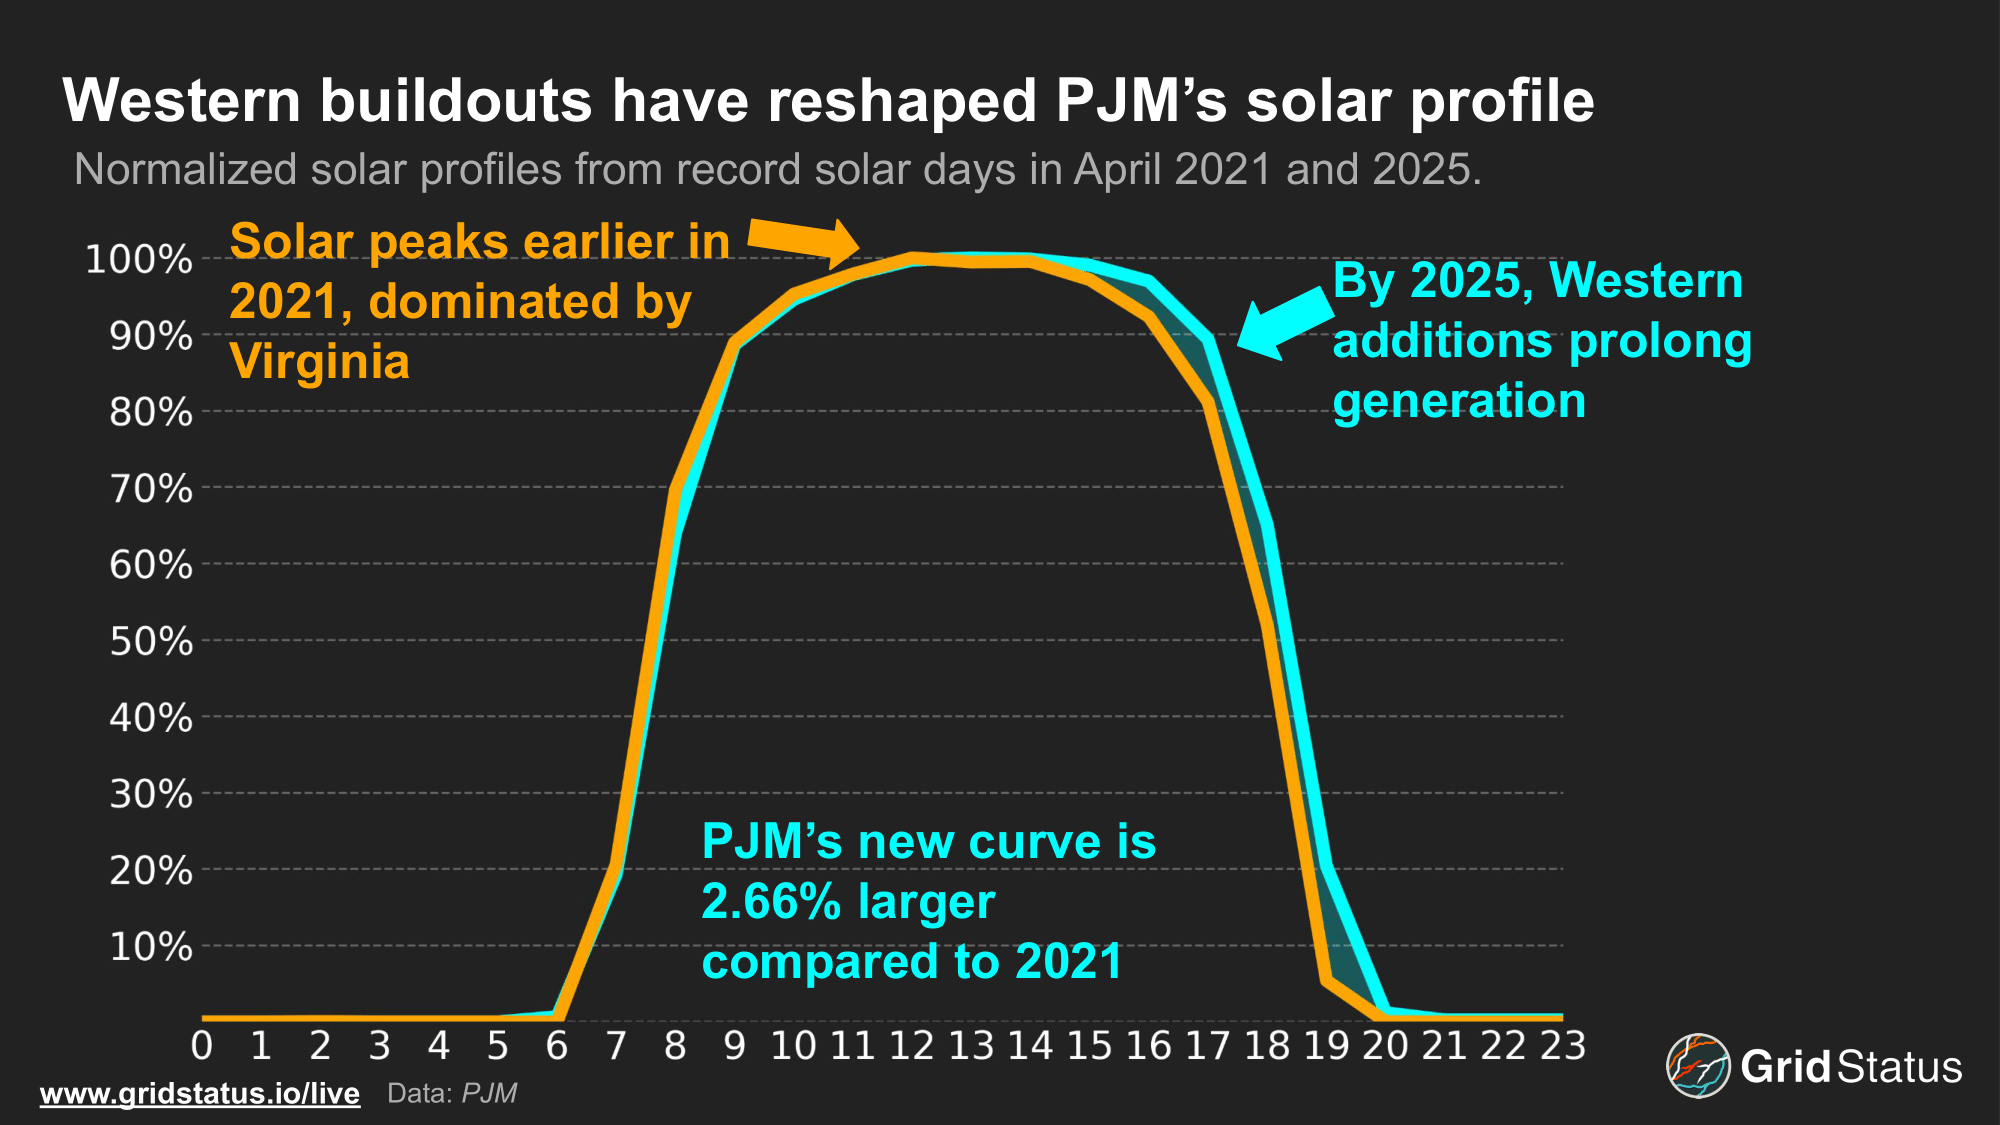
In 2021, the bulk of PJM’s installed solar capacity was concentrated in Eastern states like Virginia. This led to a quicker morning ramp and an earlier afternoon peak. By 2025, development extended further west and into areas like Illinois and Ohio, allowing for the generation profile to extend into the evening. Normalizing for capacity, the generation gain derived from extending PJM’s east-west solar spread was more than 2.5%.
Operators now have more solar available for longer, all enabled entirely by development taking advantage of PJM’s E-W geographic setup.
House of the Rising Sun
Similar to neighboring PJM, solar generation in MISO has struggled to gain a significant market share. This year saw the largest jump in solar generation, averaging a nearly 5 GW increase compared to last April.
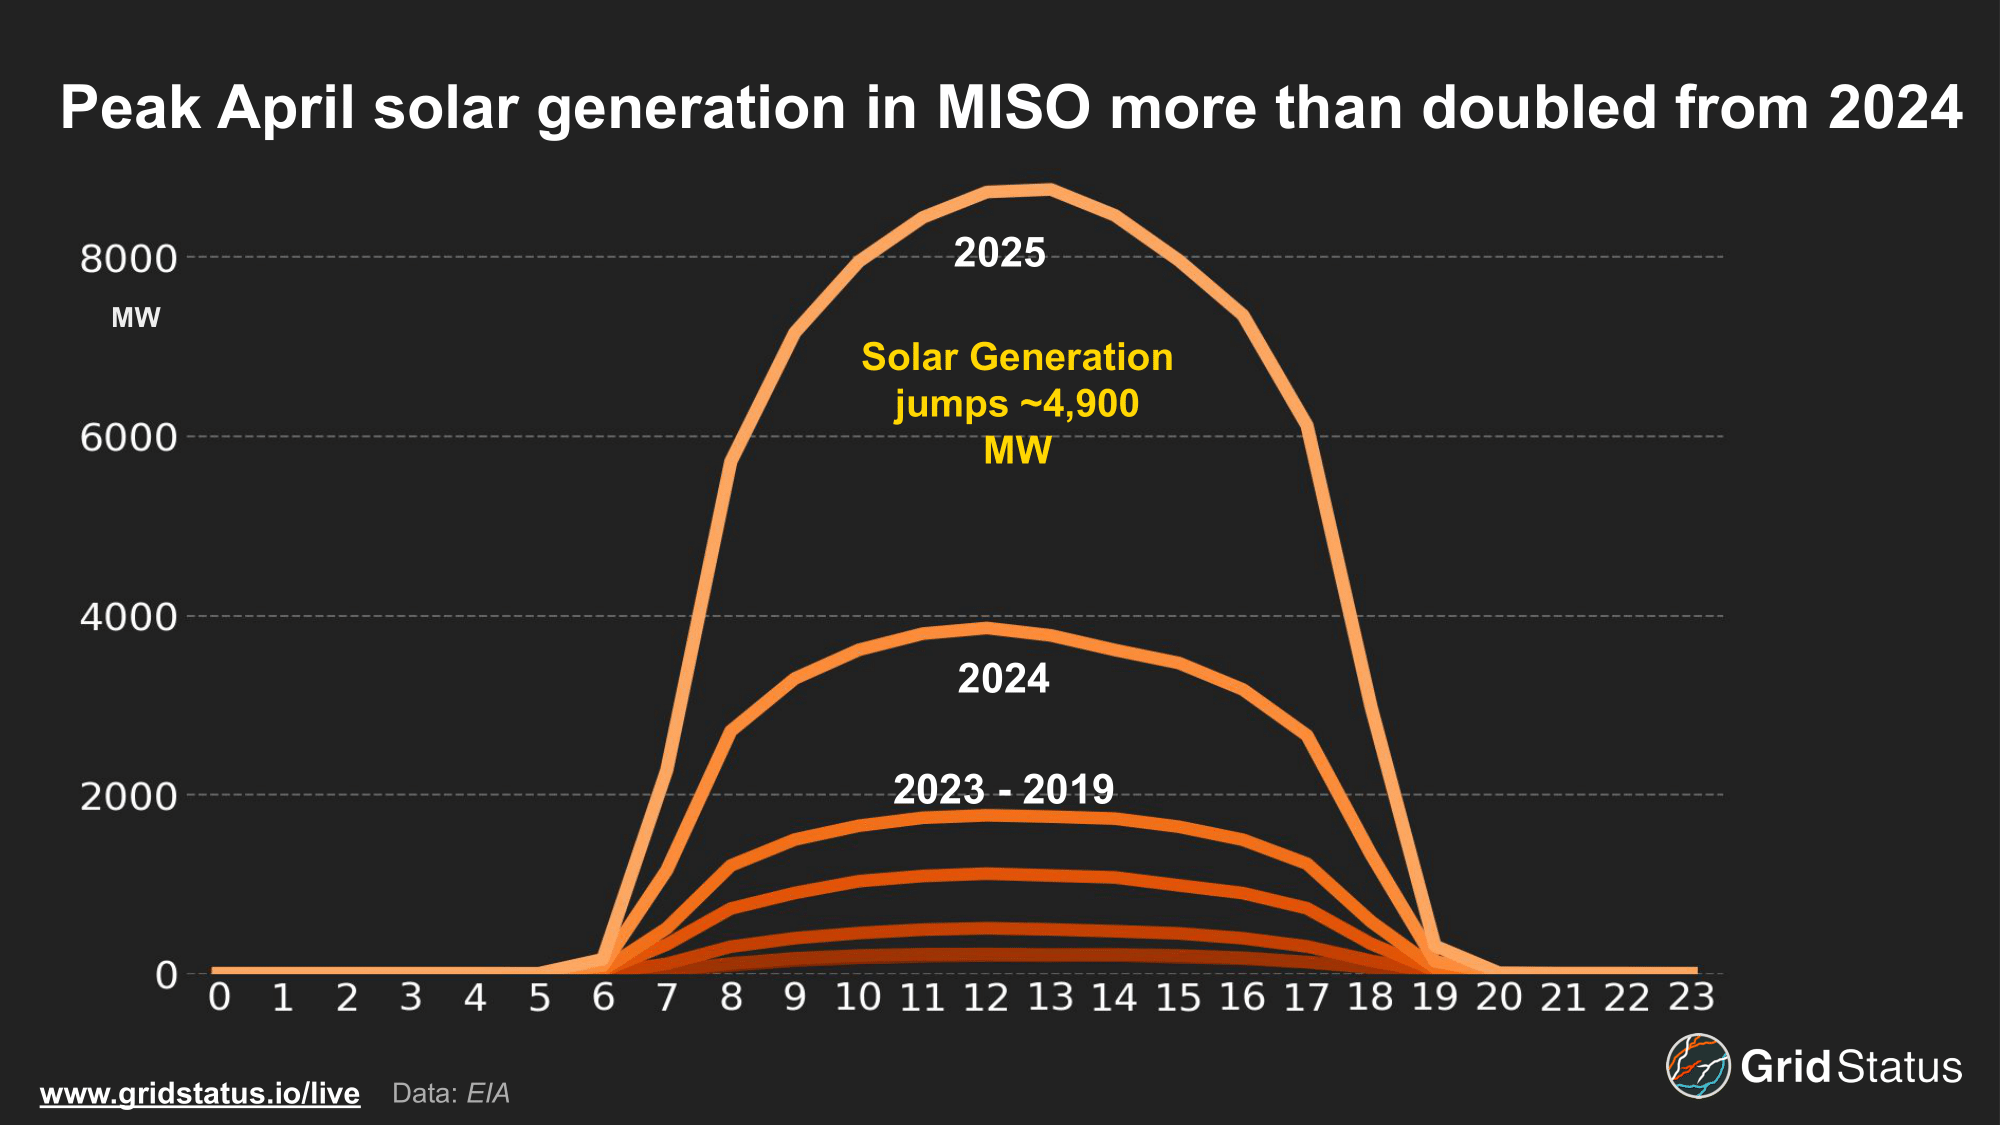
Average MISO solar generation narrowly beat out PJM, even though PJM had higher solar penetration just last year. Additionally, MISO’s record solar generation came in higher than PJM’s, hitting ~12.5 GW on April 16th.
Evident in its name, MISO’s territory follows the mid-continent in much more of a N-S shape, limiting the different times that solar produces. Solar development so far has followed a much narrower geographic area, primarily in MISO North and Central.
The timing of solar generation gains additional importance when looking at MISO’s capacity auction and solar’s accreditation. MISO bases unit accreditation outside of winter on performance between HE 15-17. Normalizing solar generation in July and August, often MISO’s riskiest summer months, shows how output declines heading into the evening cooling load peak.
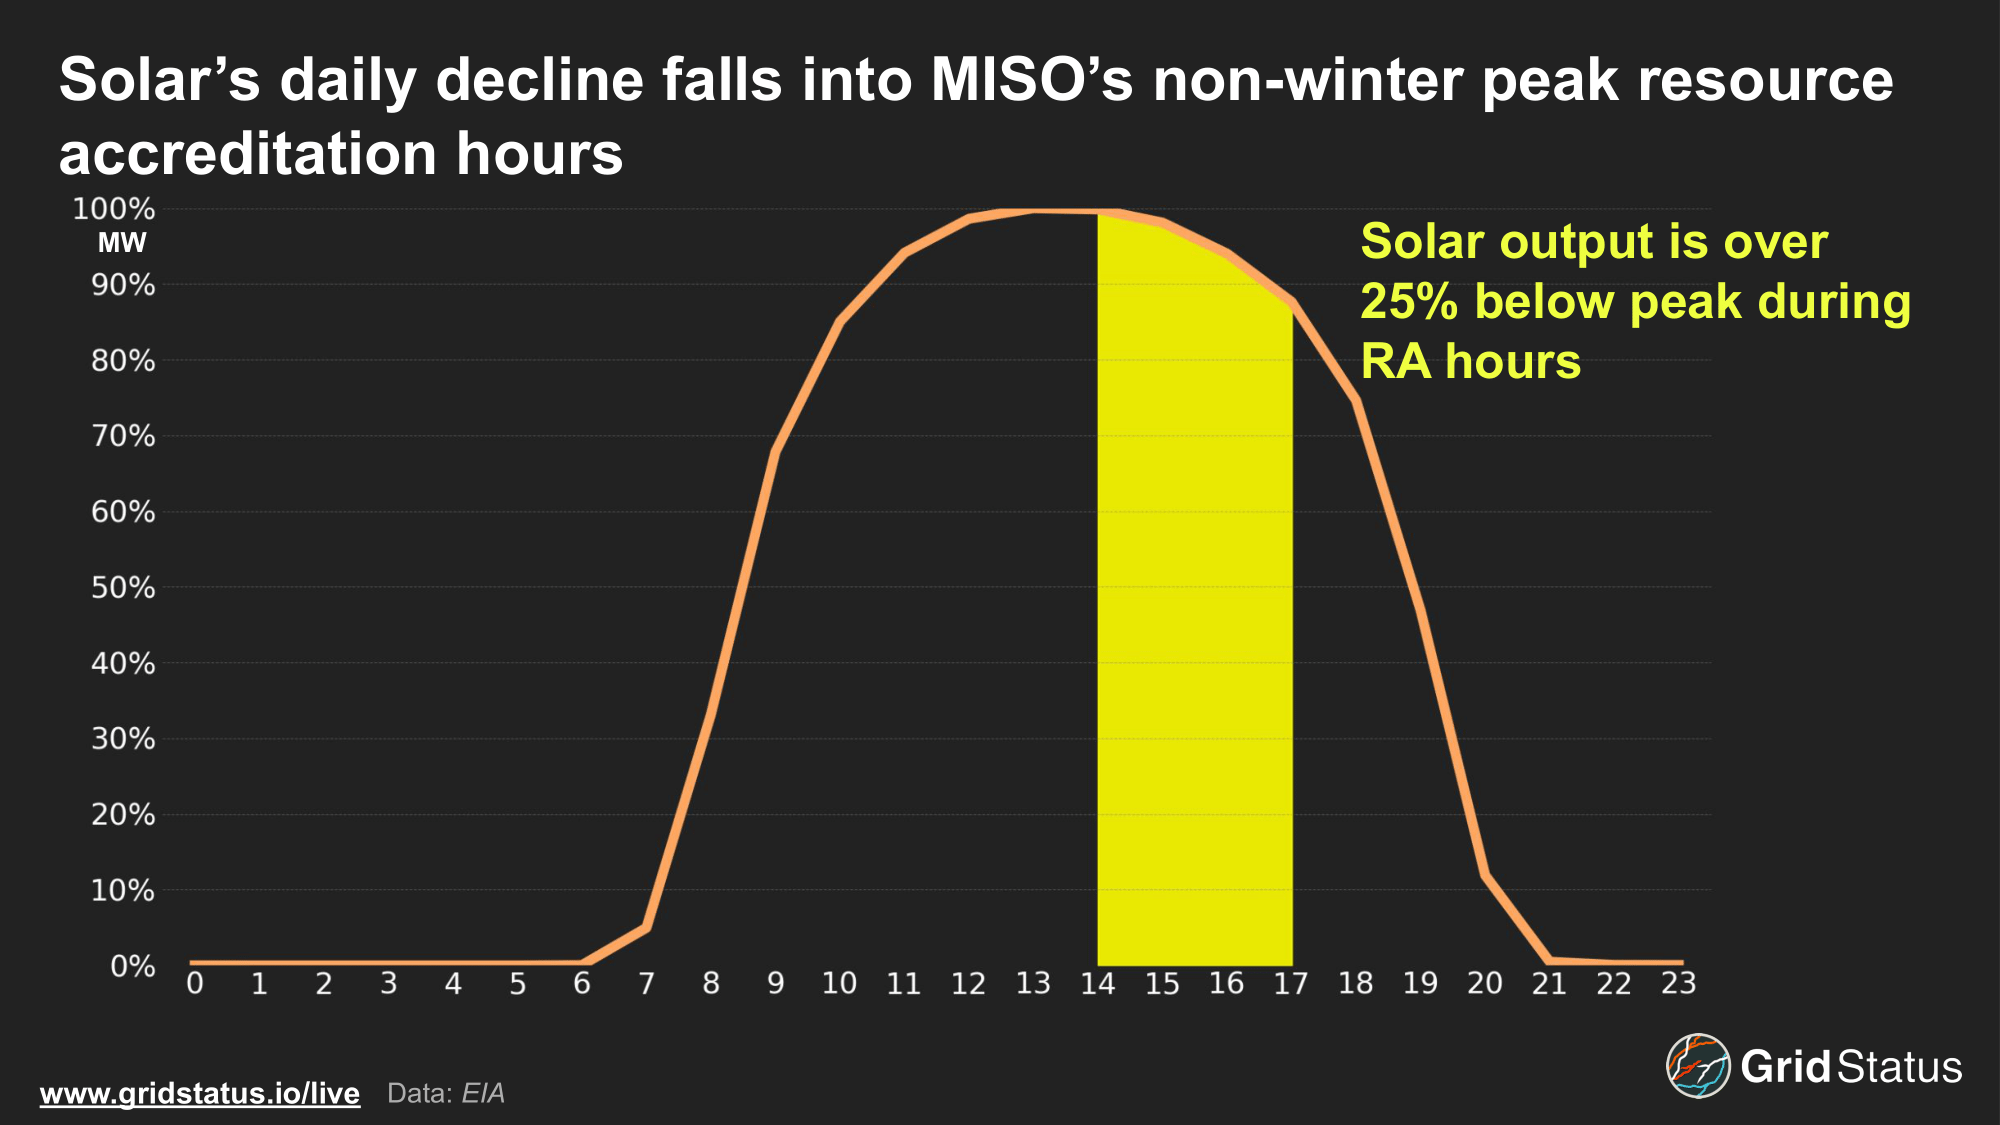
Solar made up a considerable portion of MISO’s capacity resources this summer, clearing over 9 GW in the recent auction and beating wind by 3 GW. Capacity rose by more than 80% year over year, making up 6.1% of the total resource mix, just a hair over demand response. Even with the influx of solar generation, decreased unit accreditations paired with retirements led to tighter reserve margins and increased capacity prices.
MISO’s summer 2025 capacity prices jumped over 2,000% to $666.50/MW day as margins fell to 7.9%. While the appearance of lucrative capacity payments may lure additional development, MISO’s queue is already jam-packed, and the location of these will impact projects. Solar located further in Western portions of MISO could have the ability to produce more over the afternoon, better meeting peak hours. Additionally, MISO’s Planning Resource Auction (PRA) remains somewhat deceptive in that a relatively small portion of the total resource adequacy requirement is met by entirely competitive projects in the auction while Self Scheduled resources continue to dominate total capacity.
As solar plays an increasingly important role in internal operations, the growth of renewables will complicate inter-regional power flows. Normalizing both regions’ record solar peaks, the differing profiles become clear.
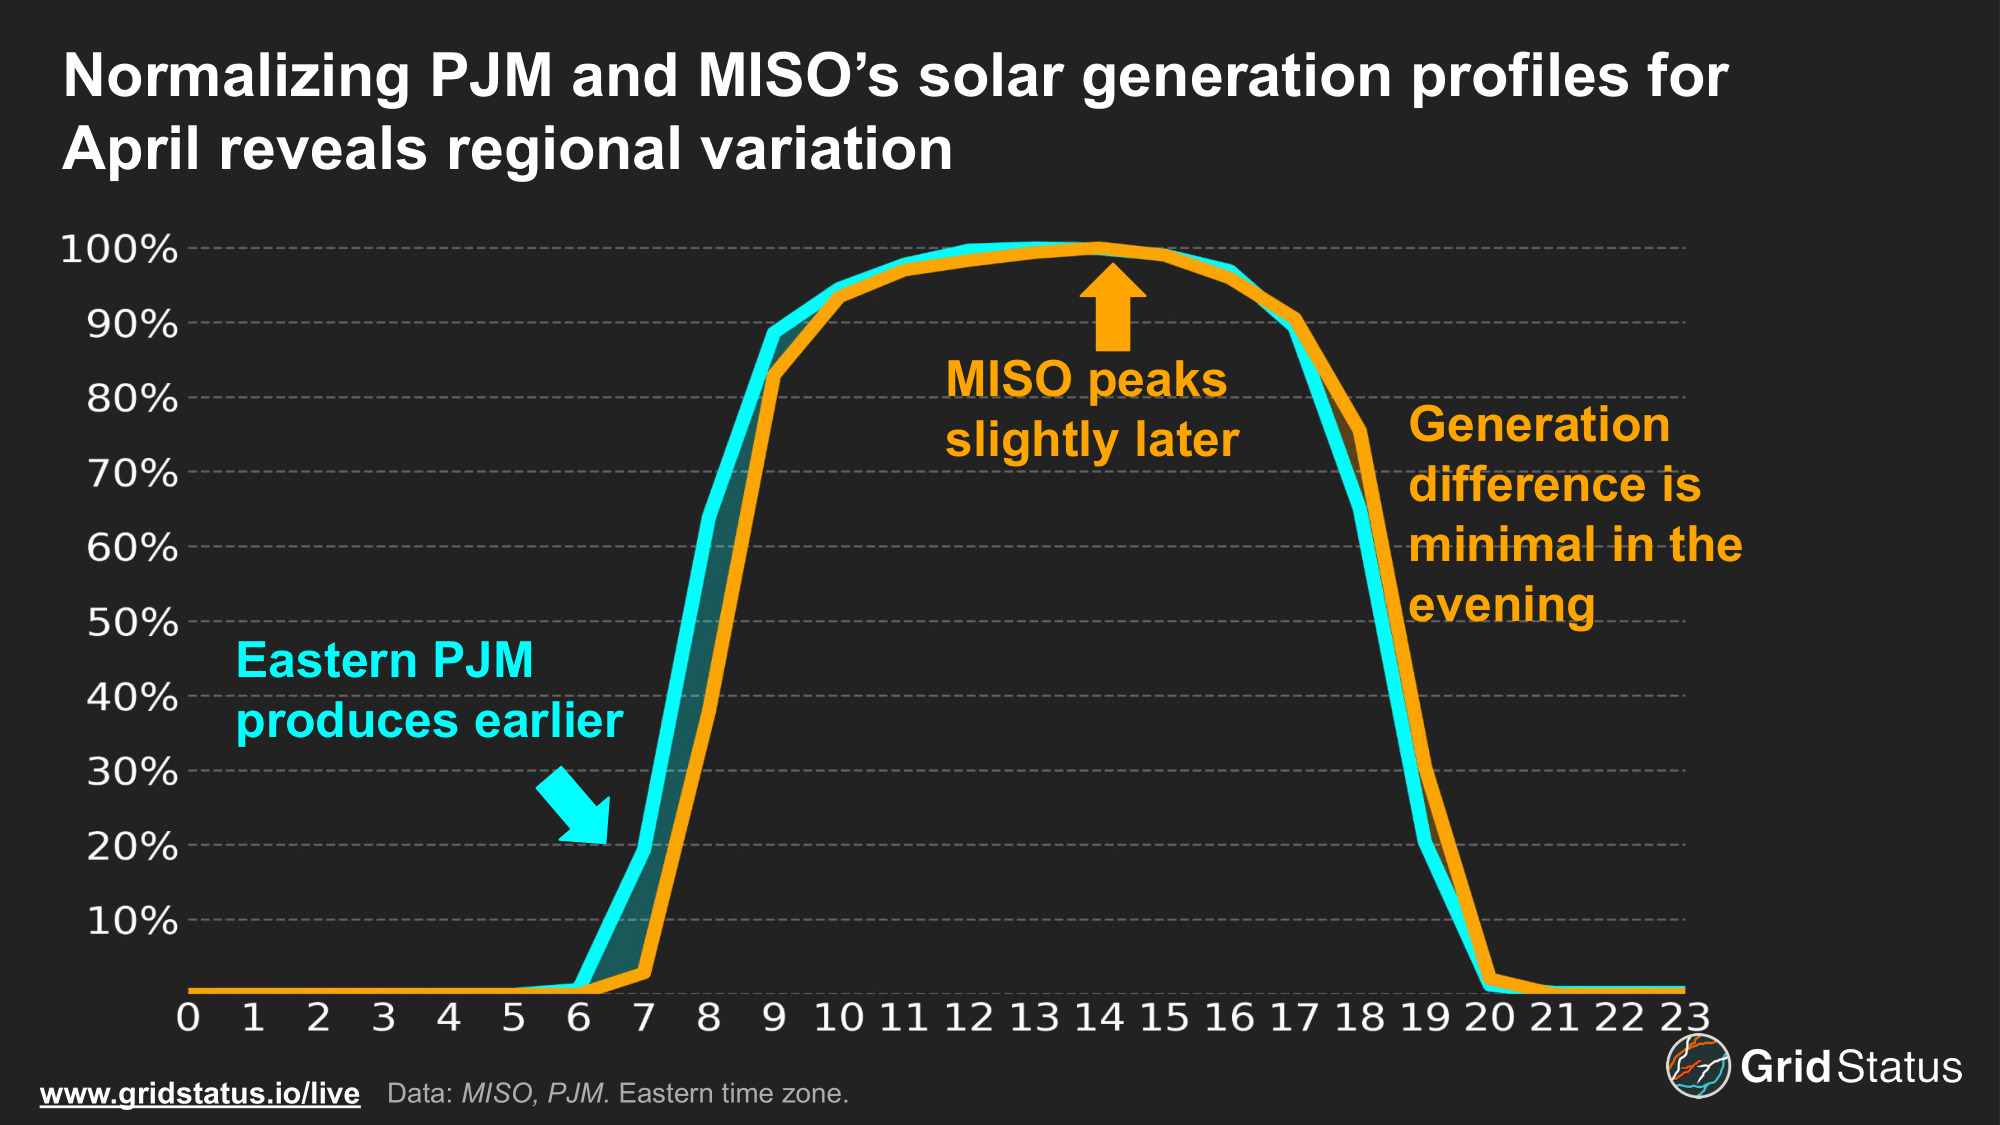
While PJM has seen development trends expand West, a considerable portion of generation is still concentrated further east in states like Virginia. This allows for PJM’s solar generation to ramp up ahead of MISO’s. Both PJM and MISO experience a decline in generation at similar rates and times, limiting the opportunity for exports and presenting operational challenges as solar production falls in tandem, heading into the cooling load peak.
Bent Into Shape
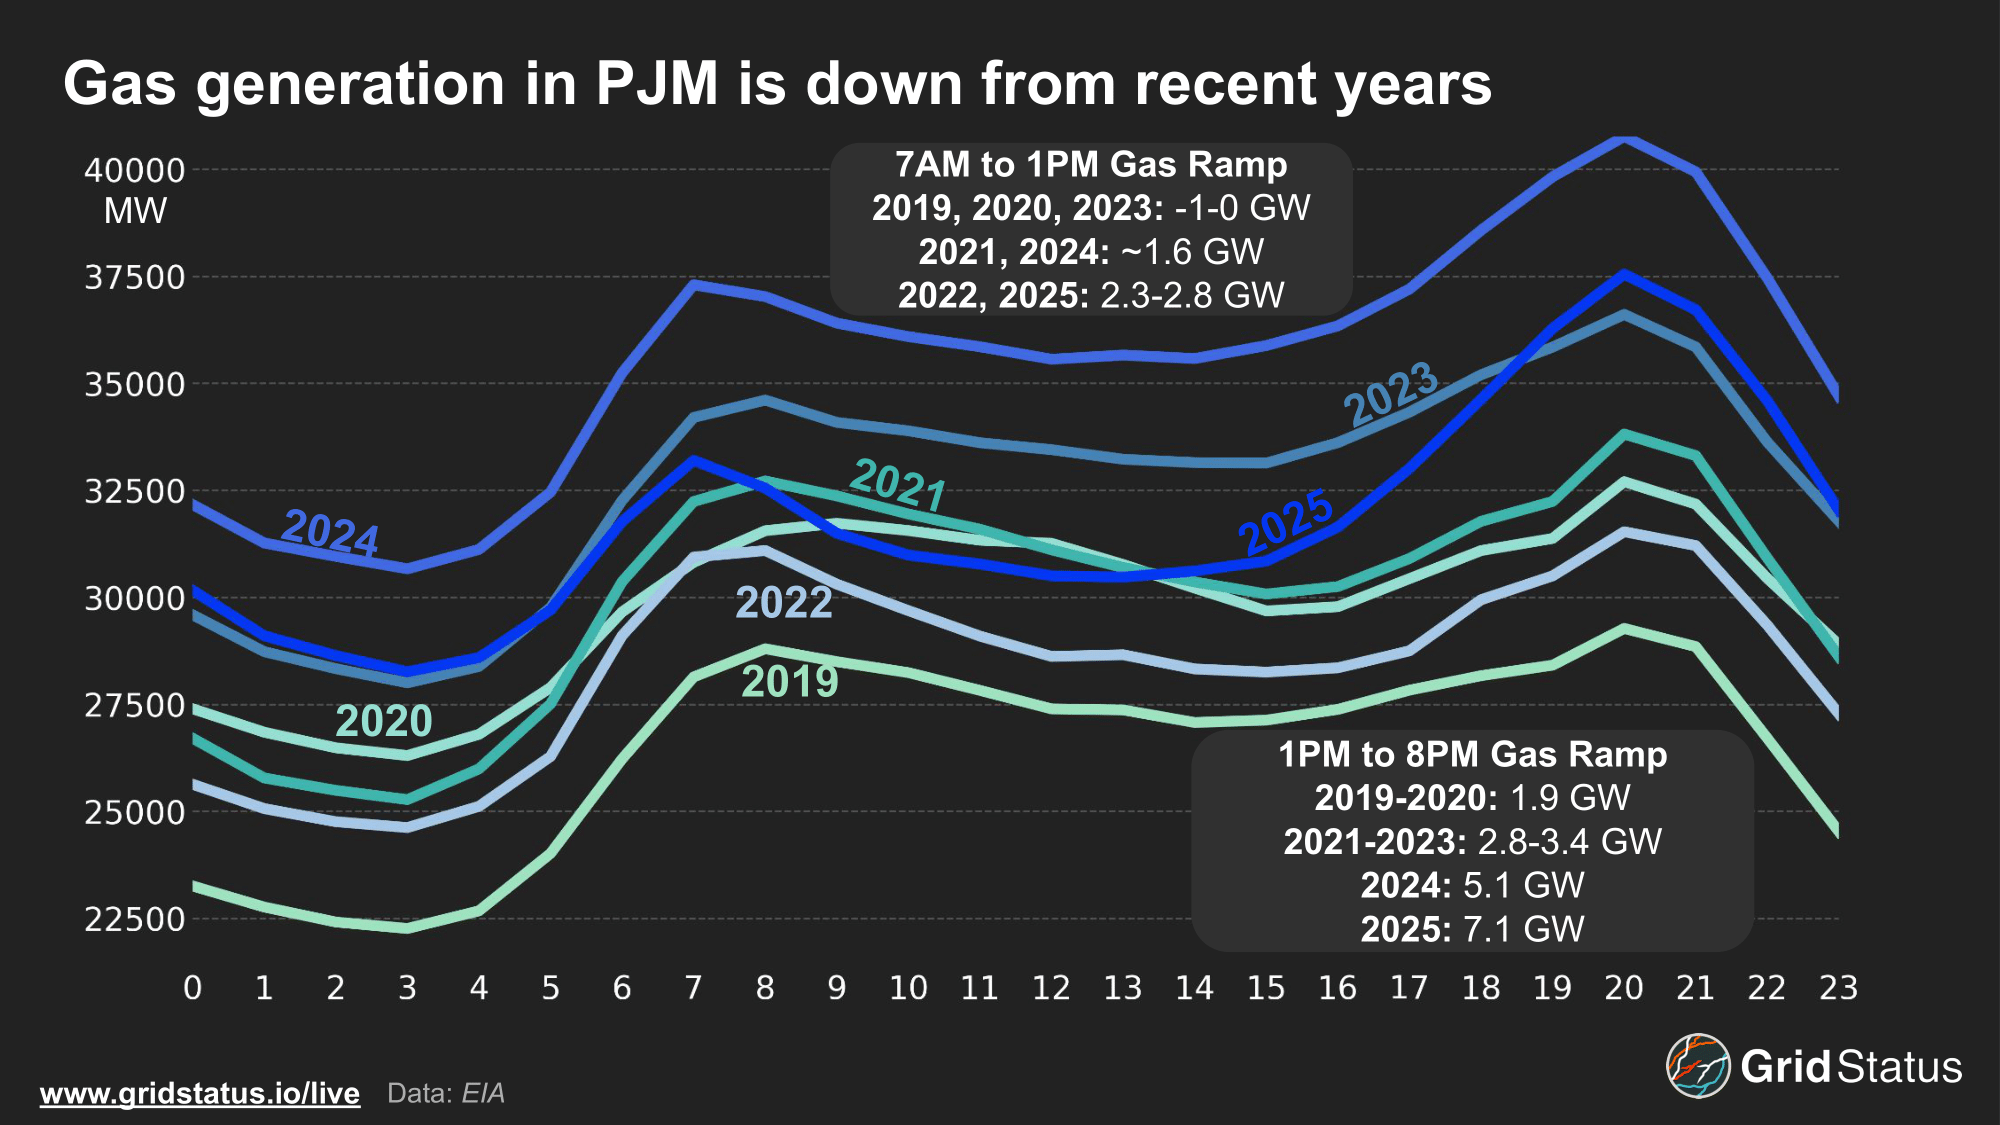
Gas generation fell by ~5 GW at midday compared to 2024, while the diurnal curve has become more pronounced, dipping during the midday trough and rising sharply over the afternoon. This April saw gas ramp over 7 GW into the evening peak.
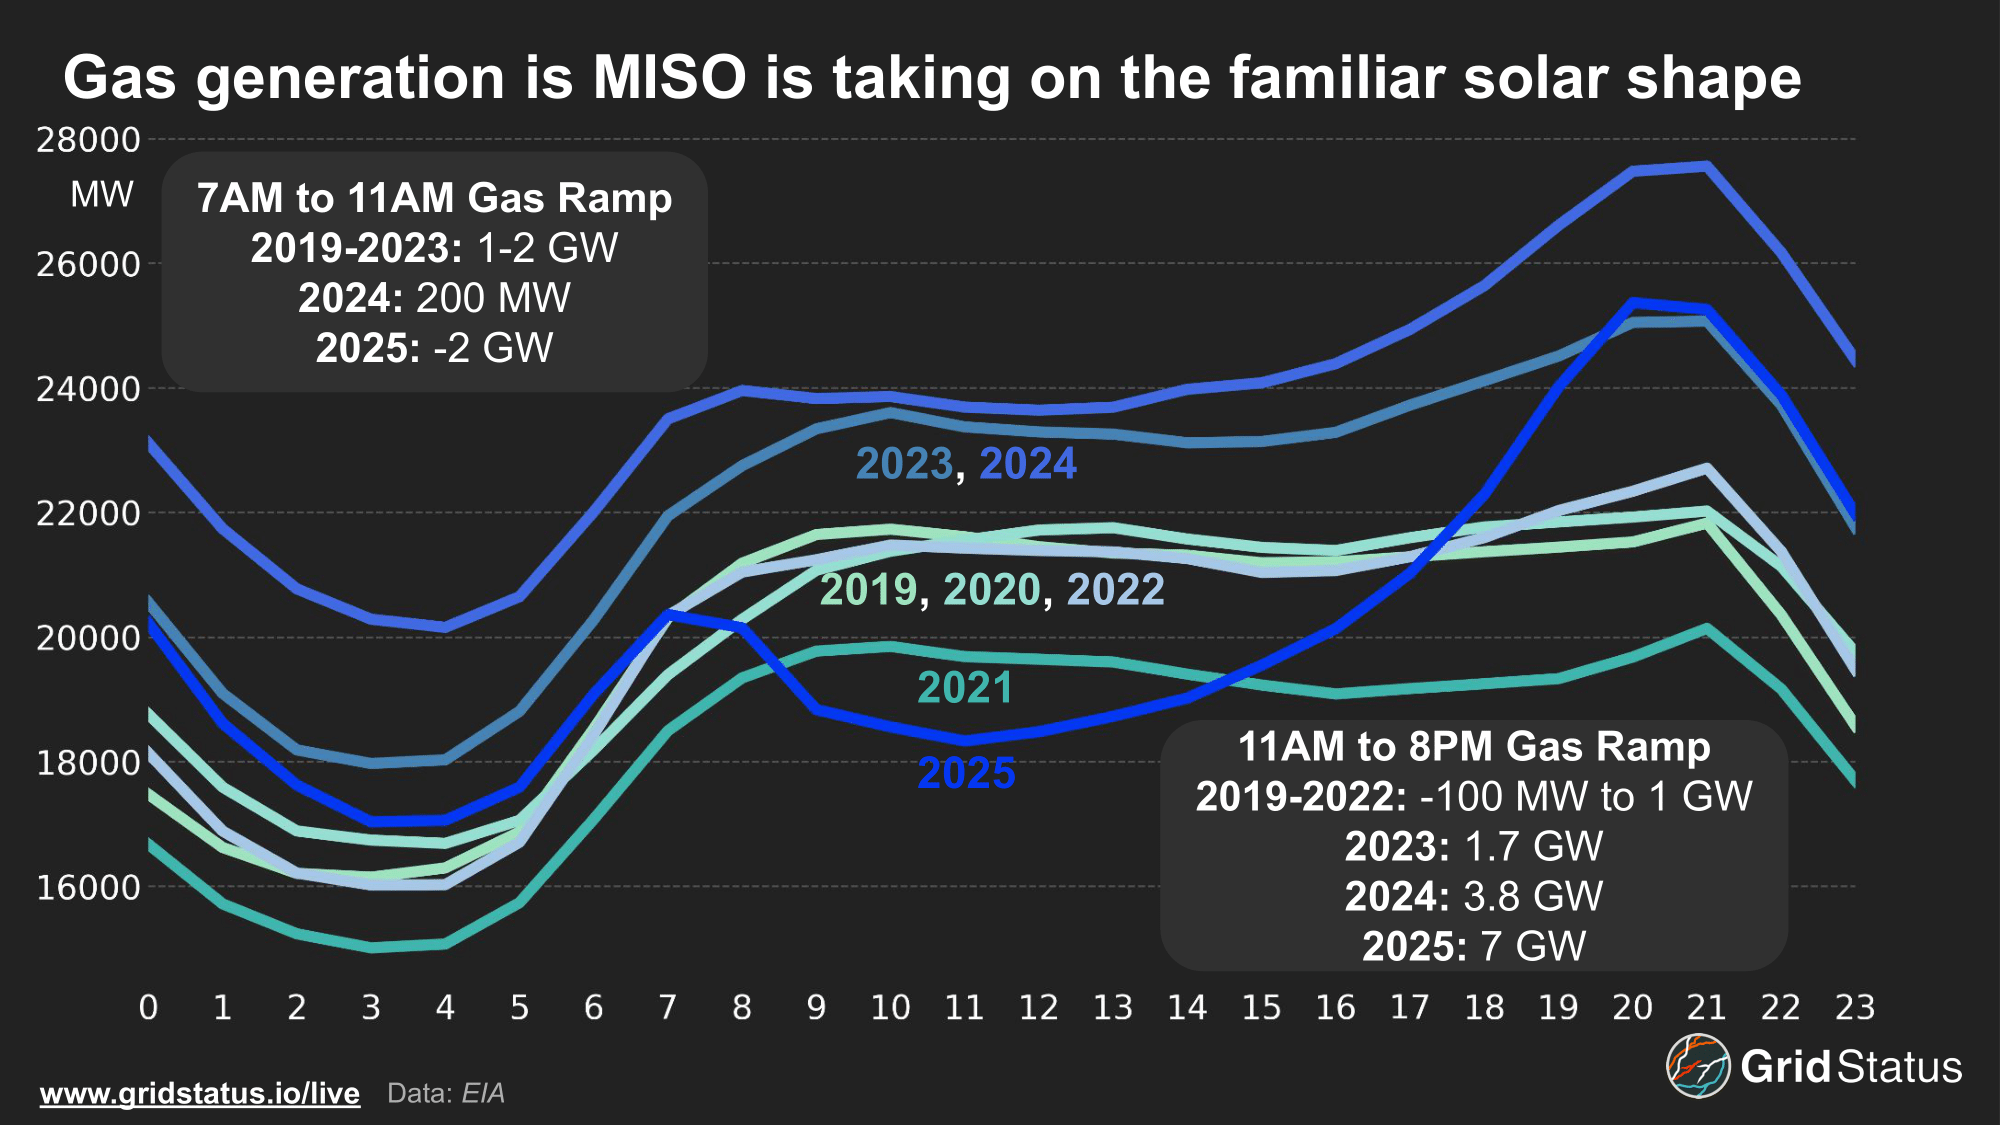
Gas generation in MISO also declined significantly in 2025 and was notably weaker during solar hours.
Generation dipped following the morning ramp, falling 2 GW from 7 AM to 11 AM, while midday generation was up to 4 GW lower than the past two years. Similar to PJM, MISO gas saw a 7 GW ramp heading into the evening peak.
While the absolute increase into the evening is the same in both regions, a lower starting point in MISO ends up driving a 33% increase in gas-fired generation compared to 18% in PJM.
While solar contributed to shaping gas output, wider market trends are also at play. Based on EIA data, Henry Hub spot prices doubled year over year from $1.60/MMBtu to $3.42/MMBtu, and total lower 48 storage fell nearly 500 Bcf compared to the previous spring. Increased withdrawals, particularly during January, left storage lower than in the past two years.
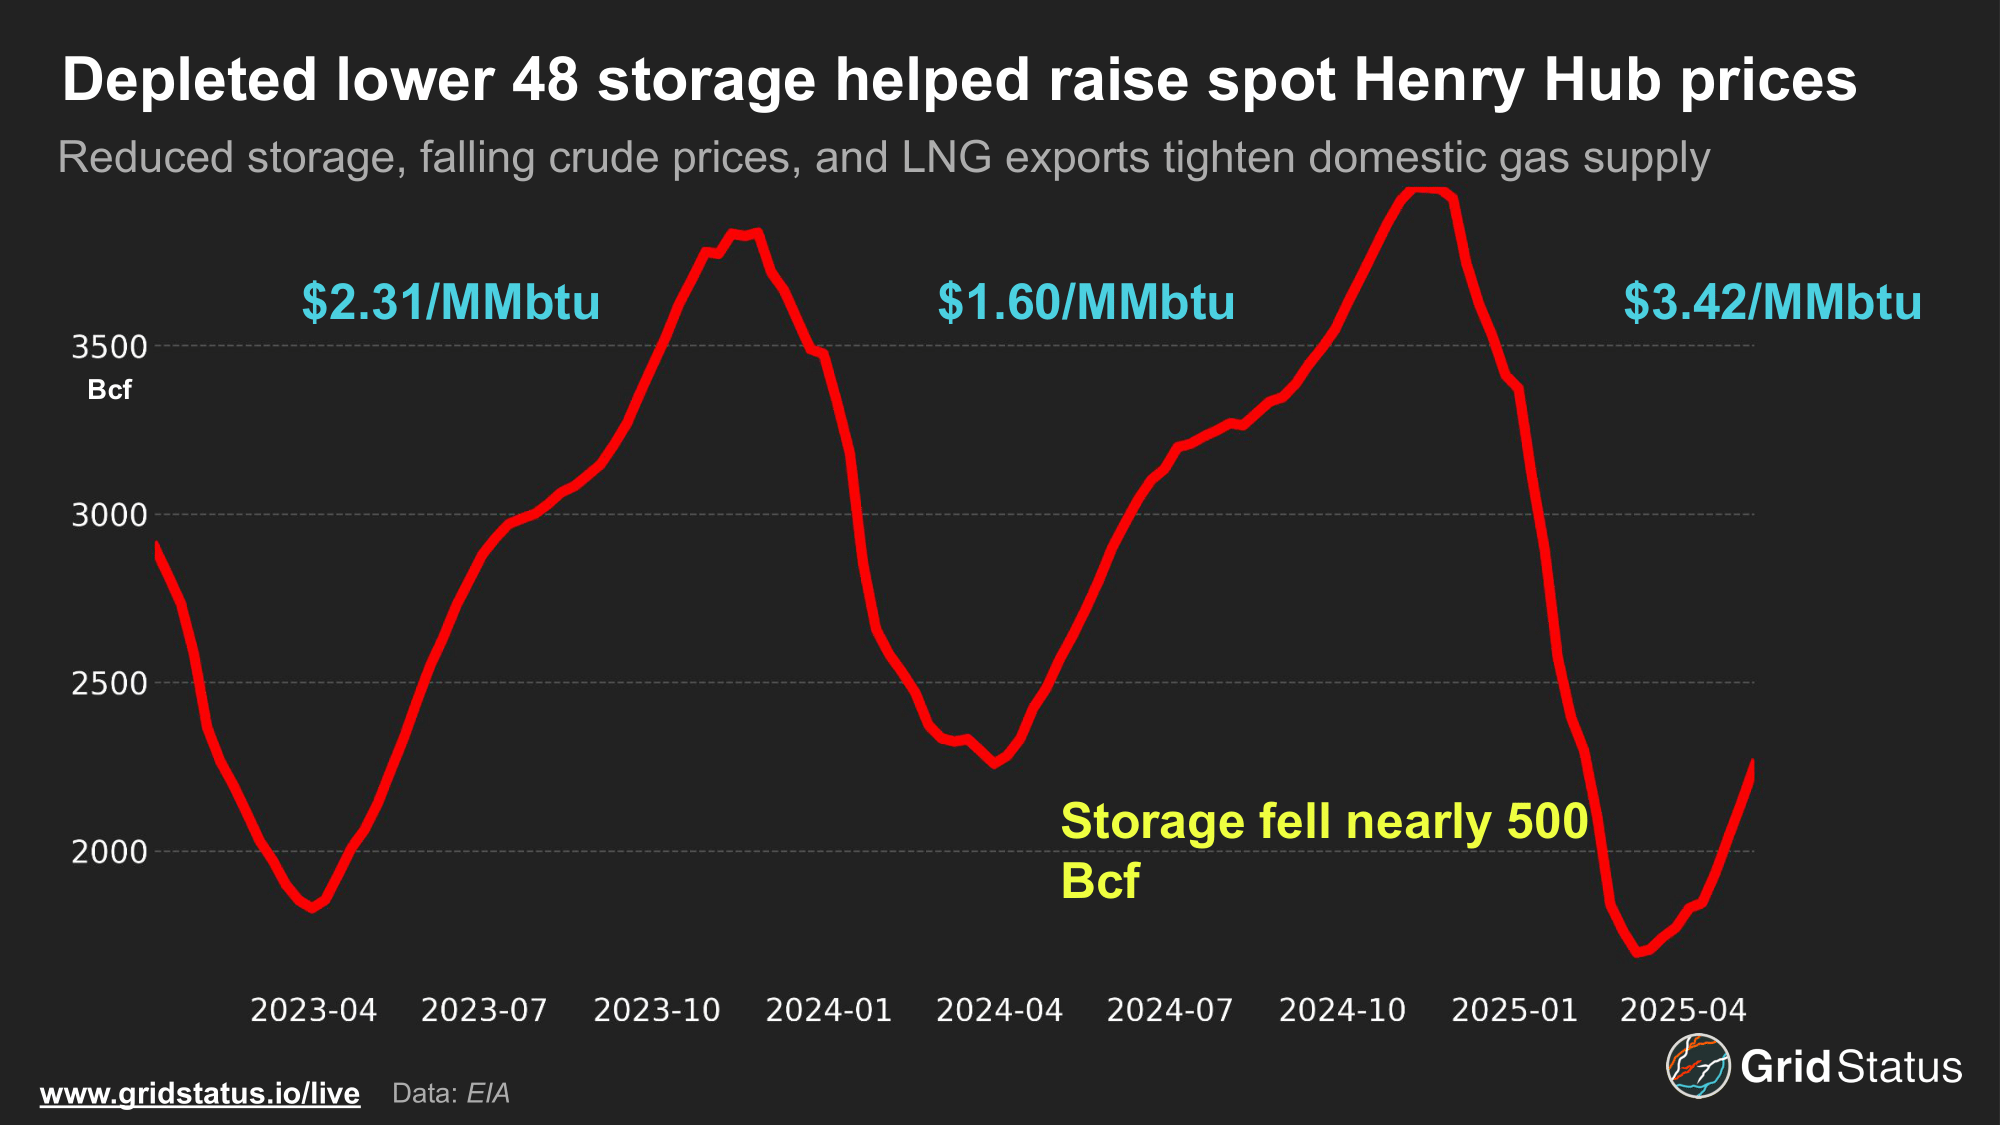
Falling crude prices may have also contributed to rising prices as oil producers reduce operations. While oil production remained high in January, February declined, and the operating rig count remains below 600. Falling oil production reduces production of the associated gas, whose own value is insufficient incentive to continue operations under depressed oil prices. In the first two months of the year, LNG exports also rose to record levels, putting further pressure on natural gas prices.
This combination of reduced gas storage, potentially constrained production, and increased exports likely pushed spot prices higher, rendering some gas units uneconomic, especially as solar gained a larger share of the supply stack.
Visions of Coal Again
After years of continued decline, both PJM and MISO saw a sharp increase in coal generation. The increase in generation was not the result of a “dead coal bounce” from a retiring plant, nor was it driven by shifts in spot pricing, with only small changes year-over-year, as pricing was largely stable year-over-year. According to the EIA, April’s spot Central Appalachian sat at $3.25/MMBtu, 4% higher than 2024’s average of $3.12/MMBtu.
Instead, coal appears to be increasingly dispatched to fill in the gap left by gas generation pushed out by a combination of higher fuel prices and increased midday solar generation.
Coal lacks the flexibility to ramp down to the same degree as gas, leading to a flatter generation profile during peak hours.
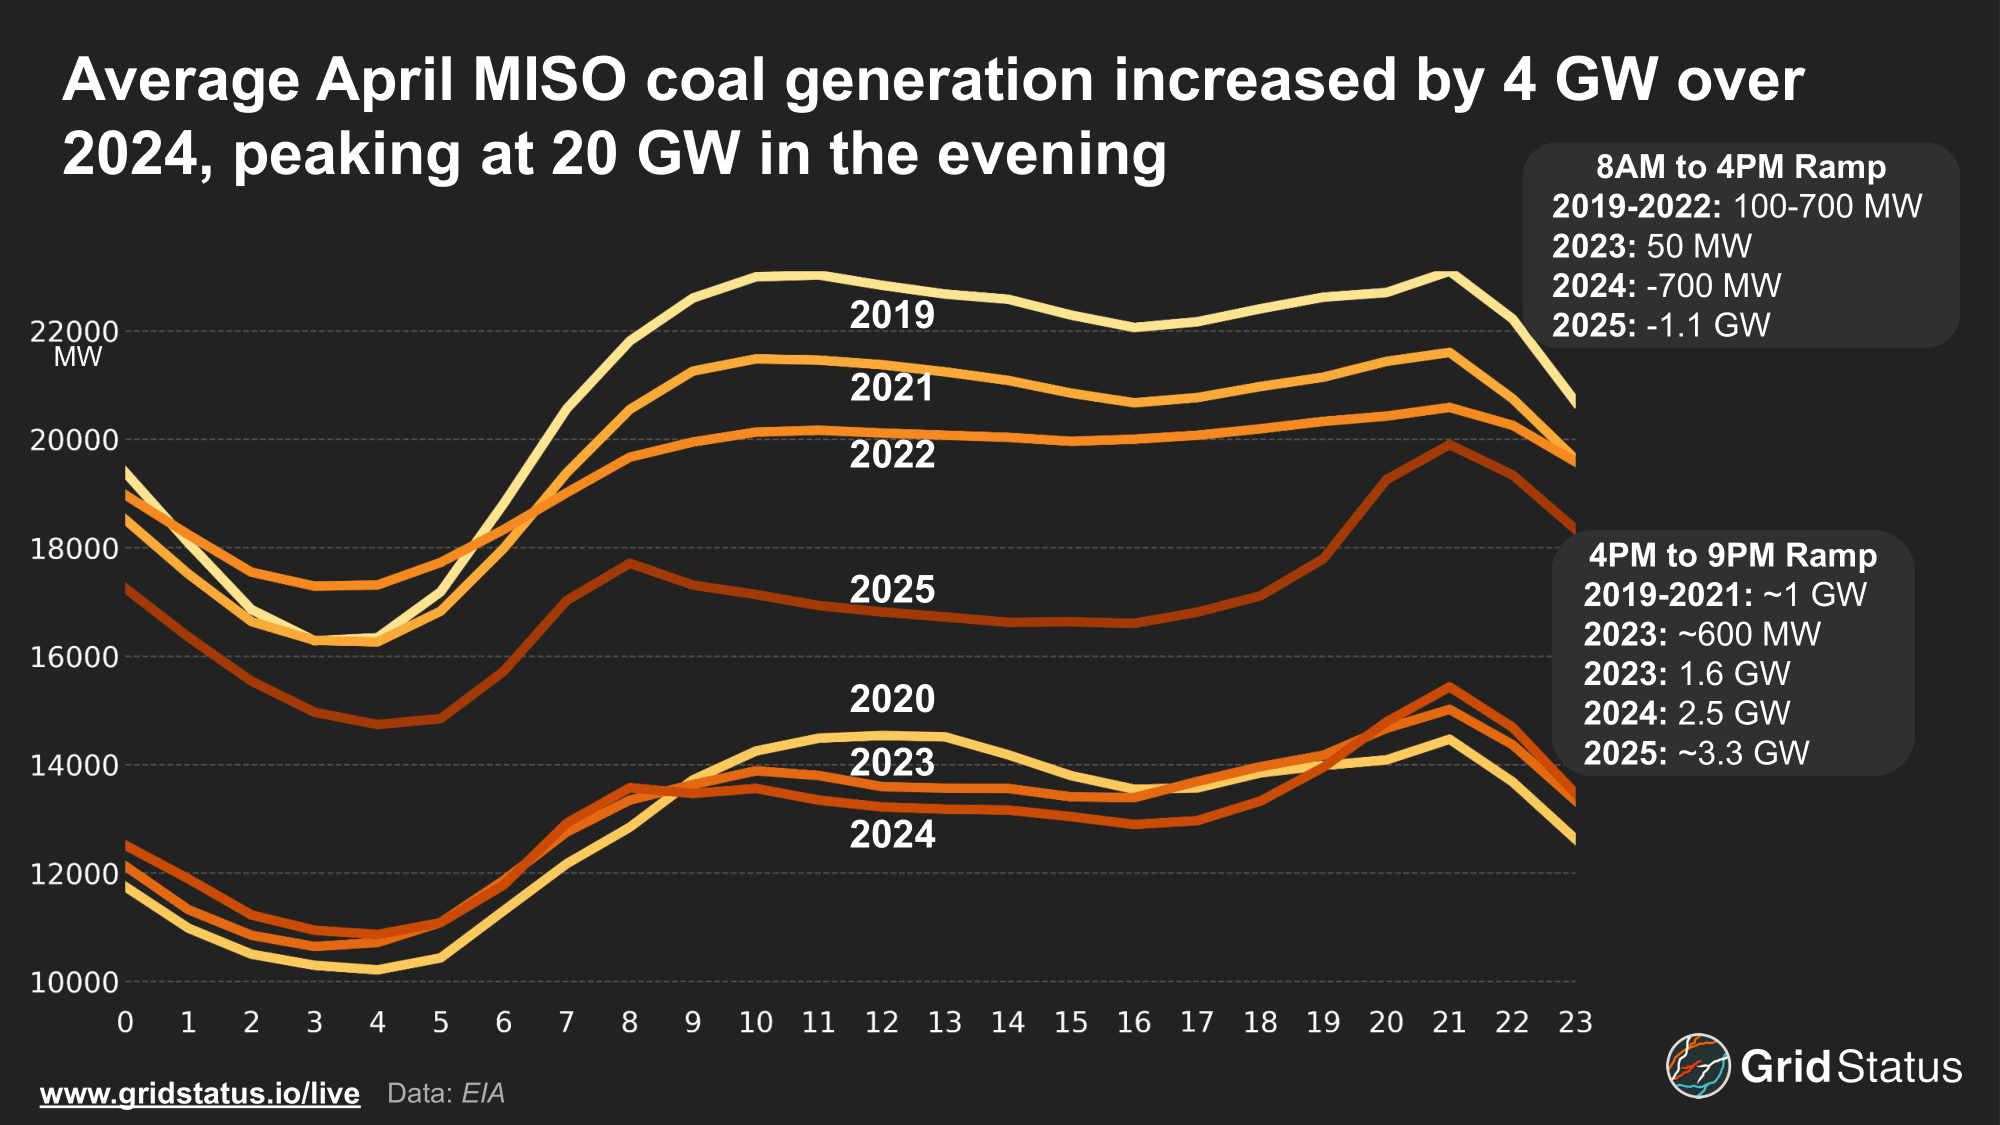
Interestingly, MISO saw a much sharper increase in coal generation and a more exaggerated generation profile. Coal plays a bigger, yet still diminished, role in MISO in part due to the shale gas revolution and PJM’s easy access to the Marcellus region.
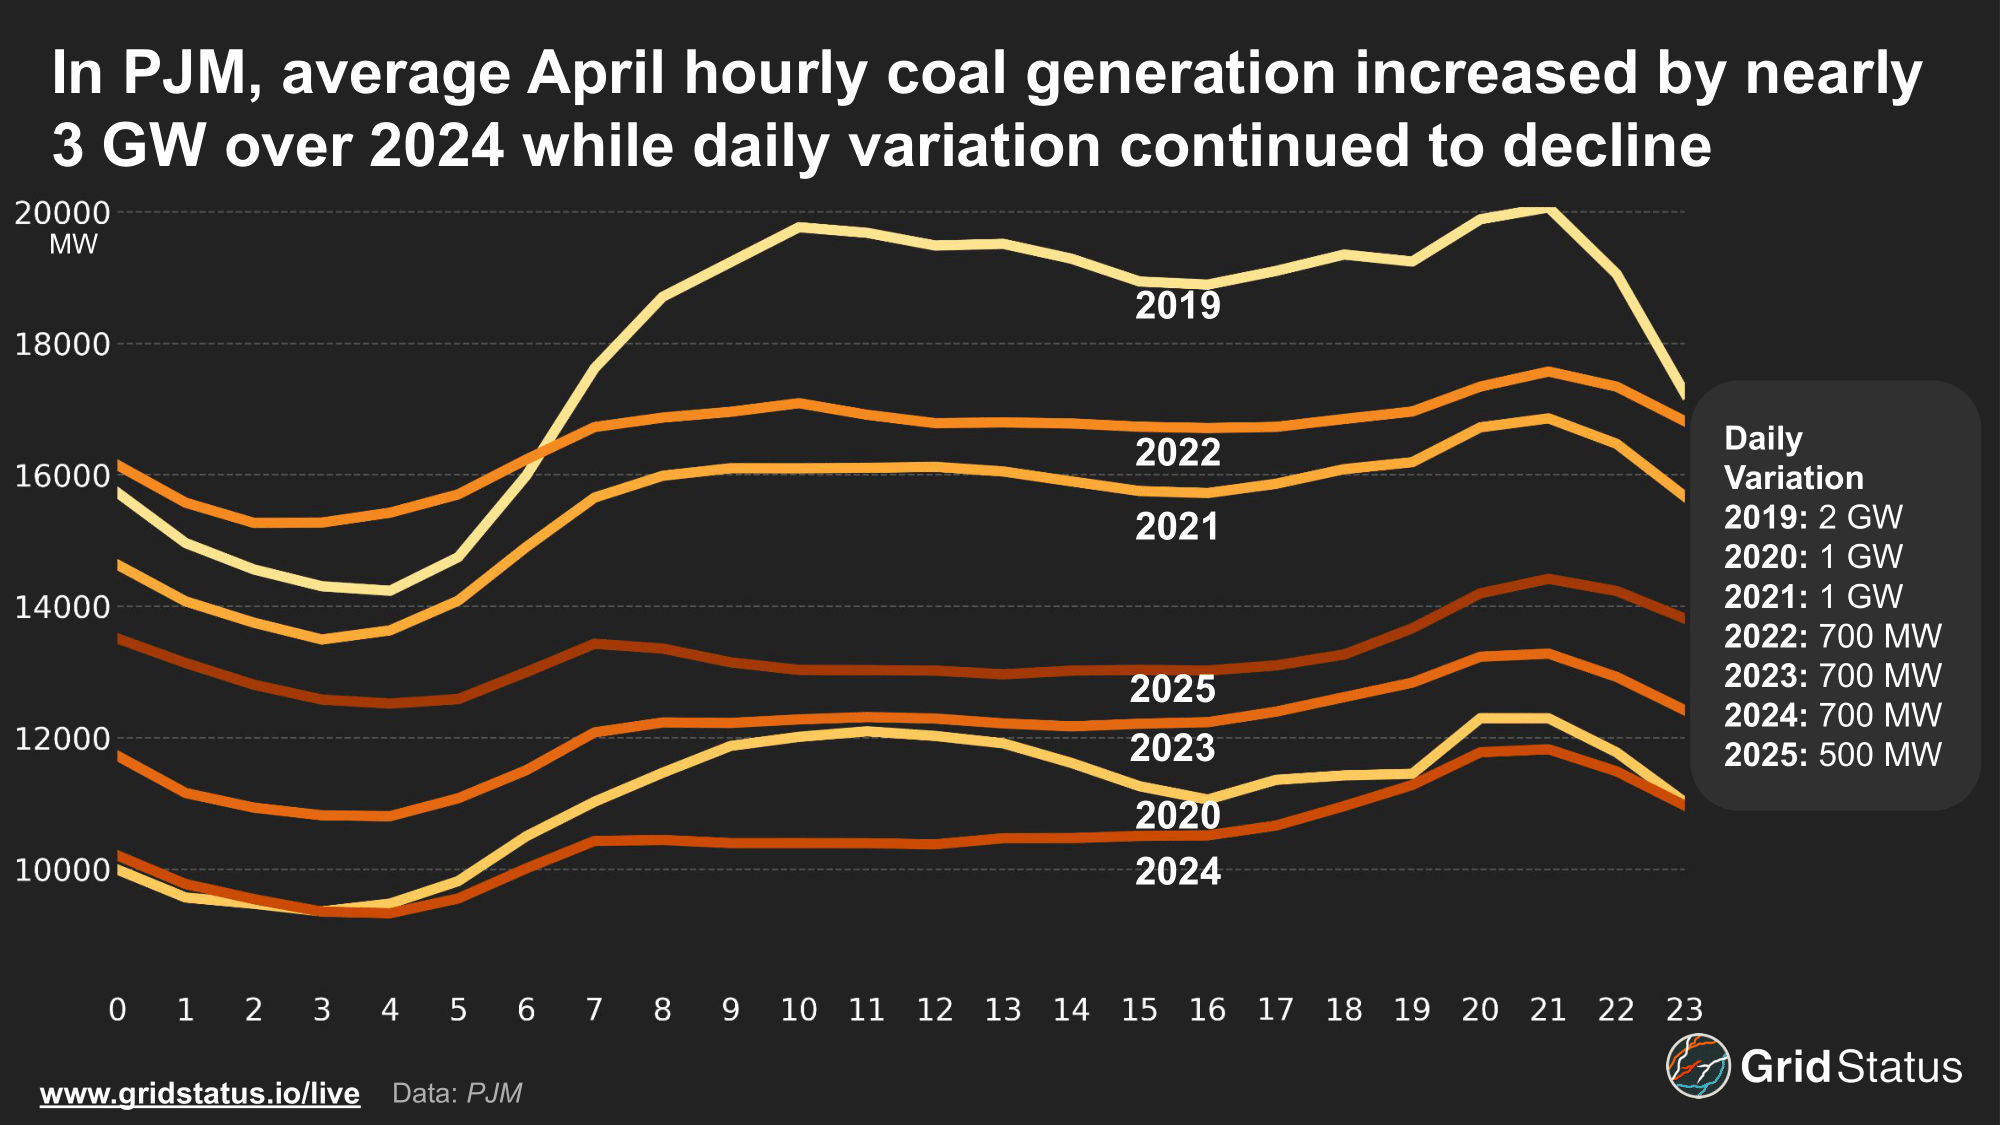
Coal in MISO exhibits significantly stronger ramping behavior than PJM. On average, April saw coal rise over 3 GW from the mid-afternoon into the evening ramp. This comes at the same time as PJM saw its flattest coal profile in recent years. One contributing factor to MISO’s stronger ramping may simply be the age of its coal fleet. Based on April’s EIA Operating Generator Inventory, the average age of an operating coal unit in PJM is 53 years, whereas MISO’s is 45.
While MISO’s units are by no means spry chickens, an 8-year-younger fleet, including multiple units from the 2000s, is likely better equipped to ramp more easily and efficiently than PJM’s aging fleet.
Increased solar generation paired with a system already defined so heavily by wind generation has resulted in much stronger ramping on the part of thermal assets.
On an (E)mission
While it may seem implausible that emissions spiked while solar generation records were shattered, that appears to have been the case in both PJM and MISO.
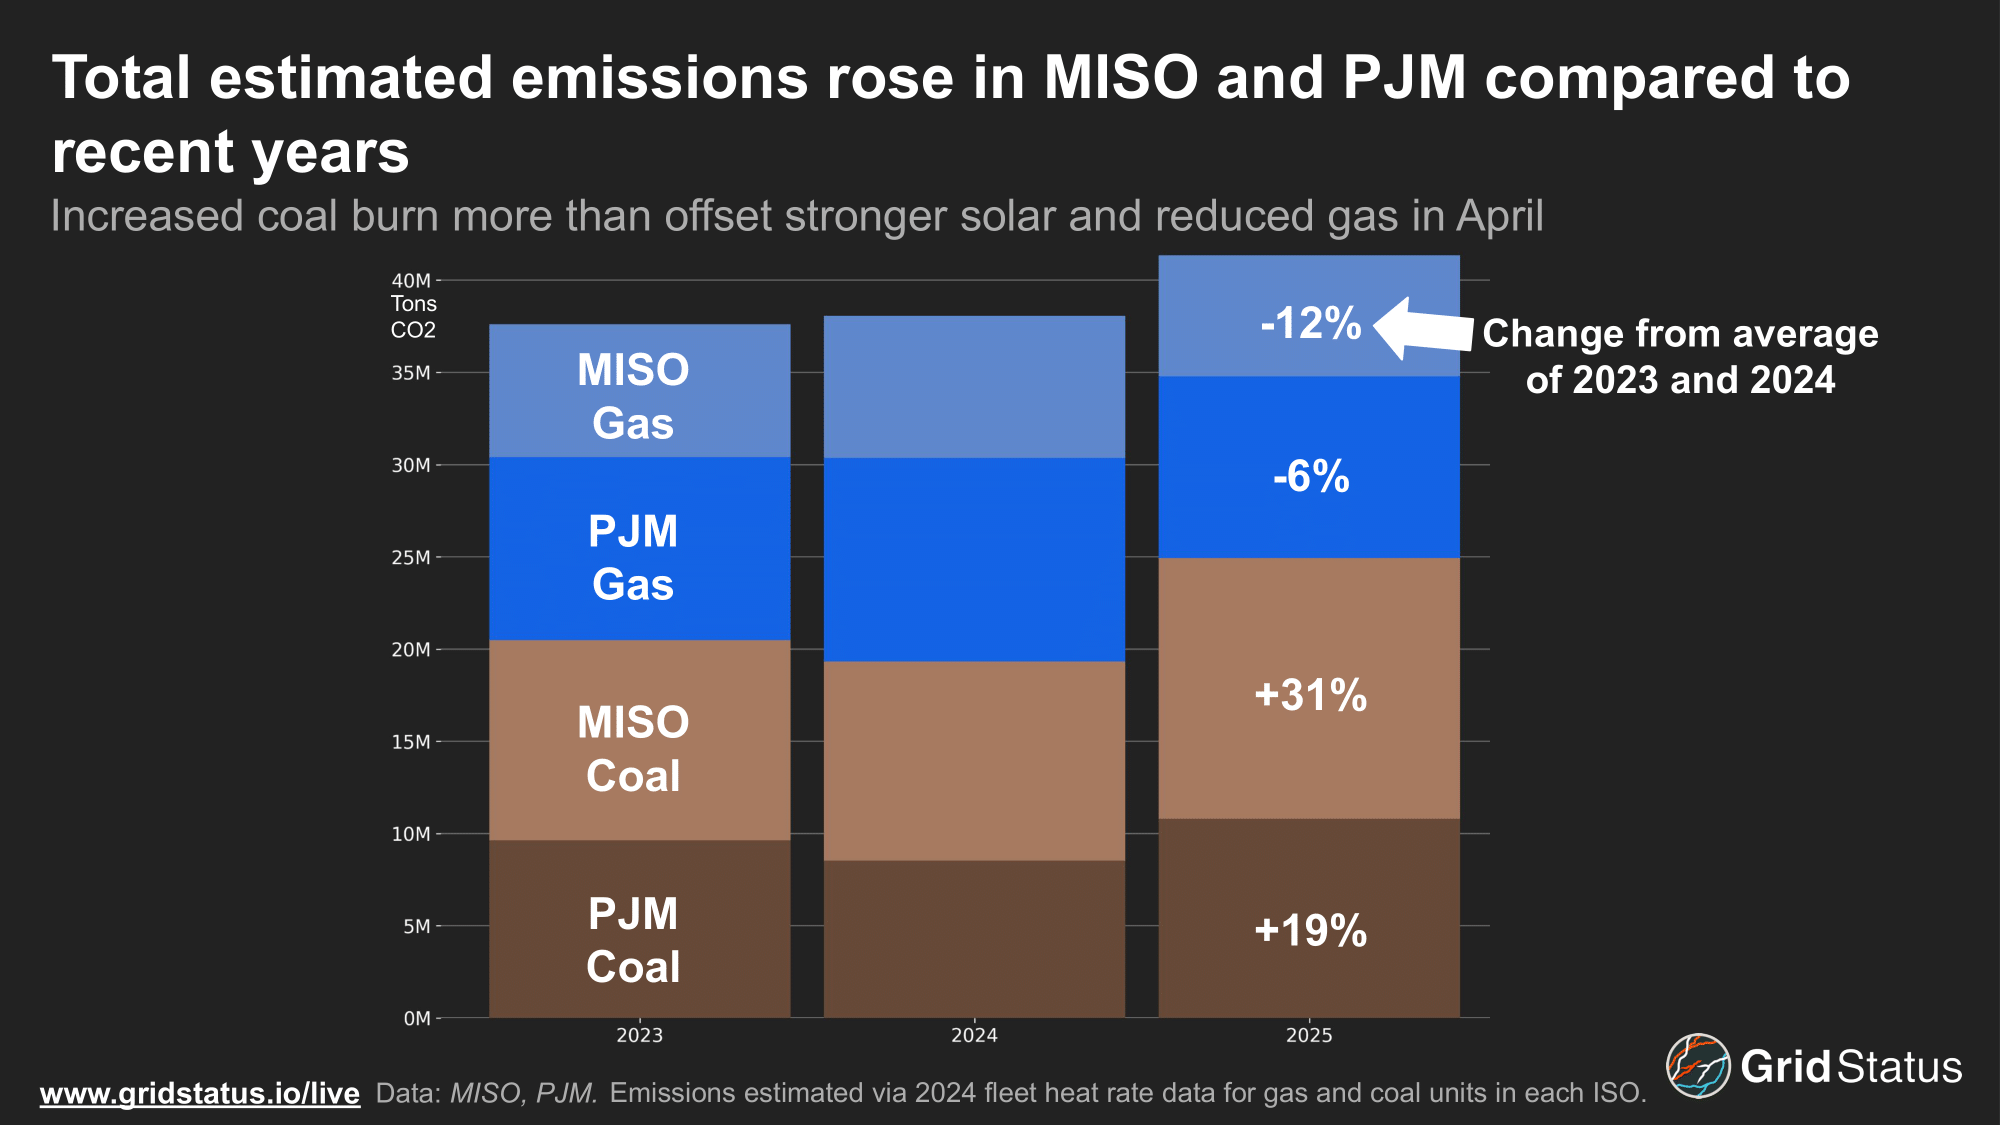
Under an influx of zero marginal cost solar generation over the midday and increasingly expensive fuel, marginal and flexible gas ramped down while baseload generators, such as more heavily polluting coal units, remained online.
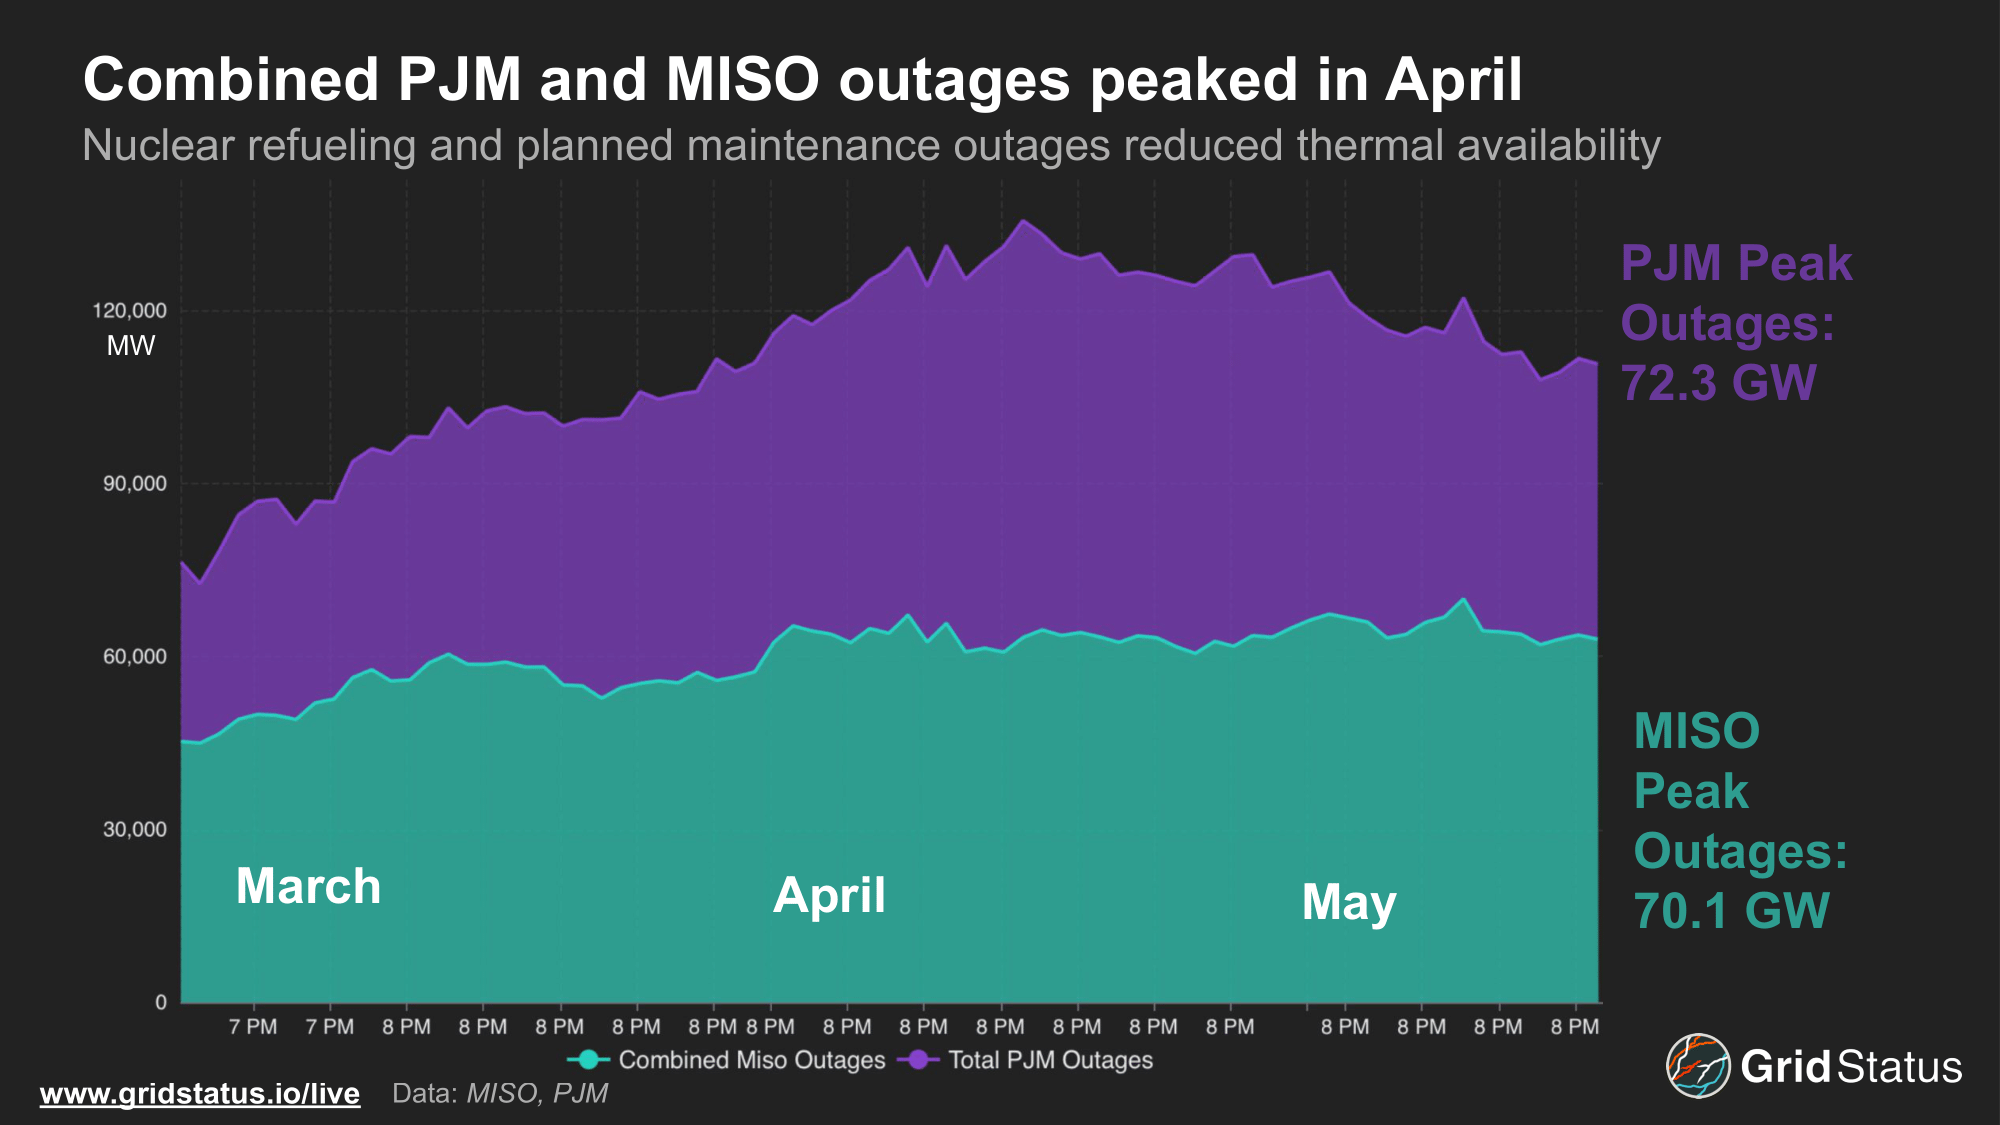
Solar and higher fuel prices weren’t the only reason for increased gas-to-coal switching this spring. Combined outages in both markets peaked in April, leaving the stack without baseload nuclear generation and likely efficient combined cycles that may have remained online even with increased midday solar output.
Conclusion
After years of planning and development, solar has finally become a notable percentage of generation across both PJM and MISO. The increase in zero marginal cost fuels has been felt by resources across the grid, driving some of the most notable changes in fossil fuel generation behavior seen since April 2022. While changes in tax credits and tariffs will add complexities for developers, growth is only expected to accelerate as increasing load and growing capacity shortfalls remain top of mind.
In an uncanny coincidence, recent solar generation records for MISO and PJM each met 18% of load. Looking to ERCOT and CAISO, markets with large amounts of both solar and storage, one might assume that PJM and MISO are hopelessly behind the eight ball. Having already had moments where solar approached 20% of load, where is the storage necessary to take advantage of higher penetrations? Perhaps surprisingly in retrospect, in both ERCOT and CAISO batteries were peaking at less than 1% of load while similar solar records were being set.
From this historical perspective, both PJM and MISO would seem to have time to bring online storage assets, but the status of the grid has changed in recent years. Linked through the hinge of Chicago, diverse geographies, and complex stakeholder processes, both markets have been forced to engage in substantial interconnection queue reform while grappling with high capacity prices amidst load growth, retirements, and regulatory changes around inverter-based resources. PJM’s battery outlook is particularly dire in the current year, although the longer-term queue is replete with projects. Meanwhile, MISO is embarking upon the most ambitious transmission expansion plans in its history, better connecting within and without its disparate members, while recent events in Louisiana demonstrate once again that reliability planning has inherent limits in the face of forced outages.
Navigating these issues in the face of a rapidly changing resource mix and the second-by-second operational changes it creates will be the defining issue of grid operators over the next decade. Fortunately, grids around the world are grappling with the same circumstances, and some have progressed their active management even beyond North America’s early movers, so lessons abound—if we’re willing to listen.