Predicting Coincident Peaks in ERCOT’s 4CP Program
Understanding the impact of large flexible loads and energy storage on peak coincident load in ERCOT’s evolving grid

Coincident peak pricing programs create a high-stakes environment for large electricity consumers. Under these programs, electricity usage during just a few peak demand periods determines a significant portion of their overall costs.
Therefore, forecasting these intervals correctly is a multi-million dollar business: a single hour of mismanaged energy use can erase an entire year's worth of cost savings. Unfortunately, as the grid has evolved, avoiding these peak demand intervals has become increasingly complex.
To illustrate this, we'll explore the 4CP program within the Electrical Reliability Council of Texas (ERCOT). By leveraging data and tools from Grid Status, we’ll show how market interactions between large flexible loads, batteries, and solar generation can lead to unexpected outcomes.
Topics in this post:
- Why Coincident Peak Pricing Programs Exist
- Changing Landscape of ERCOT’s Coincident Peaks (4CP)
- Understanding ERCOT’s 4CP calculation
- Estimating ERCOT Coincident Peak Load in Real-time
- The Dollar Value of Avoiding Coincident Peaks
- Load Growth: Move Fast and Break Things
- Solar’s Impact on 4CP Load
- Conclusion
Why Coincident Peak Pricing Programs Exist
What if you could turn down grid demand during the hottest 15 minutes, on the hottest day, in the sweltering summer months, without lifting a finger? If you’re a grid operator and tasked with ensuring reliability above all else, it would be hard to turn down the opportunity. You could avoid clunky demand response activations, complex optimizers churning out price signals, or calls for conservation, but get the same result. That is why almost everyone hits the implementation button and ends up with some form of coincident peak pricing program.
How to properly allocate costs to those using the grid is an age-old question with many (extremely) contested answers, but coincident peak programs are often one piece of the puzzle.
Understanding coincident peak pricing programs requires a specific piece of knowledge about the grid — that it’s built to serve peak demand, but ideally almost never operated at that level for any amount of time. To promote behavior that achieves this outcome, coincident peak programs can drive a substantial portion of a consumer’s ultimate costs via a demand charge based on consumption during peak demand intervals.
Many markets and utilities select these intervals from the summer months, while some regions determine monthly peaks year-round, but the results are the same — a collective desire amongst consumers of wholesale power to avoid usage during the peaks. Recently, in ERCOT, this avoidant drive ran into the brick wall of an increasingly complex market.
Changing Landscape of ERCOT’s Coincident Peaks (4CP)
ERCOT’s 4CP program is designed to manage the periods of highest electricity demand during the four summer months of June, July, August, and September. By pinpointing the peak demand interval each month, the 4CP program helps allocate capacity and transmission costs in a manner that incentivizes large consumers to reduce their electricity usage during these critical times in ERCOT.
Predicting coincident peaks in ERCOT used to be, if not easy, at least simpler. Previously, consumers could look at the weather forecast and day-ahead market outputs to get a pretty good idea of the potential for a peak interval, but now there are more factors to consider.
In a market rapidly evolving on both the supply and demand sides, the interaction between new products and participants with established ones can lead to counterintuitive outcomes, which we will explore below.
Understanding ERCOT’s 4CP calculation
Forecasting these peak demand intervals correctly has a lot of value. Those with exposure to the resulting demand charges know very keenly just how expensive it can be to gamble on not being prepared. Anyone who listened in on the Demand Side Working Group meeting on July 22nd heard a lot of folks who woke up in mid-July surprised to find that they had, in fact, been at the casino.
Many market participants thought that the June coincident peak had been at 17:00 on the 27th (which is when the load peak occurred based on operational data provided on ERCOT’s website), but that was not the case.
Why did they get it wrong? There were two major points of contention on that call:
- Many were unaware about the treatment of wholesale storage load (WSL). WSL is not like other loads, and for years ERCOT’s procedure has been to subtract it from the load values to reach the 4CP load value. In 2024, there is a lot more storage load than there used to be, and in this case it swung the peak interval.
- A lack of clarity from ERCOT how to track potential peak intervals in real-time. ERCOT calculates the final value using “settlement” data that is only known after the current 4CP month. However, at the moment participants are making curtailment decisions, they only have access to operational-level data. How do operational vs settlement datasets compare? Neither ERCOT nor market participants knew.
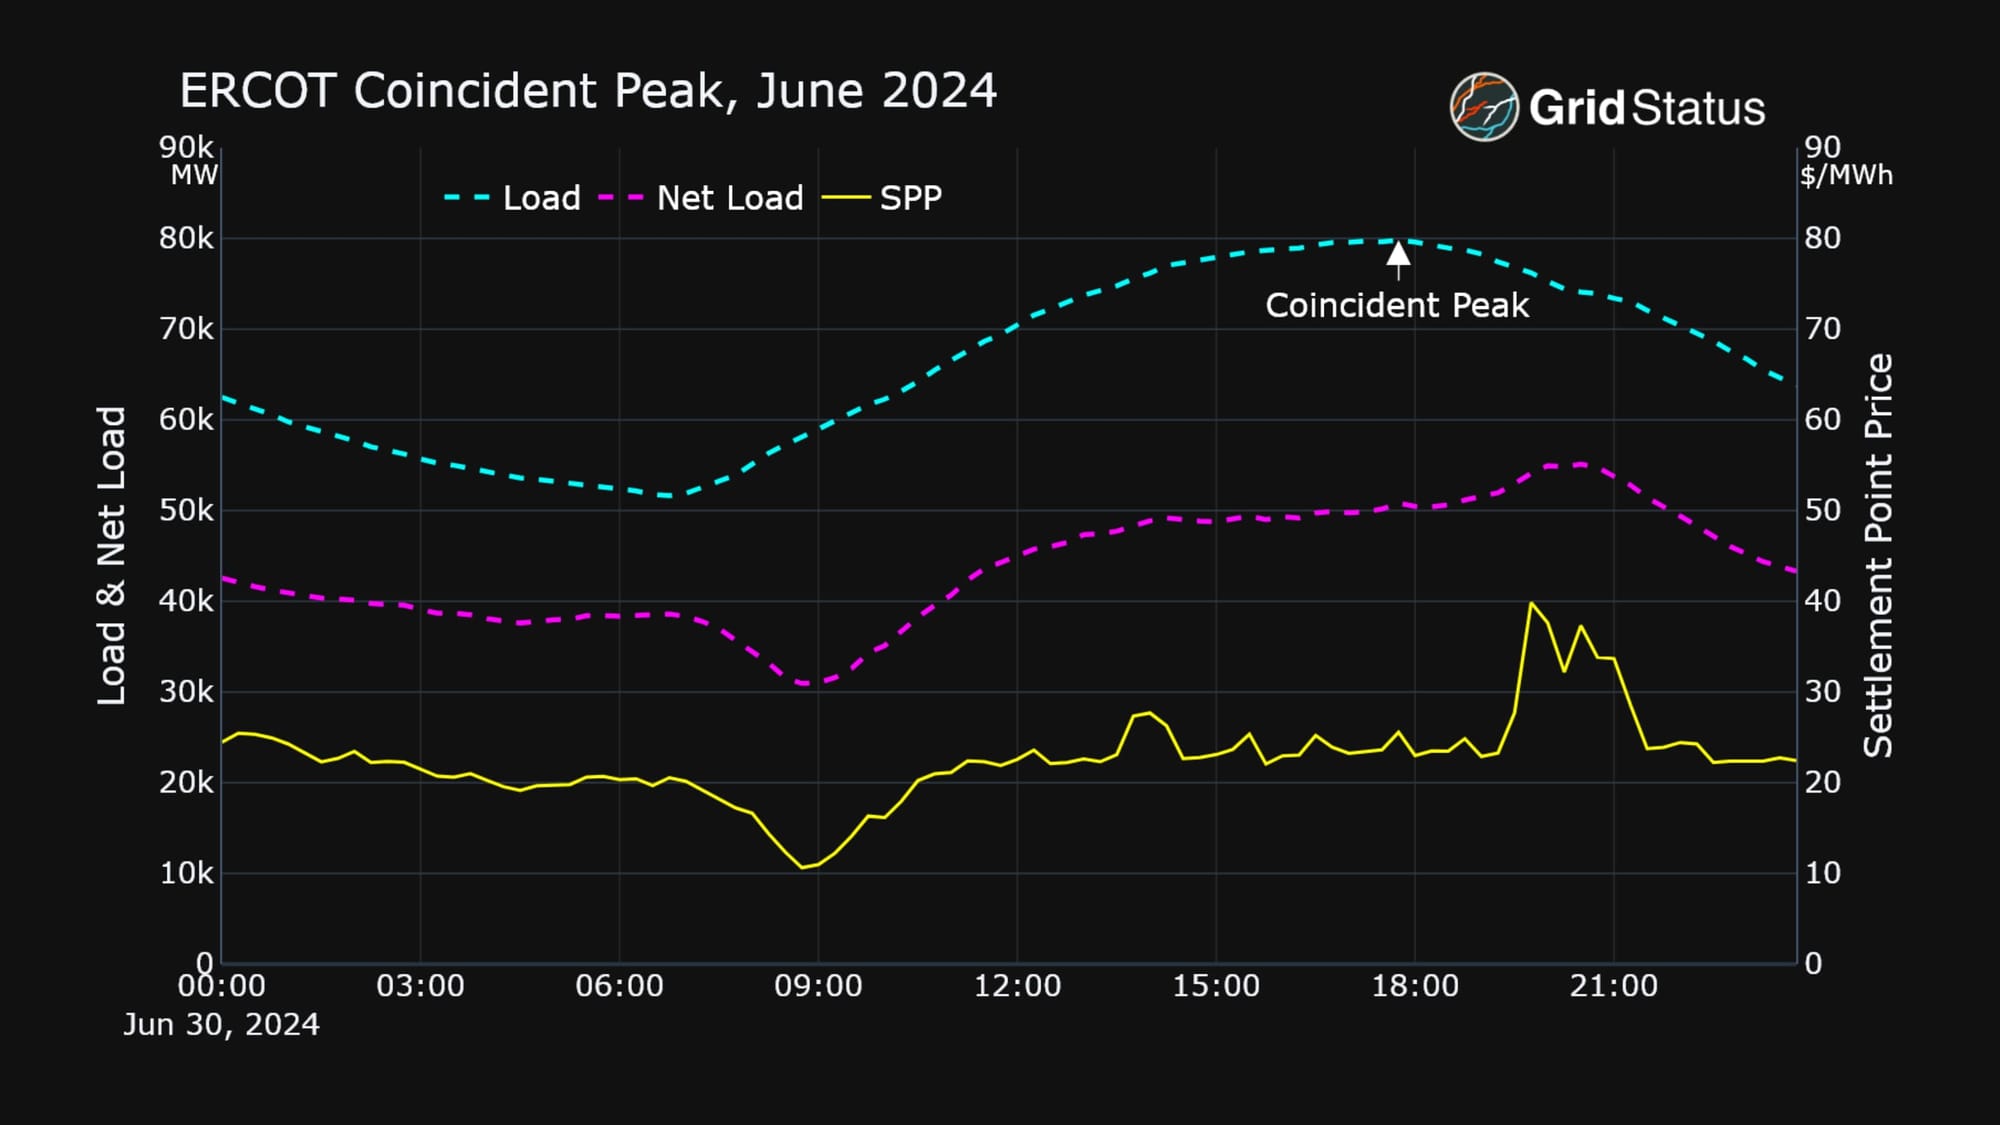
When did the actual 4CP interval occur in June? On June 30th at 17:45. Interestingly, this was a Sunday, not normally a day associated with peak load on the grid.
Estimating ERCOT Coincident Peak Load in Real-time
Even if ERCOT doesn’t report a coincident peak load in real-time, it can be estimated based on the definition set by ERCOT rules and the operational dataset they do publish.
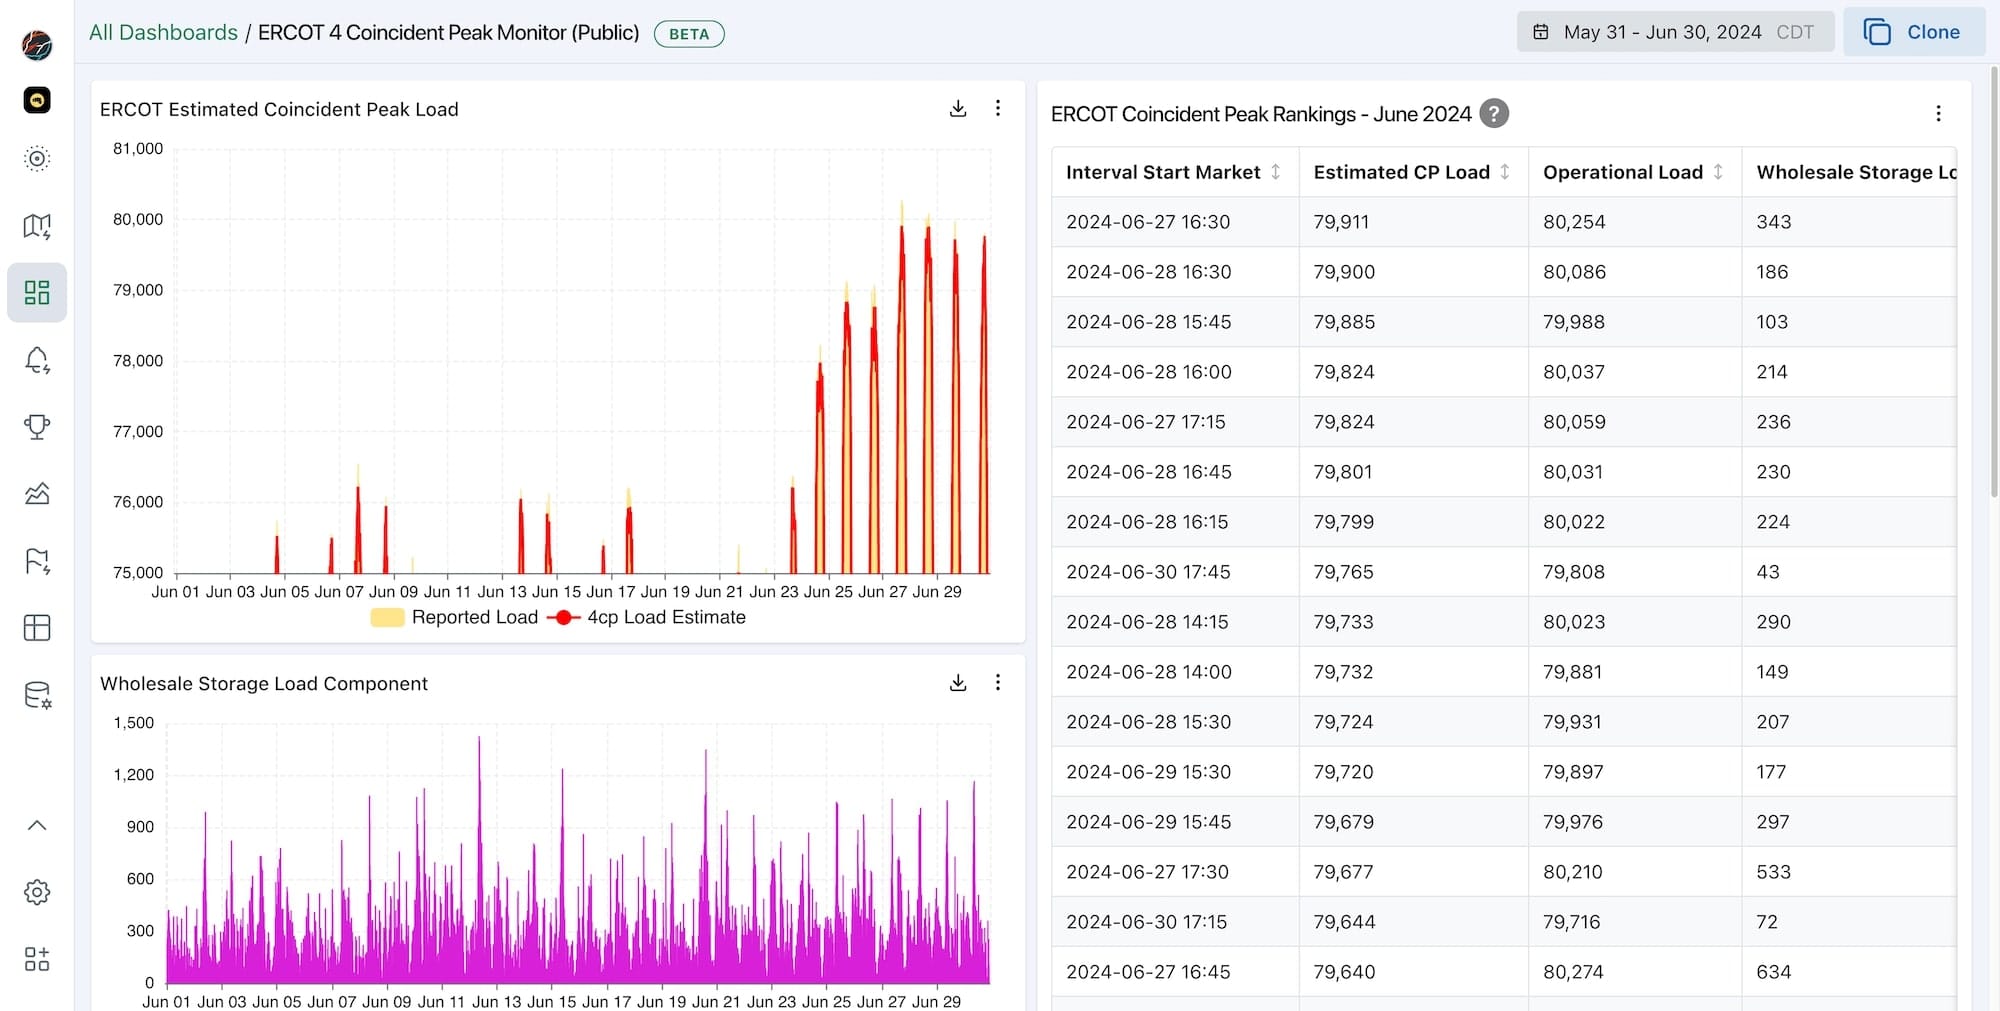
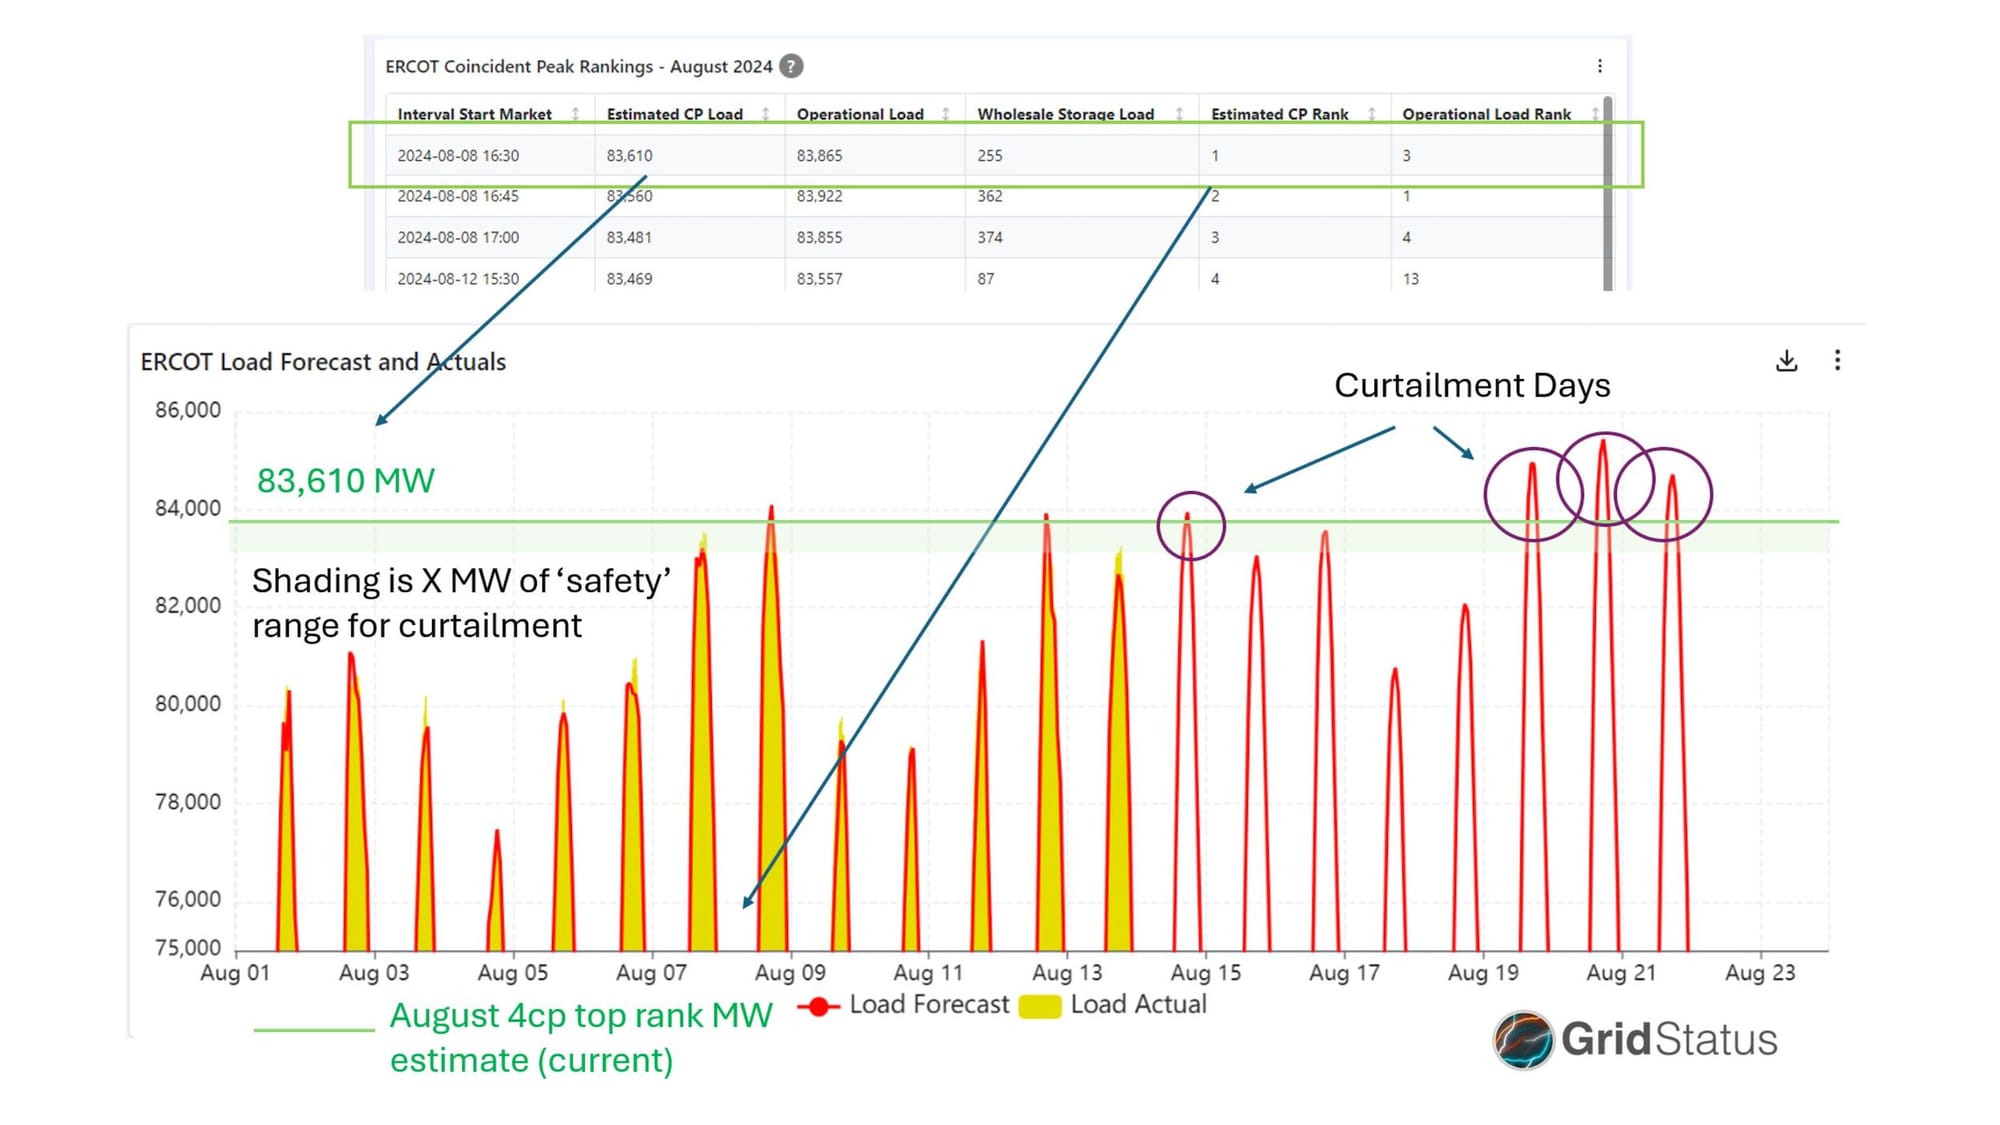
We’ve done just that at Grid Status, and added an “Estimated CP load” to our product. Because our estimate is based on operational data, we can calculate it in real-time every 15 minutes, as well as track it throughout the month, well before ERCOT publishes the official numbers based on settlement data.
Let’s look at the Grid Status Estimates using June data
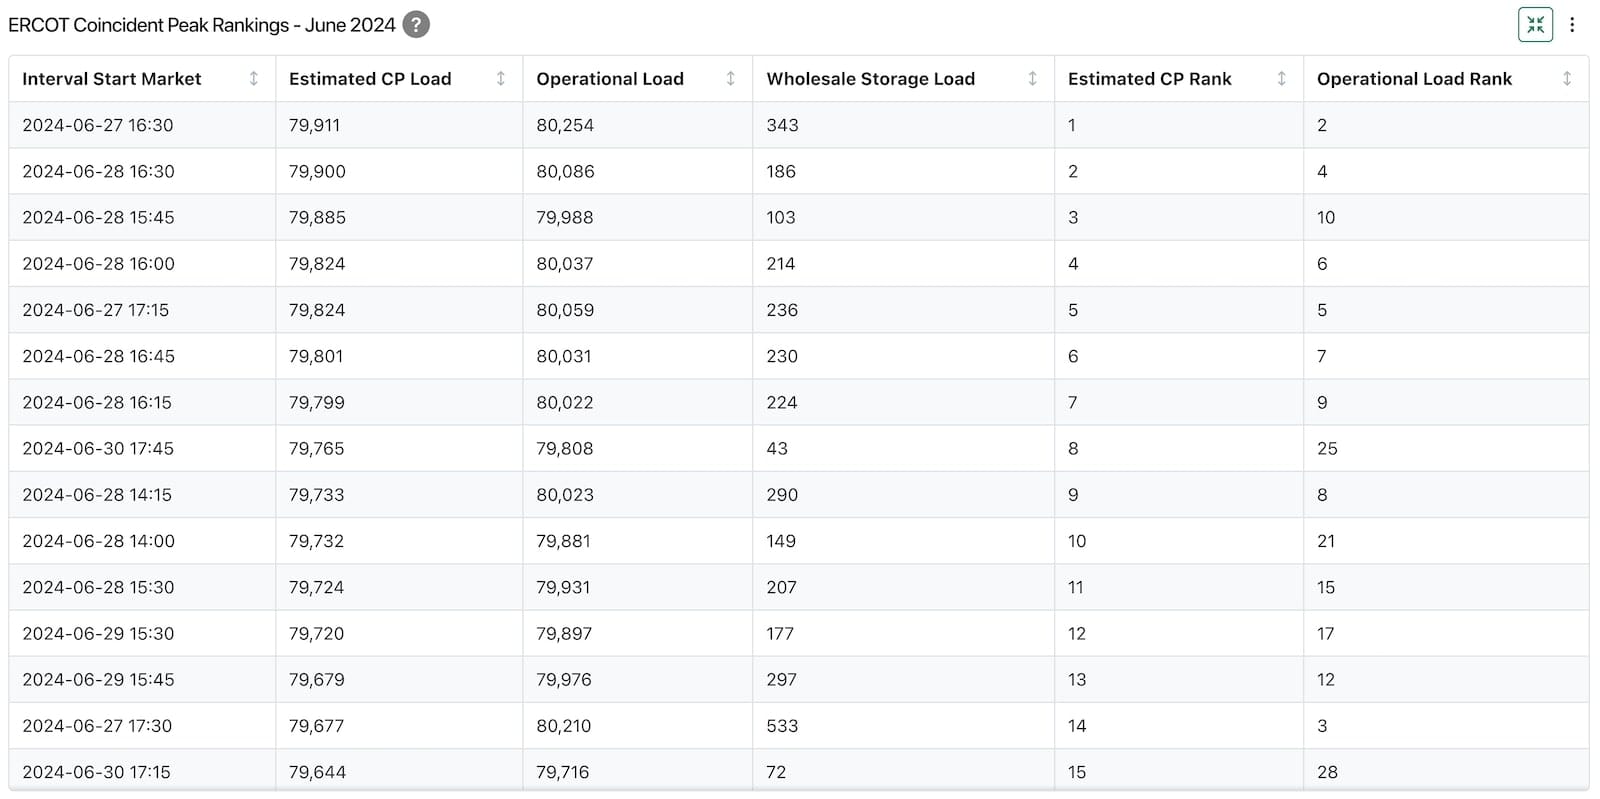
While the actual coincident peak isn’t #1 due to the use of operational data and incomplete information from ERCOT, its relative rise in the rankings demonstrates how consumers can be much more accurate in choosing when to curtail. A curated feed of coincident peak related operational data can help large loads reduce the cost over curtailment.
In order to capture the actual interval by tracking operational load alone, a market participant would have had to spend more than triple the time curtailed compared to our estimated ranking.
The Dollar Value of Avoiding Coincident Peaks
Let’s put this consternation from large consumers of electricity in dollar terms.
In 2023, the 4CP charge came out to around $67/kW, or $67,000/MW. Next, let’s consider the 4 coincident peaks together, i.e., 1 hour to curtail, or in this example, 1 MWh. If the cost to curtail is high, a load can only afford so many hours offline. If the cost to curtail is low, a load should curtail very often ensure they avoid the coincident peaks.
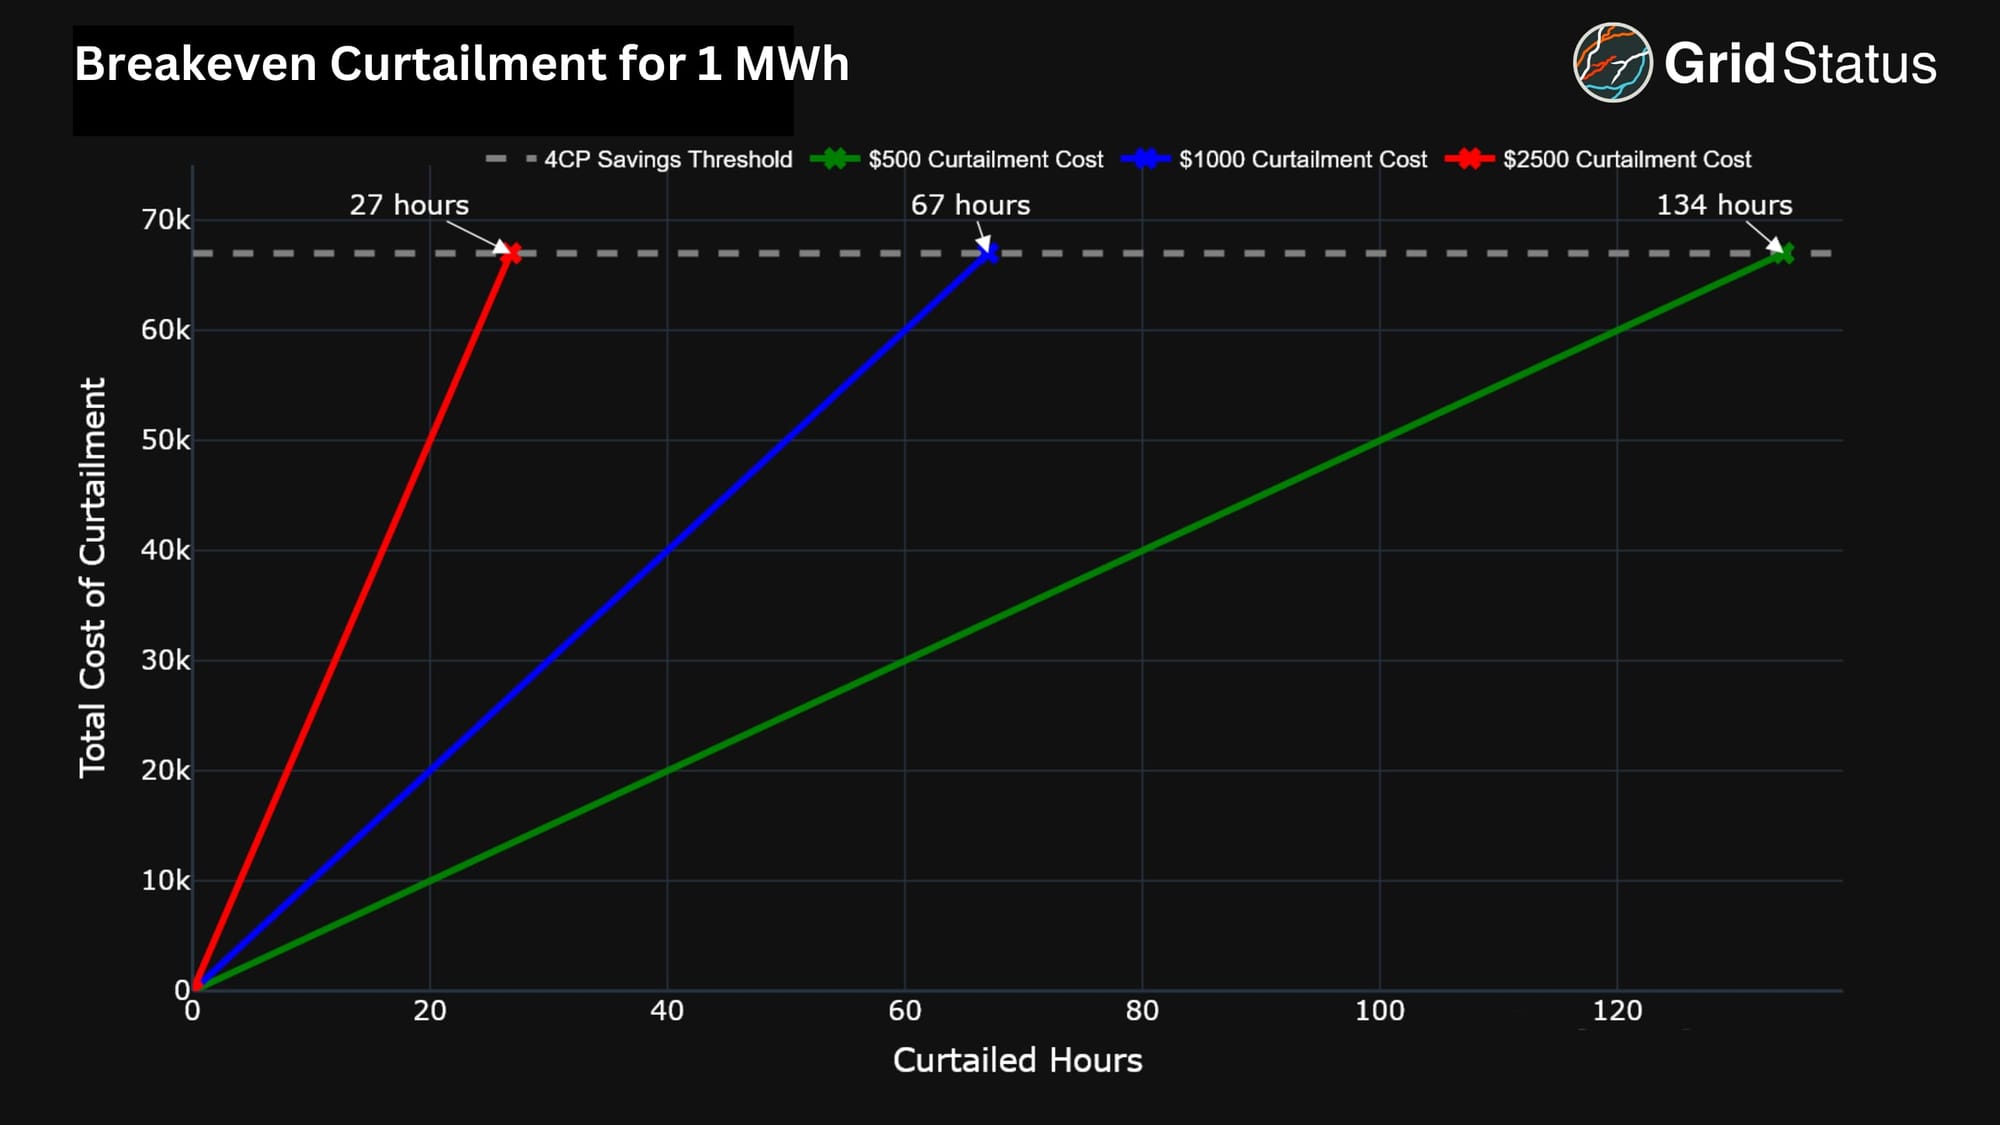
If you use the breakeven cost ERCOT provides for bitcoin mining in the background tab of its Monthly Outlook for Resource Adequacy (MORA) the stated price is $72/MWh. It would take more than 930 hours of incorrect curtailment before more dollars had been lost than reducing that 1 MWh correctly. If this value was accurate, it implies that a resource could justify shaving up to 7 hours a day, every day, for the entire summer, as long as they avoid 100% of the 4CP intervals.
With 60-day SCED data we can put this in real-world numbers. To start, we queried for the loads with the highest median demand over the course of 2023’s summer months. For the top 5 we’ve plotted their potential 4CP charges at various curtailment levels.
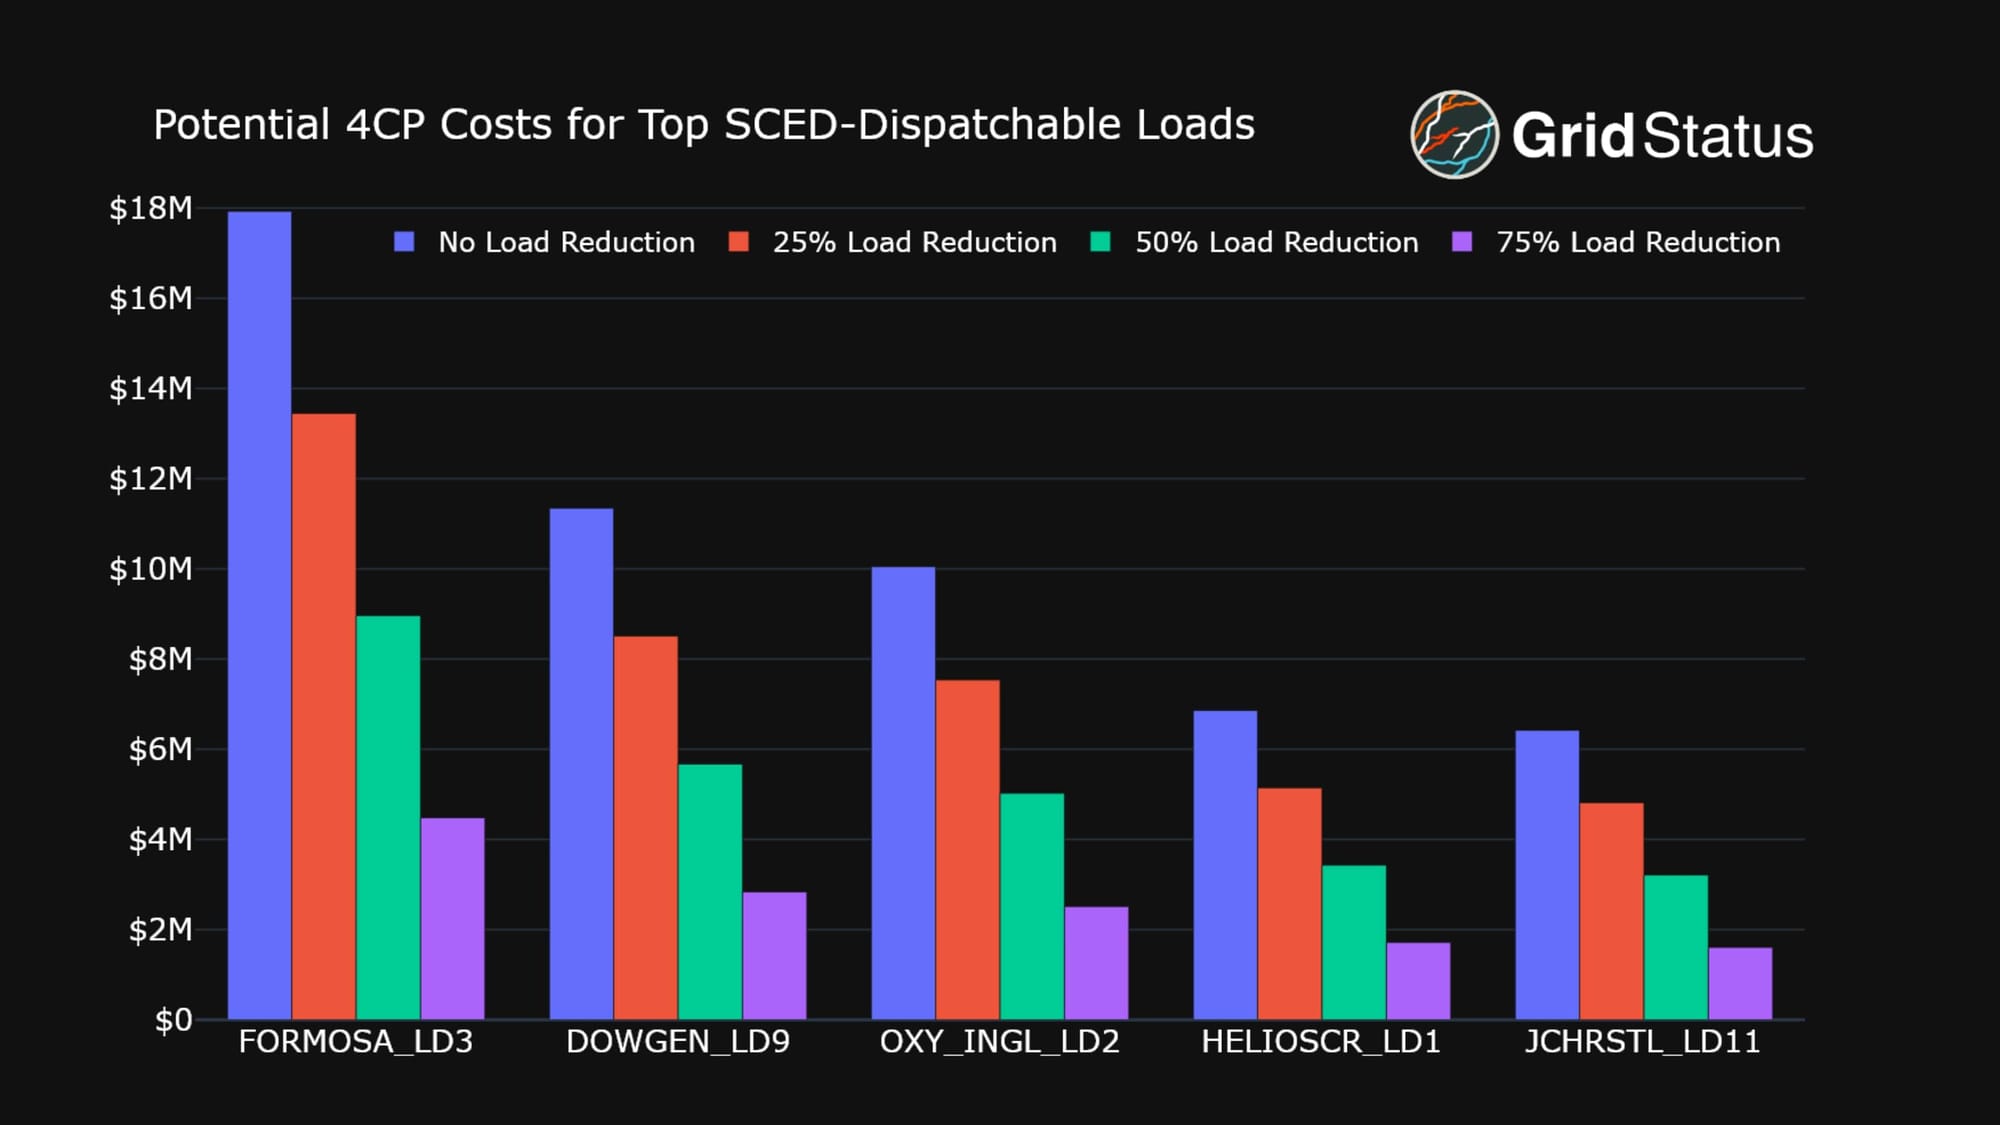
Note: These are just the loads in the 60-Day SCED data, there are a number of much larger consumers in the ERCOT ecosystem.
In a vacuum, the largest load in the above chart, FORMOSA_LD3, could save upwards of $13M by reducing their median demand by 75% across the single hour in question.
So it can be really expensive to get this wrong, and a big piece of the recent miss was storage load, but shouldn’t prices be high at peak load? And why would storage be charging into high prices? We have some prospective answers to those questions, but first, there’s still one more important player to introduce: Large Flexible Loads.
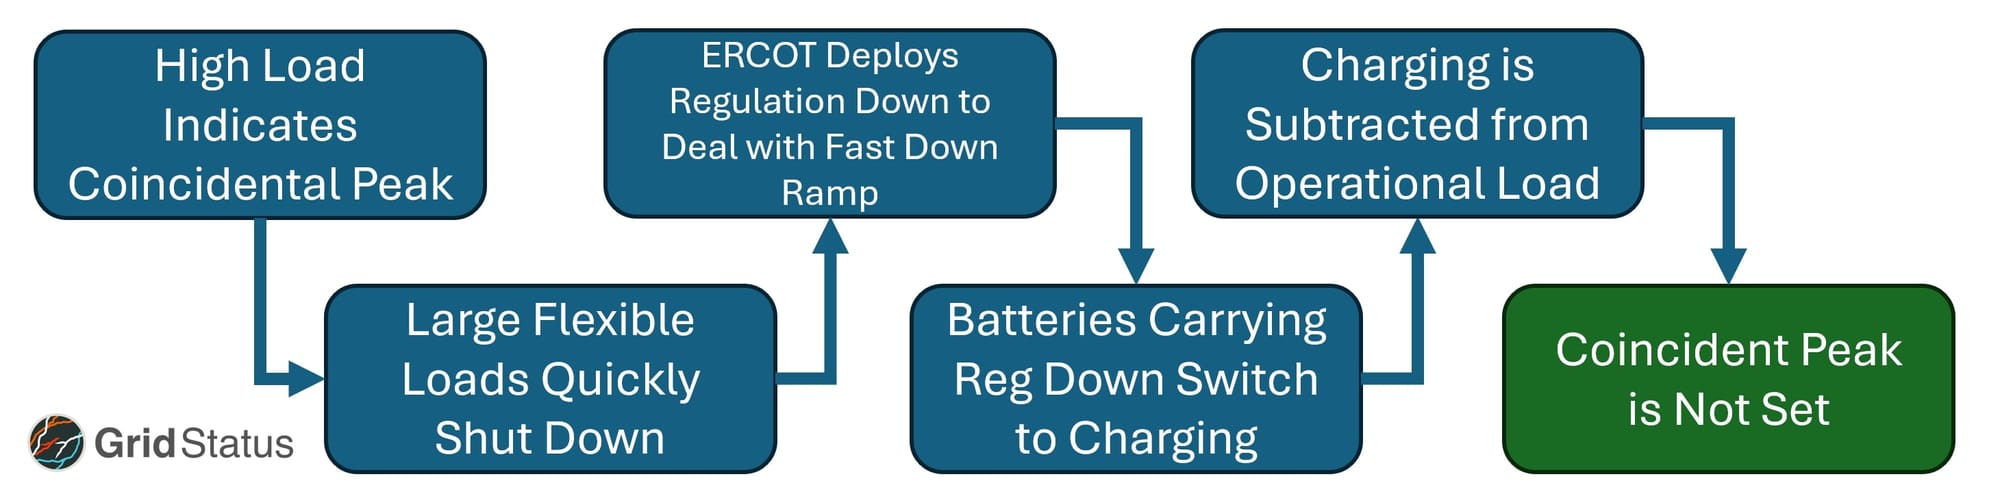
Load Growth: Move Fast and Break Things
New load growth in ERCOT is a few things: industry along the coast, oil and gas out west, population everywhere, and then crypto mining and data centers. The first three categories have well-understood patterns of consumption and capabilities to curtail, the final pairing represents a new paradigm.
Both can consume a shockingly large amount of power in a relatively small area, and some can be extremely flexible in that consumption - closer to a battery than even a gas plant. Bitcoin mining operations in particular have well-defined financial breakpoints such that you can identify with reasonable confidence where they should curtail with respect to wholesale power prices. Their rapid growth and differentiating characteristics were significant motivators for ERCOT to create a new category of interconnections to track and manage, Large Flexible Loads (LFLs).
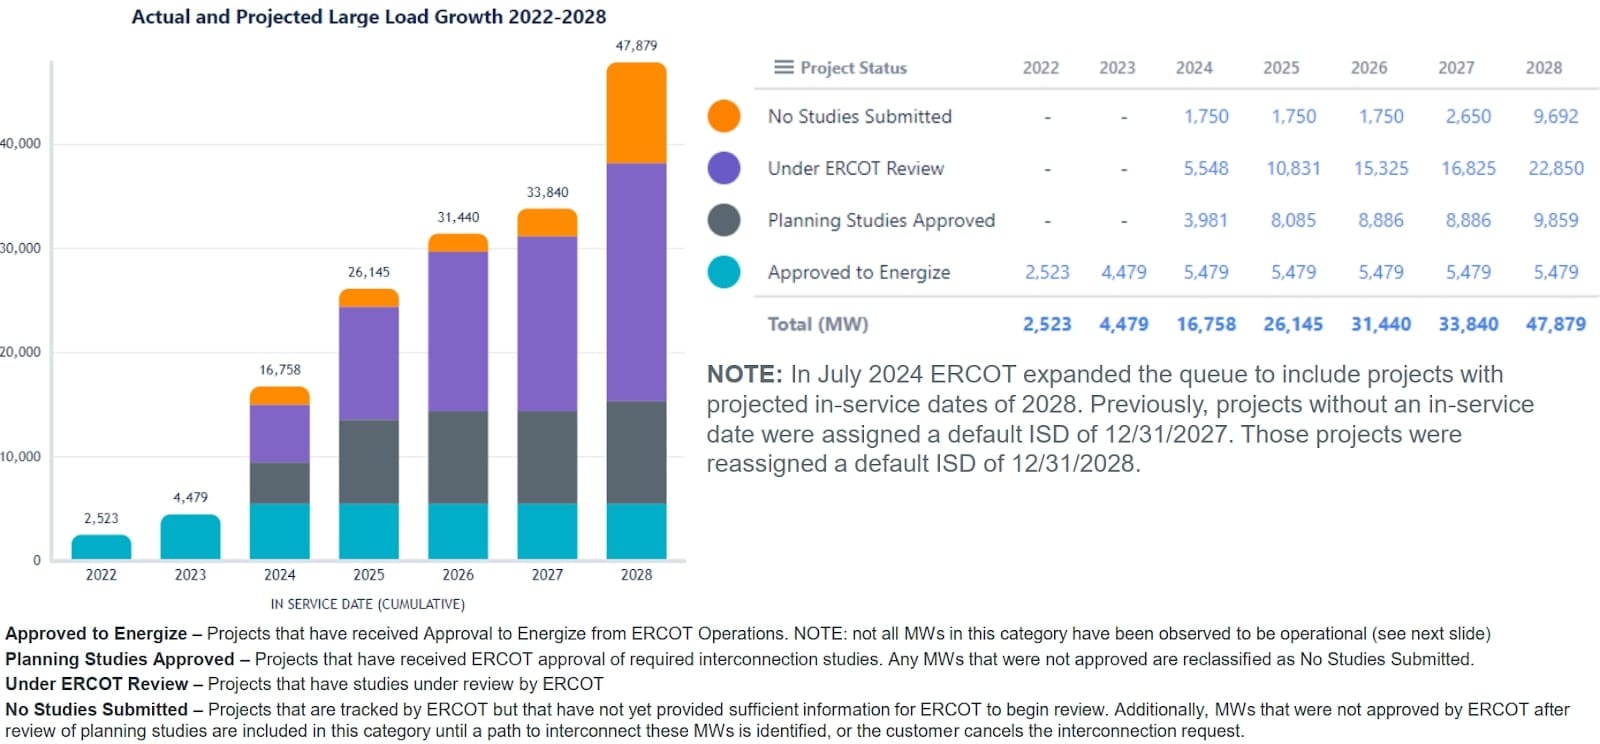
This forecast shows that LFLs may increase by at least 20 GWs in the next 3-5 years in ERCOT.
The flexibility of some LFLs means that they can curtail very quickly and return to full consumption just as rapidly.
The size of each installation and the number waiting to interconnect mean they represent a surprisingly large (and growing) amount of MWs. When LFLs suspect a series of intervals may be the coincident peak, they’ll curtail. That curtailment is fast. Fast enough that ERCOT is forced to deploy the regulation down ancillary service. Let’s take a look at the breakdown of that product between generation and load resources over the last ~5 years.
What is regulation down?
Regulation Down is one half of the regulation ancillary service which is designed to maintain the balance between generation and load on the power grid over short (5m-10m) timescales.
When the demand for electricity decreases (load ramping down), regulation down can either involve reducing the output of generation units or (recently) increasing the load by charging batteries providing this service. This dual approach ensures that any surplus electricity is absorbed, maintaining grid stability. Regulation up is the reverse - resources which have the ability to quickly respond when demand relative to supply increases.
The service is essential for quickly and efficiently balancing minute-to-minute fluctuations in demand and generation, preventing under and oversupply that could destabilize the grid.
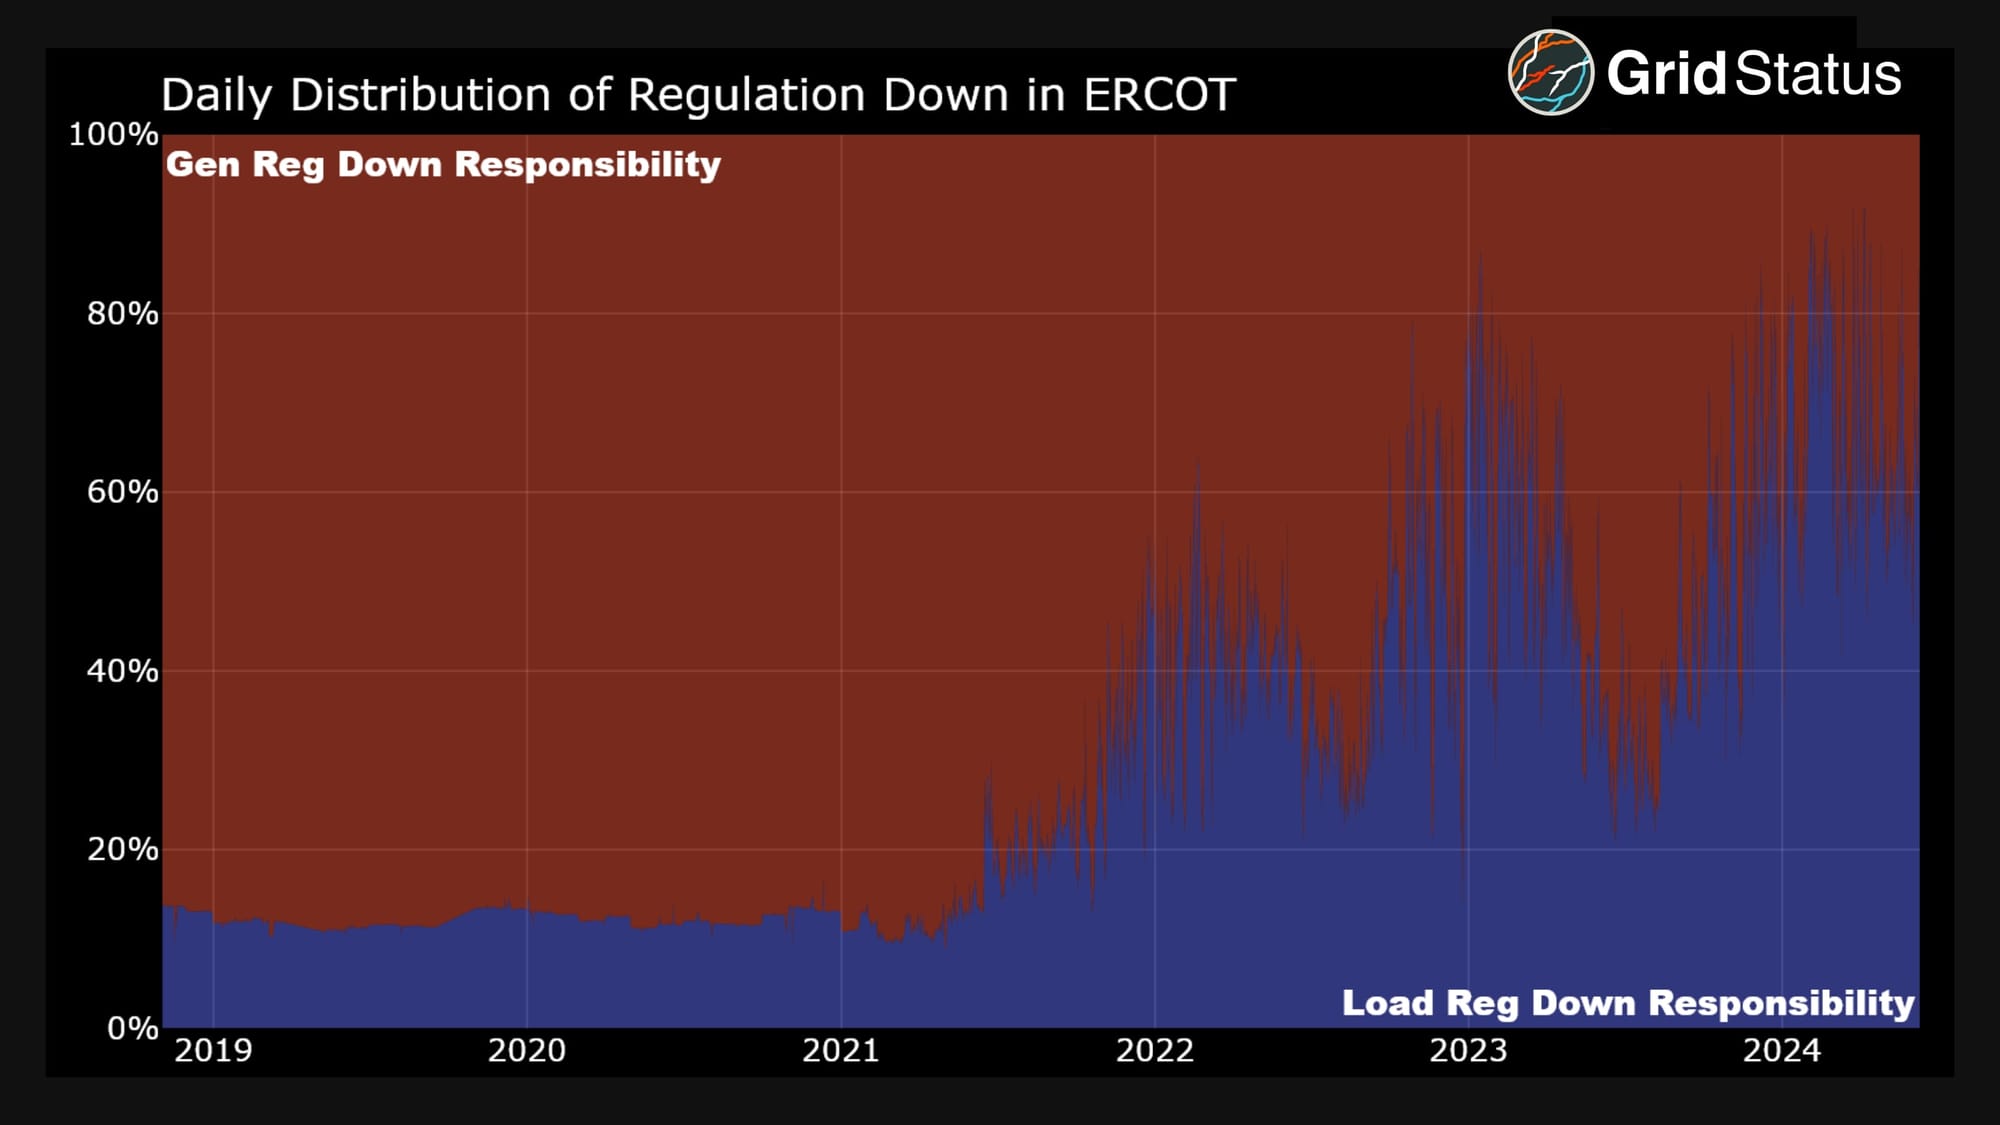
Two major changes have occurred, beginning in mid-2021 and then accelerating into 2022: an increase in participation from load resources, and a similarly drastic increase in the volatility of that proportion. This is where larger aggregate numbers fail. It might be interesting to see that load carried a significant amount of reg down in June 2023, but with each individual day varying by dozens of percentage points in terms of coverage by loads you learn very little.
Batteries are a considerable part of the load resources selling reg down, and when a battery is deployed for reg down, they charge. When batteries charge, they’re wholesale storage load, the key component that threw people off of the correct coincident peak interval this past June.
This is just one of the scenarios that are now critical to understand when trying to avoid coincident peaks in ERCOT. The interrelated market elements that have an impact on coincident peaks in 2024 and beyond are substantial. Let’s take a look at the June miss and the contributions made by a surprise player, solar.
Solar’s Impact on 4CP Load
Traditionally, high load meant high prices. In the summer, this correlated strongly with the highest temperatures, let’s say 5-7PM, the hours leading into sunset and relief from a merciless sun.
Now, Texas has turned the same sun towards industry. Peaking above 15 GWs on most days and flirting with 20+ GWs regularly, the growth of solar generation in ERCOT has already dramatically altered the tenor of the summer market. The sun’s still shining during traditional peak load periods, which can substantially reduce the typical system prices when congestion isn’t an issue. The growing operational challenge is net load peaks and the associated ramps on either side, which we wrote about here.
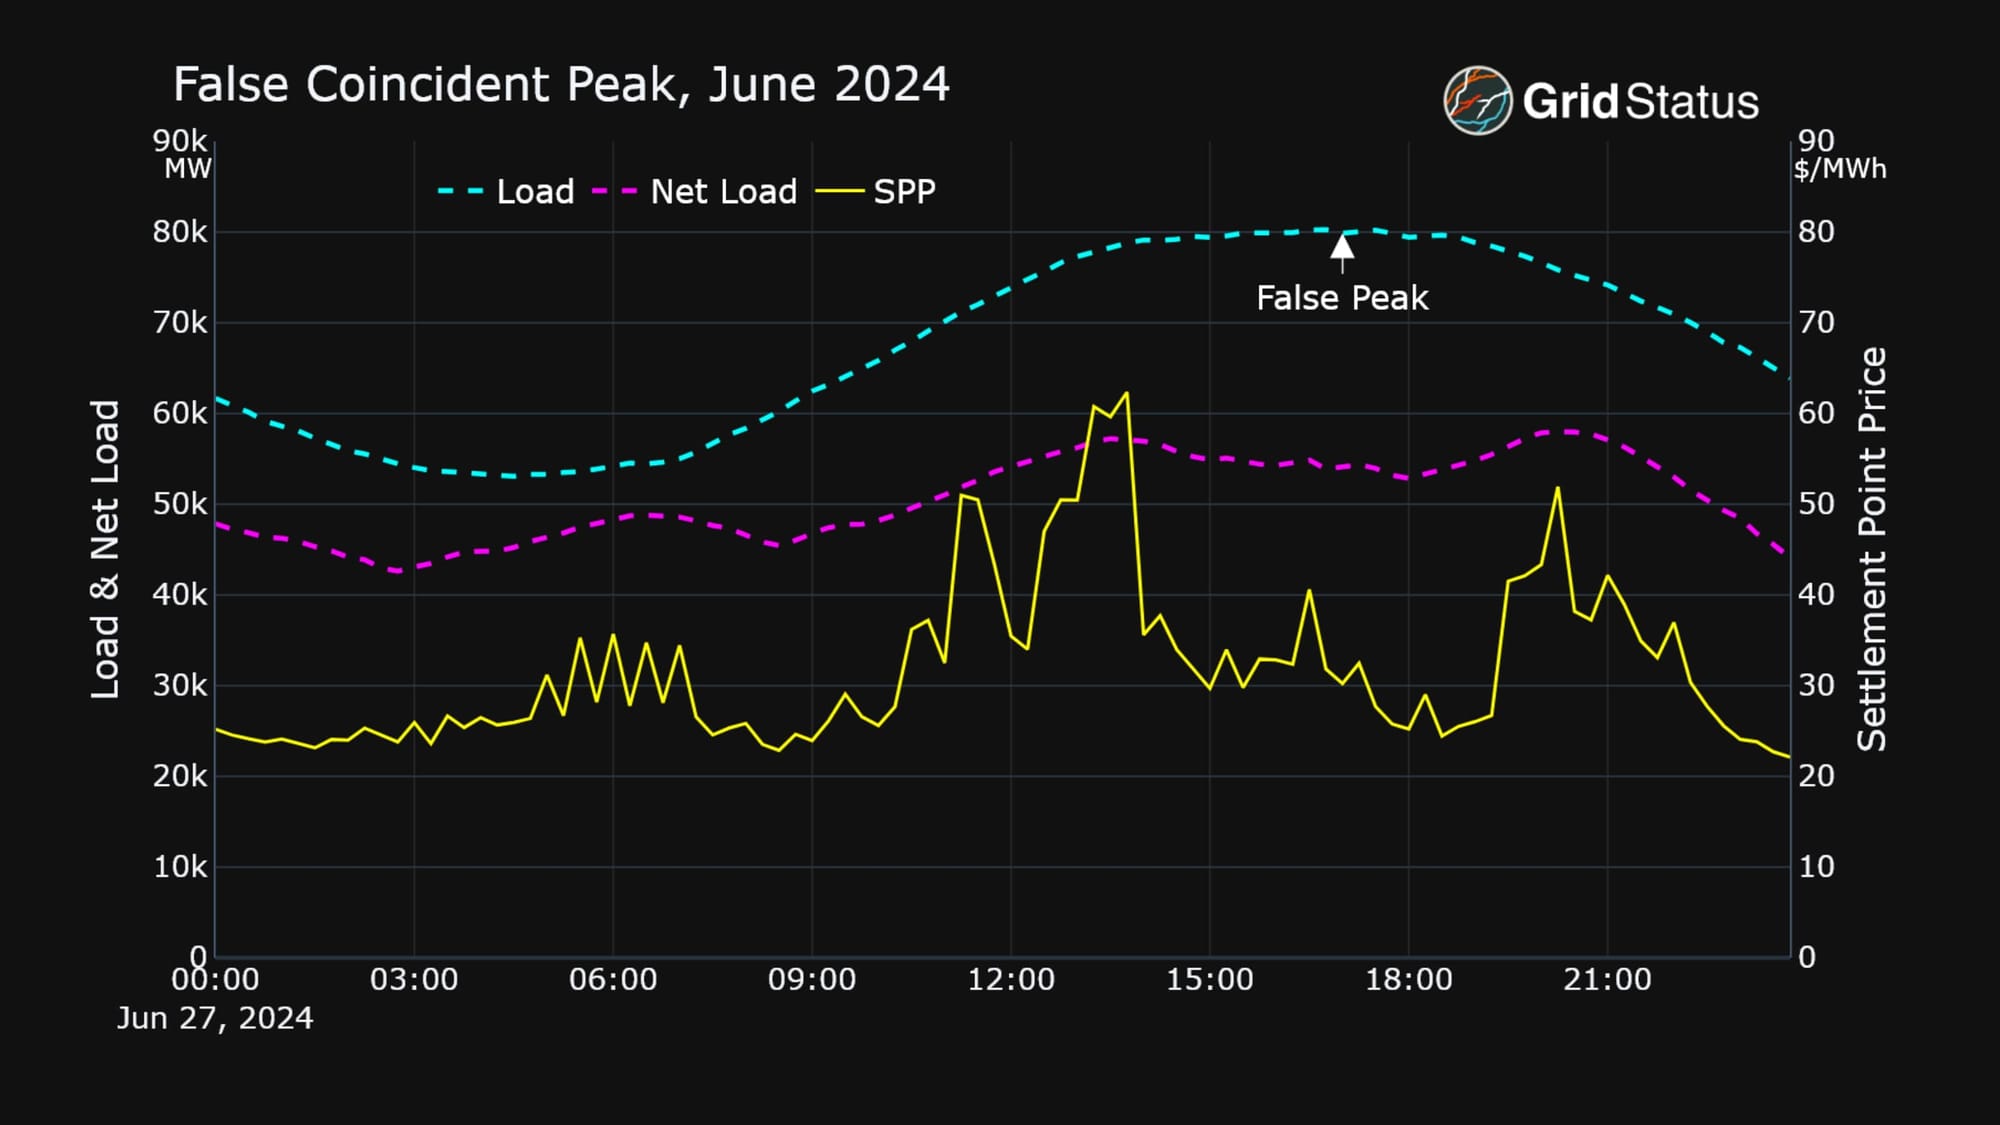
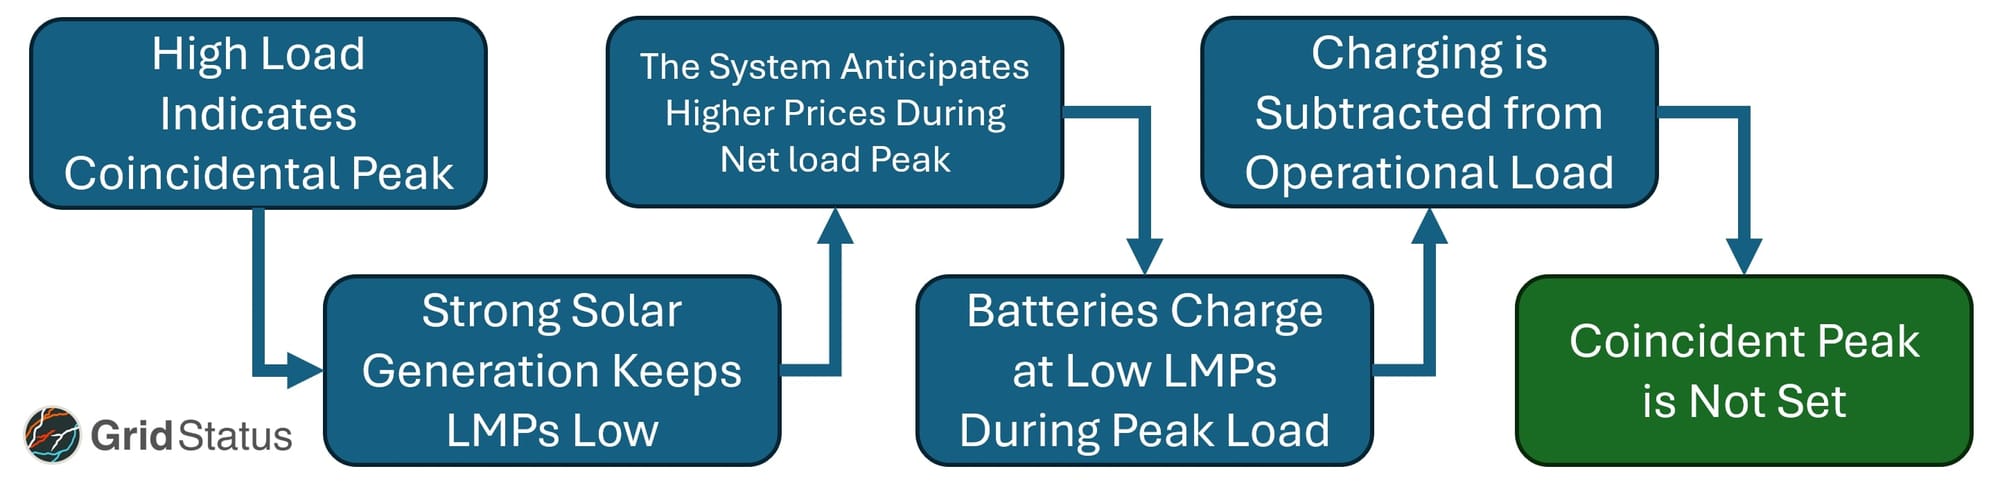
With respect to coincident peaks, we turn once again to the interaction of energy storage with solar. Because solar substantially lowers prices during peak load and contributes to more volatile hours later in the evening when net load ramps are largest, solar can create opportunities for batteries to charge at unexpected times, such as during peak load.
On June 27th, the contentious false peak, batteries did just that. On net they charged throughout peak load to take advantage of low prices before discharging during the net load ramps as solar ramped down.
Conversely, when the true peak occurred on the following Sunday (June 30th), prices were low, but the mild volatility and early-evening pricing trough isn’t present.
Relying on rules of thumb which have stood the test of years is no longer feasible when new resources can operate in unintuitive ways.
As a bonus, solar production in ERCOT has also changed the operation of the market’s DC ties. Previously these tended to be net importers during peak load hours, but the new summer sun regime has led to a flip towards exports during a surprising number of peak load hours. DC ties flows are another element ERCOT considers in the settlement calculations to determine a coincident peak, so tracking their disposition can also be important.
So what do you do when the old signal becomes messy and your intuition needs an update?
Conclusion
We believe that one of the key ways to avoid being caught off guard by shifts in the market is reliable access to high-quality data. Regular review of new trends and outcomes is critical to recalibrate to a new paradigm in any market.
Hopefully, this brief tour through changing paradigms in the ERCOT market was eye opening. Even long-standing and well understood programs like 4CP can have surprising outcomes as the market continues to evolve, and with so many dollars on the line, it’s critical to hit the right outcome.
As other markets in the US go through similar resource mix transformations they will experience new outcomes derived from their own milieu of rules, products, and participants. Our goal is to be there, providing data and insights to keep Grid Status users and customers informed and successful.
To that end, we’re launching a new estimated 4CP data feed along with a monitoring dashboard. Both products are focused on the use of operational data to more closely track the potential for a coincidental peak in ERCOT, you can reach out at contact@gridstatus.io to schedule a demo.