RTC+B, 60 Days Later in ERCOT
60 days on from the implementation of RTC+B we have data on the offers and outcomes shaping ERCOT's markets. Plus, a big reporting change that flew under the radar for some.

RTC+B was implemented on December 5th, 2025. A nearly decade-long effort, with roots in ERCOT’s original nodal proceedings, its implementation was one of the largest market design changes in ERCOT’s history. Despite its long gestation, many market participants weren’t entirely sure what to expect. This anxiety led to a mild run-up of prices in ancillary services in the day-ahead market leading into go-live on December 5th, 2025, but smooth sailing during the real-time market. In fact, the great sea ERCOT was almost entirely smooth through December and into January, before Fern raised the specter of winter issues.
Now, in mid-February, Fern is in the rearview mirror, but RTC+B is back on our minds with the release of both 60-Day data and post-settlement load for December. With this data in hand, there are far more than a handful of things to check in on, analyze, and explain. We can answer questions about batteries’ actual plans for the cutover day, get a new look into unit operations, and even quantify a dramatic change to ERCOT’s most public data, one you probably don’t even know occurred.
Data used in this article
Bids Don’t Lie
Let’s start from the top. Did batteries sit out the 5th? Turns out it depends on which ancillary service you’re looking into.
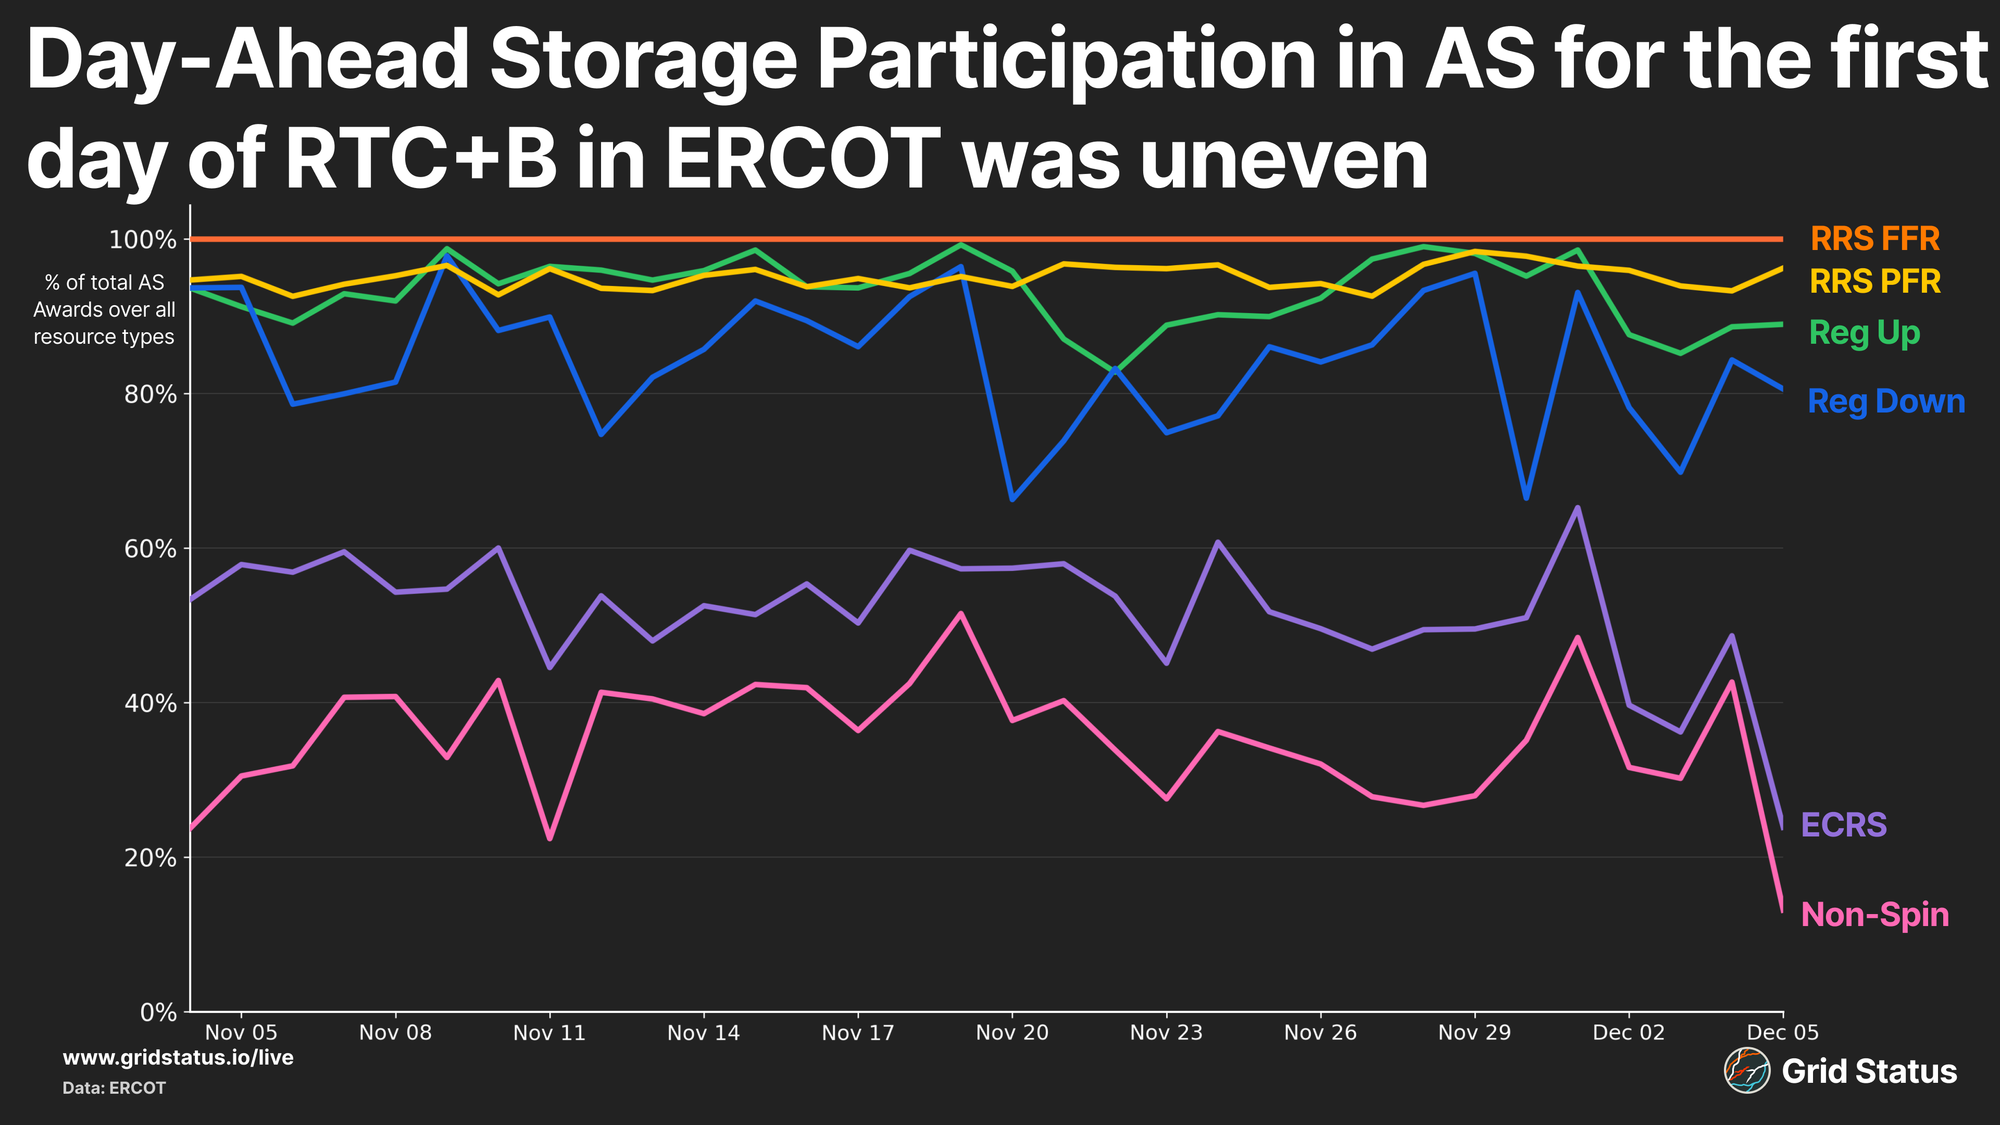
In terms of total daily awards, battery participation in ECRS and Non-spin declined, but regulation and RRS were pretty much in line with the preceding month. So maybe batteries didn’t offer much capacity for ECRS and Non-Spin? Fortunately, we can take a look.
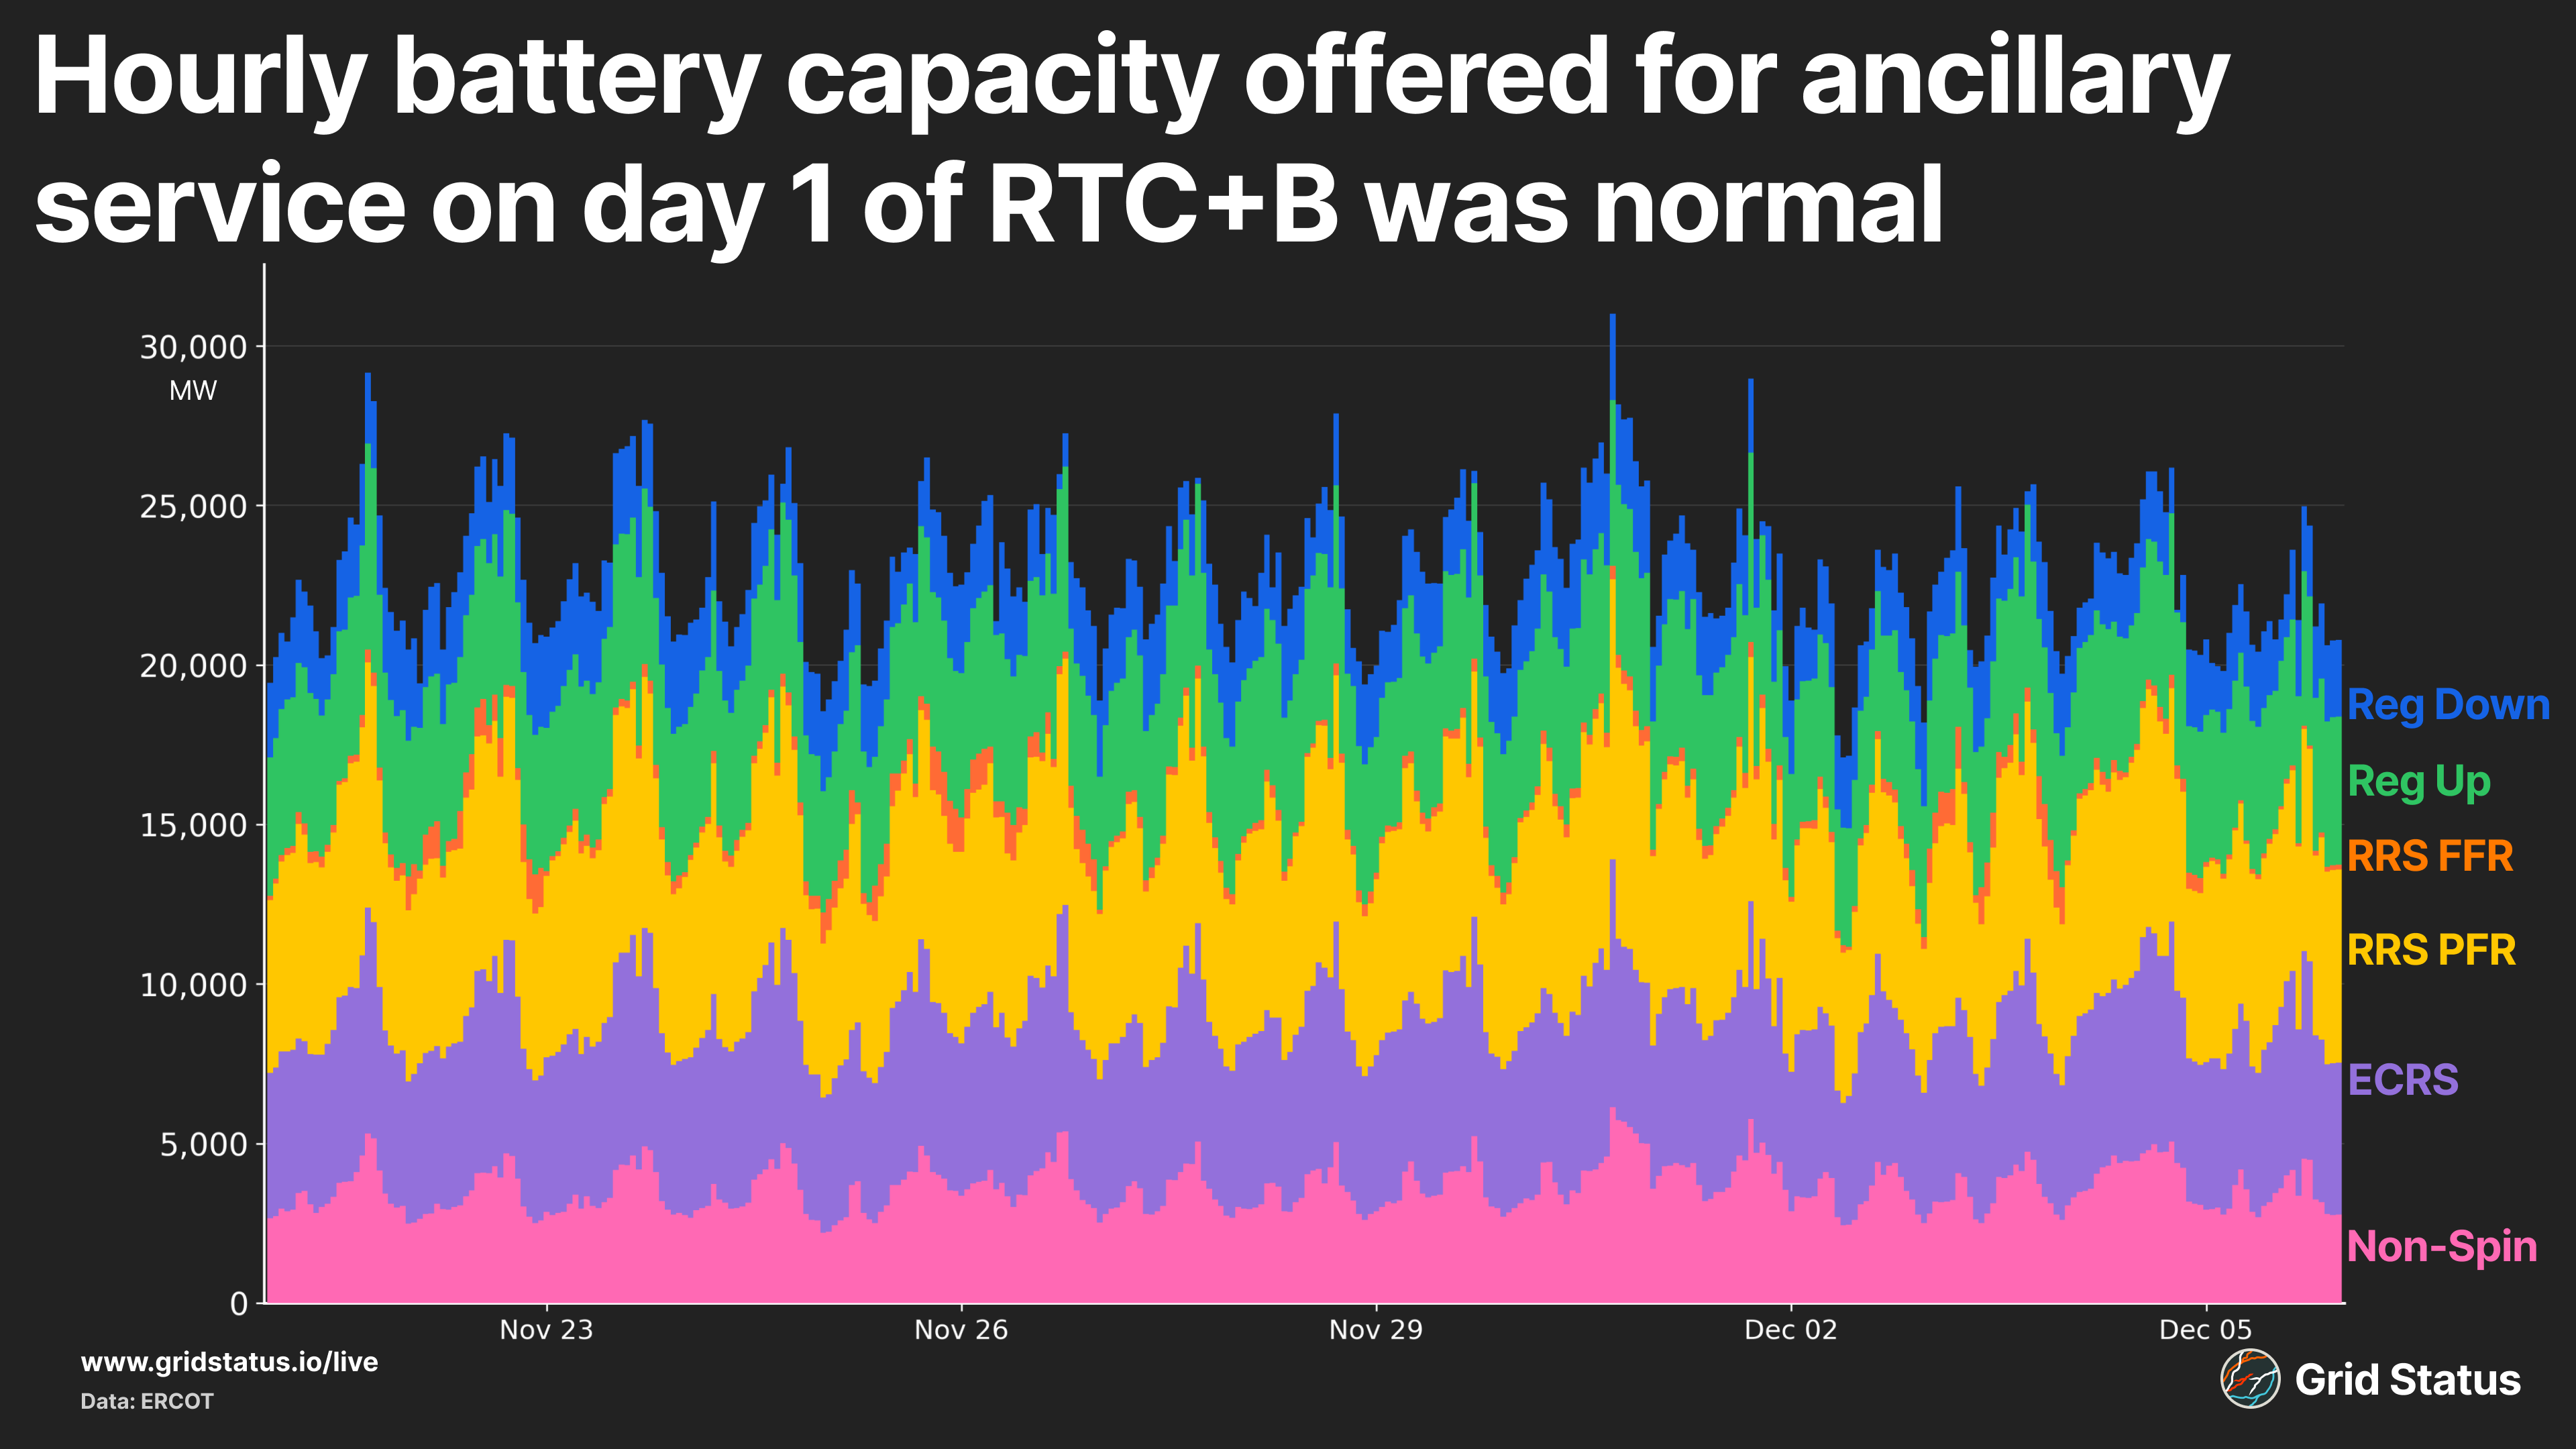
Visually, December 5th looks mostly like any old day, with batteries offering plenty of MWs, so what changed? You’ve probably figured it out by now, it was the offers. Across all ancillary services, the mw-weighted average prices offered by the battery fleet substantially increased, presumably to account for the perceived risk of RTC+B's implementation.
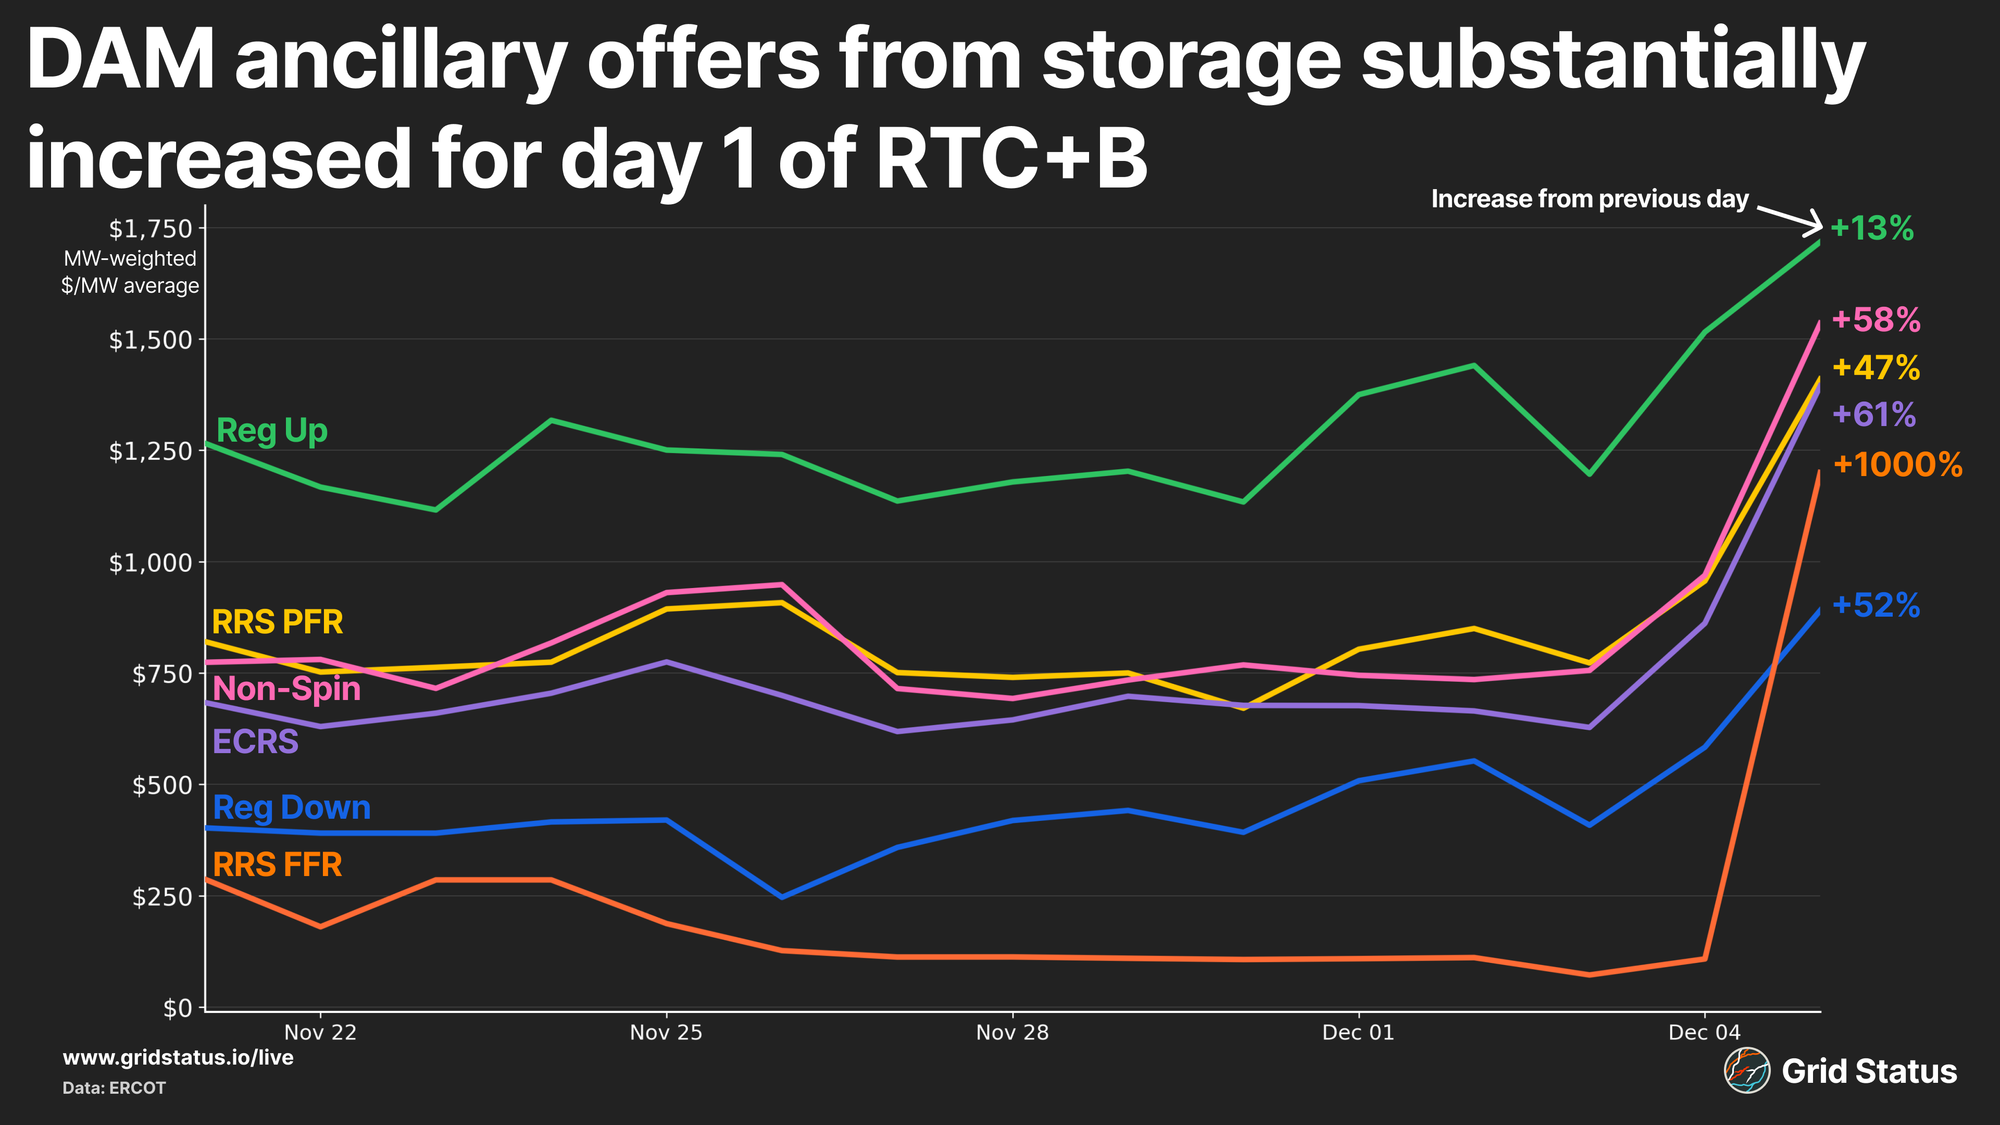
This is less the risk of directly providing the service, but the opportunity cost-based risk of missing some major market hiccup that sends real-time prices skyrocketing. We also get an indirect picture of saturation in the fastest ancillary services here. While RRS FFR’s fleet-wide prices increased dramatically, there were still enough offers lower than other technologies to maintain storage’s stranglehold on awards. To close this out, let’s turn back to the awards data and take a closer look at ECRS, one of two ancillary services where batteries noticeably declined.
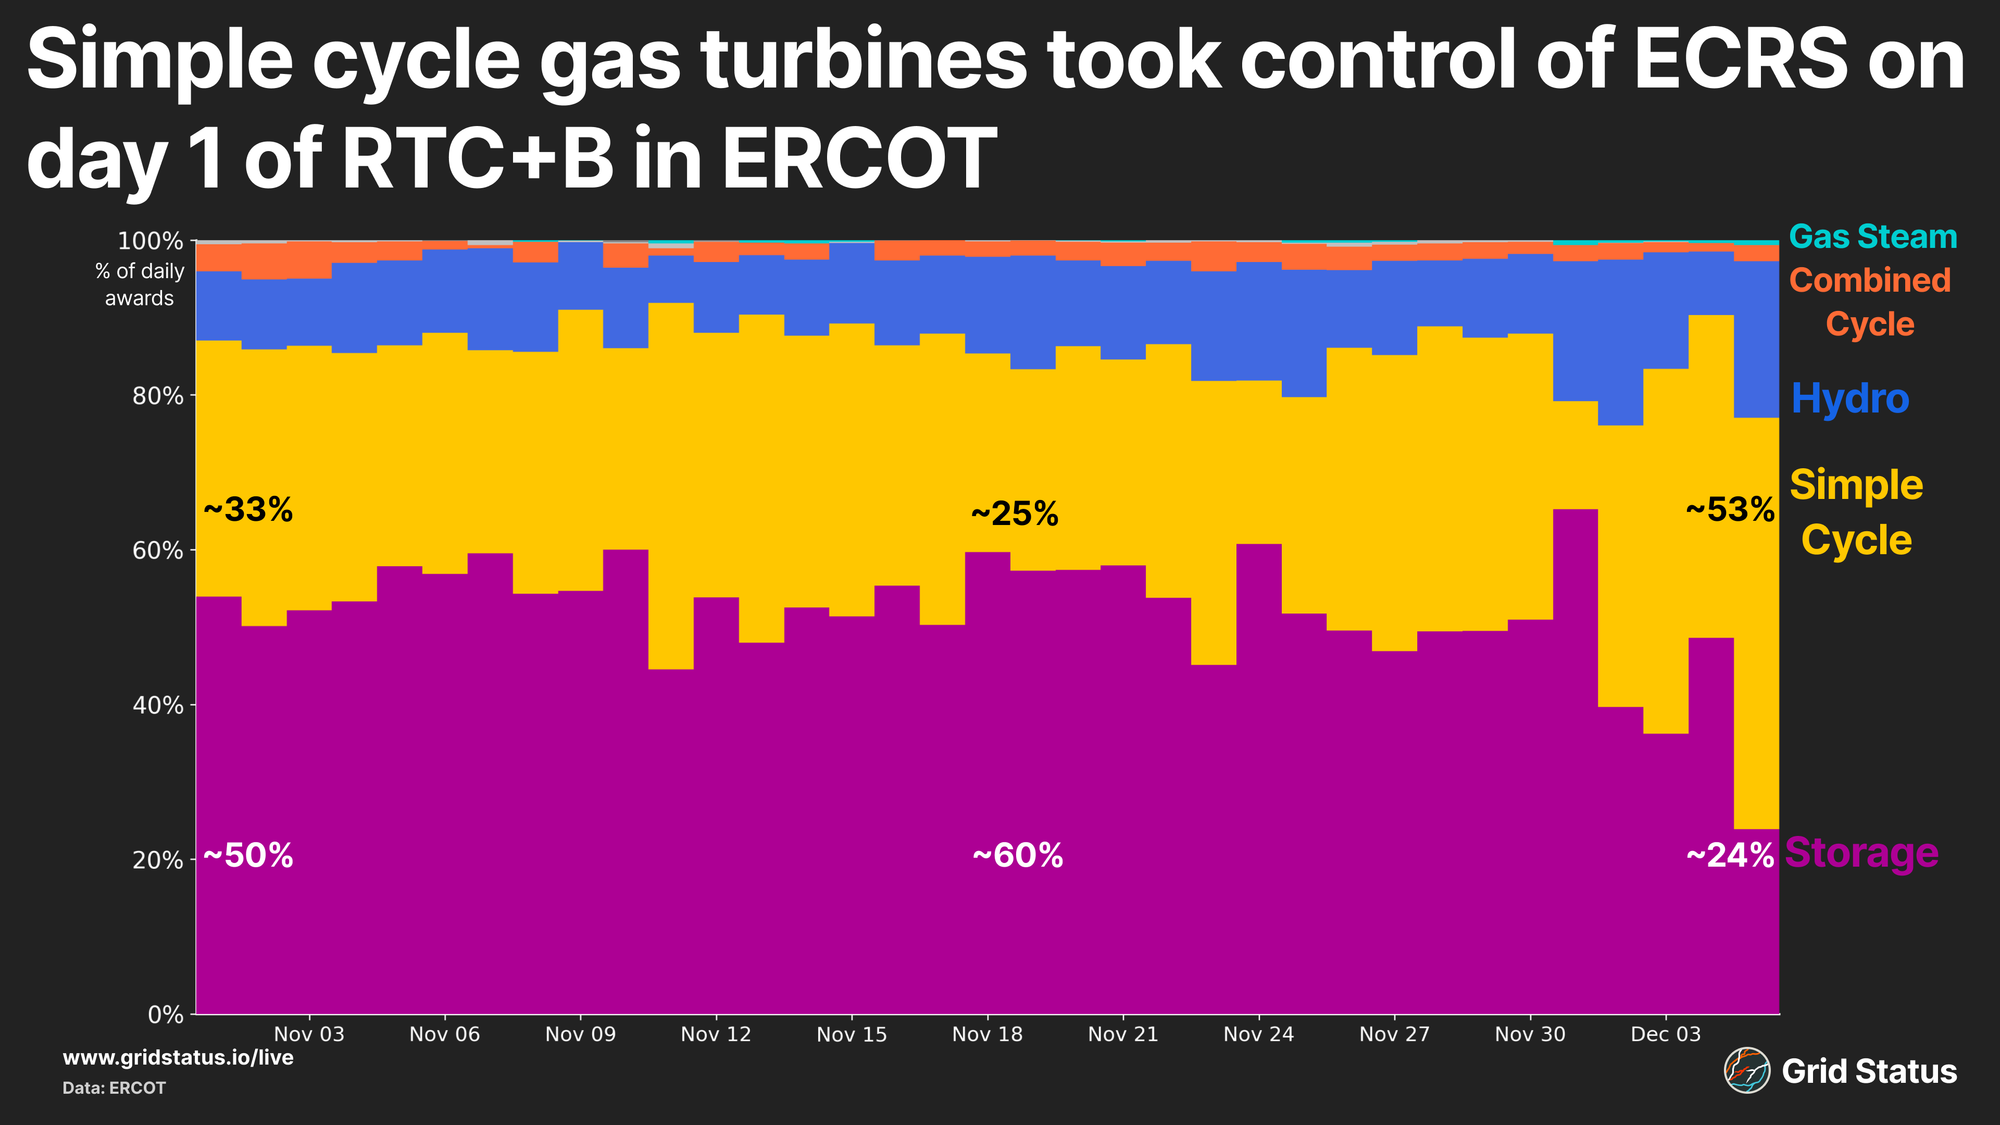
Now we see the complete picture. Battery bids went up, and simple cycle gas turbines became more economic in comparison. As a side note, this is one of the few ERCOT figures where hydropower makes a noticeable contribution, with almost half of the entire systemwide installed capacity receiving ECRS awards on some days.
Smashing Through the Boundaries
Aside from the bids and awards, ERCOT also began making some additional unit information available, so we’ll take a look at two categories of data: up and down ramp rates, and state of charge (SOC). Ramp rates measure how quickly different units can move in response to operator instructions, measured in MWs per minute.
How quickly a unit can move is part of the formula determining what dispatch schedules are even possible, and in a modern power system with inverter-based resources, this parameter is more important than ever. Now, the steepest system ramps aren’t load alone, but the difference between solar+wind output and load, net load. Solar and wind generation in aggregate can drop off or ramp up faster than load, particularly when concentrated in the same geographic area.
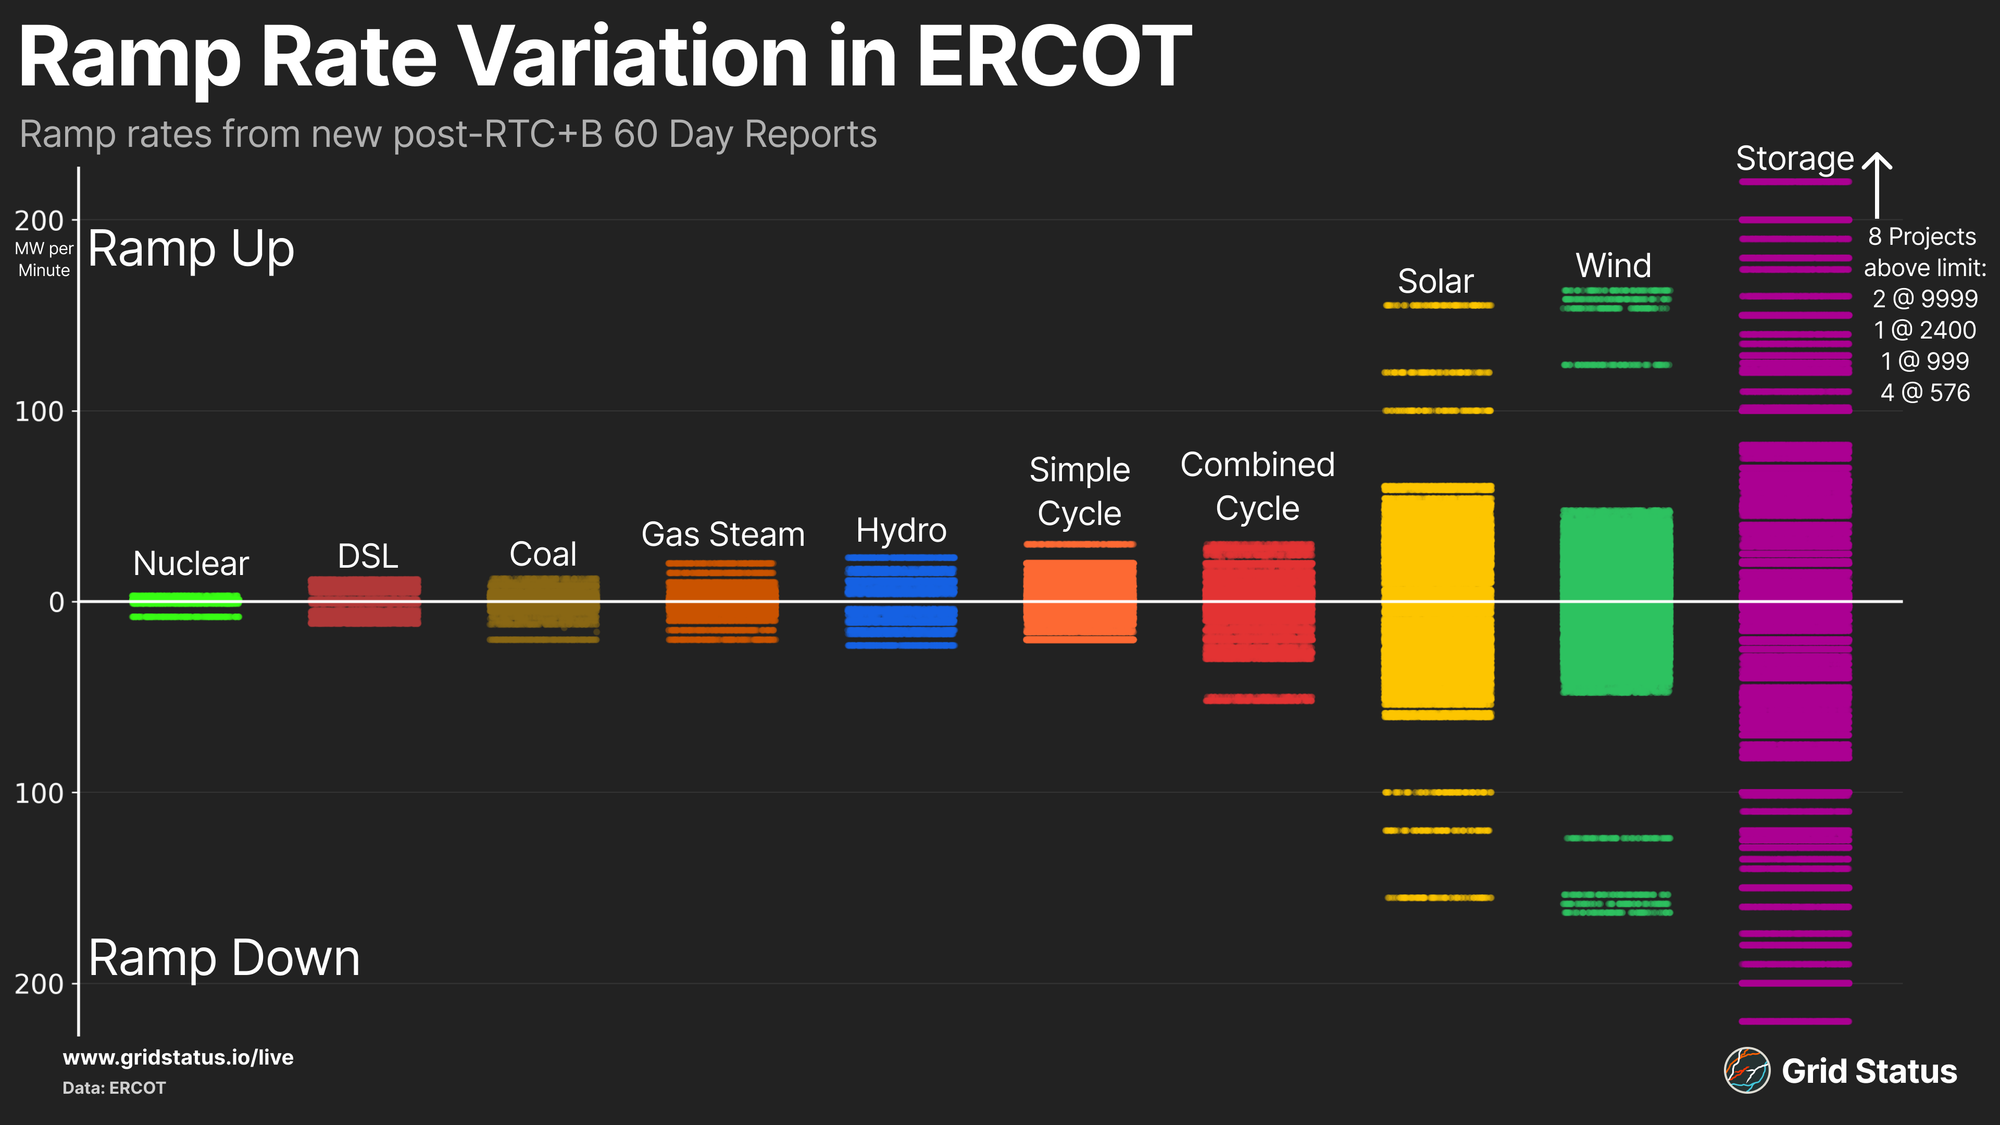
Unsurprisingly, inverter-based resources stand out, while combined cycles are the kings of gas flexibility. Inverter-based is the key difference here; power electronics are always going to be quicker than burning molecules to spin metal. This chart isn’t a value judgment, just a statement of technologies, a concept that commenters on LinkedIn struggled with when we posted it over there.
Battery operators may have found the instructions a bit unclear, as multiple projects submitted rates nearly 60 times the highest values reported by any other technology type (and far beyond their own capacity).
Batteries can respond extremely quickly, and in following their technical specs you can multiply out to a value above 9999 (although actually hitting 9999 with multiplications of these units’ capacities would require some interesting fractions), but these extremely high values don’t seem to comport with ERCOT's Market Submission Validation Rules:
"Resource Parameter submissions will be rejected if the base points of ramp rate curves are not greater than or equal to 0 and are not between the High Reasonability Limit and Low Reasonability Limits."
So these inputs wouldn’t have been used for actual operations, and the resources would have been restricted by their own capacity and state of charge anyway, but they are a great example of the assumptions that a new technology can challenge. Realistically, battery storage projects should be able to respond more quickly than most grid needs require, which makes the immense range on display even more interesting. To get even more battery-centric, let’s talk state of charge.
Visualizing the fleetwide min and and max SOC limits is not particularly interesting, but in combination with the actual SOC we can extend to calculate the charge/discharge headroom across ERCOT’s battery assets.
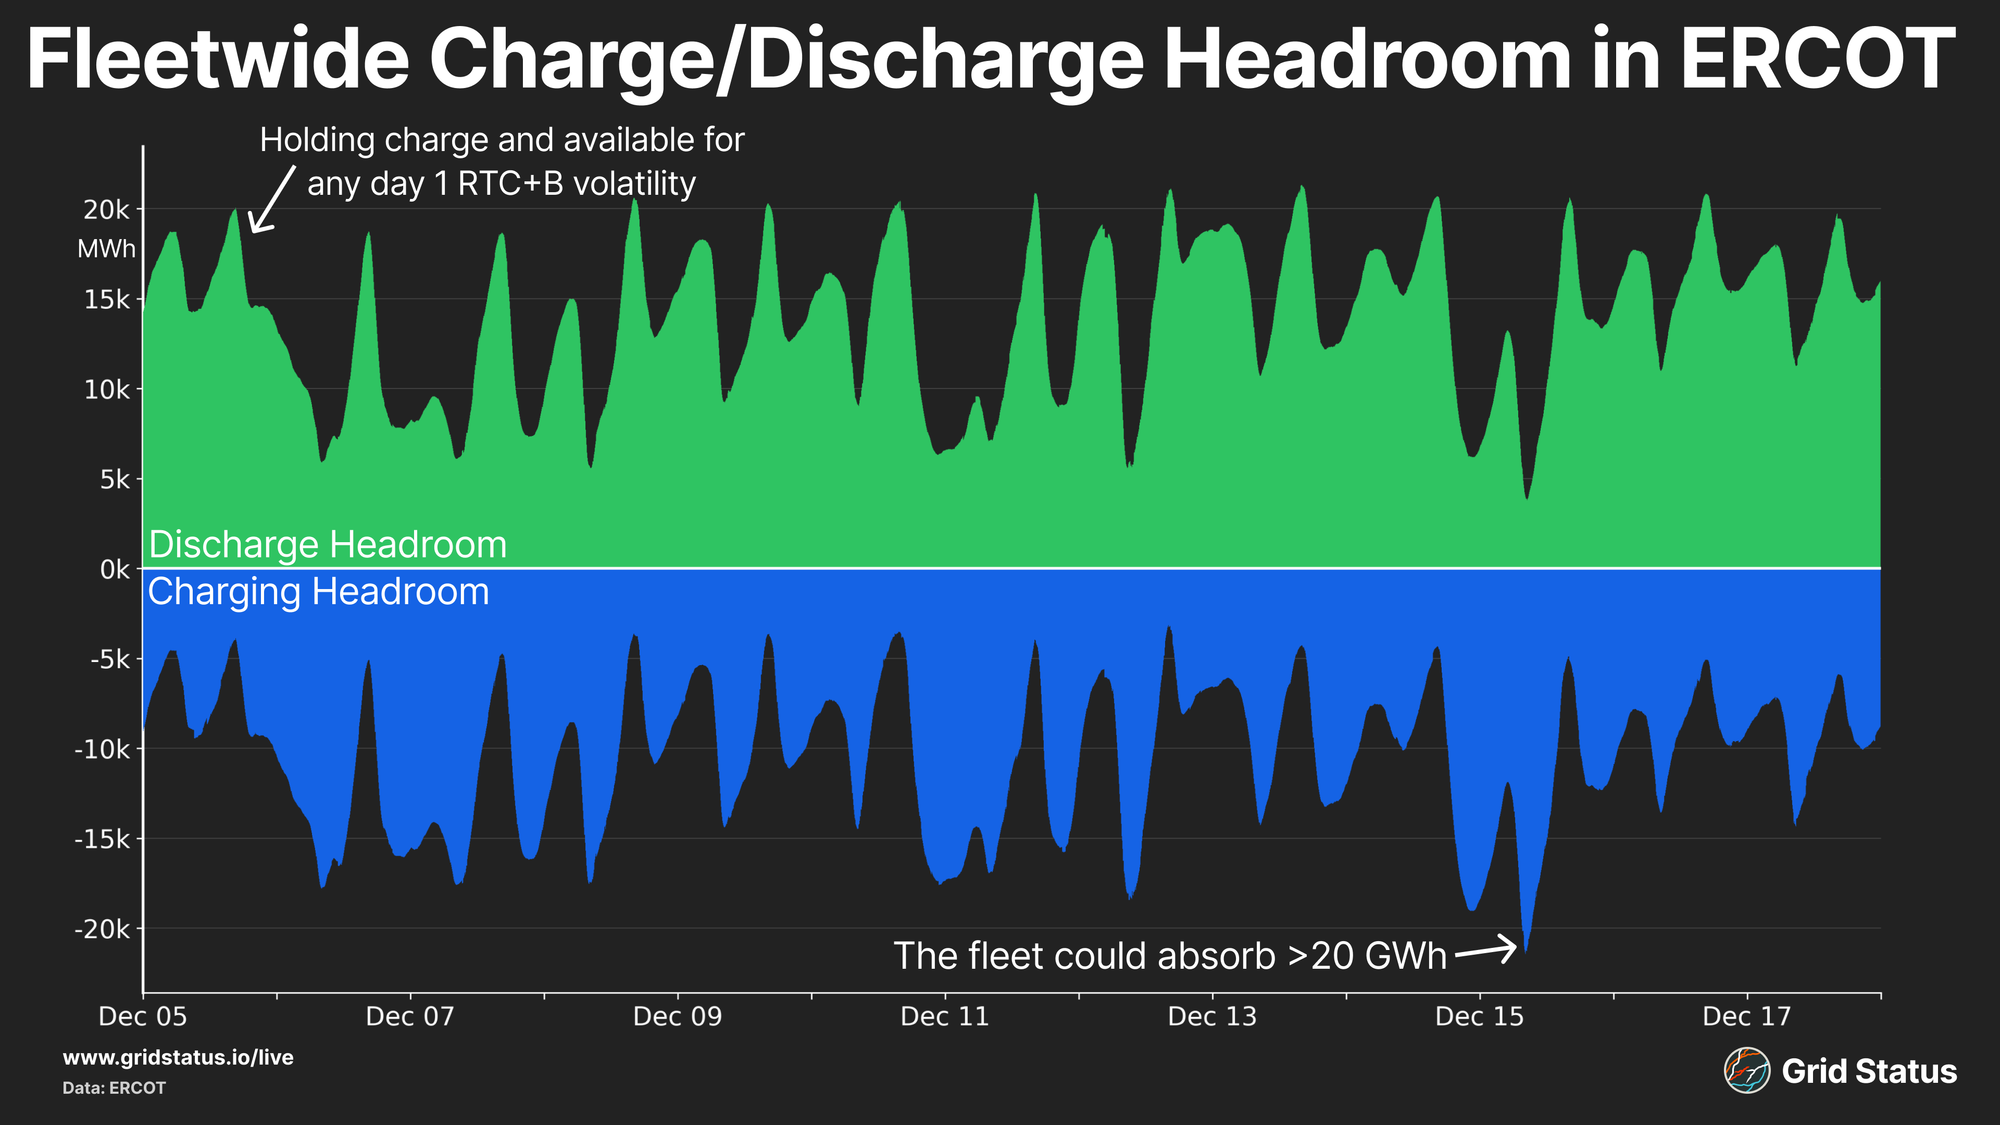
While each day tends to follow roughly the same pattern, in aggregate over time, fleetwide headroom can have significant shifts. ERCOT’s batteries aren’t as boxed in as CAISO’s in terms of operational possibilities, so we tend to see somewhat more variety over time. You can also see the SOC held back over time as the sum of max SOC reached 20,000 MWh on many days, while the minimum side only reaches or exceeds -20,000 a single time.
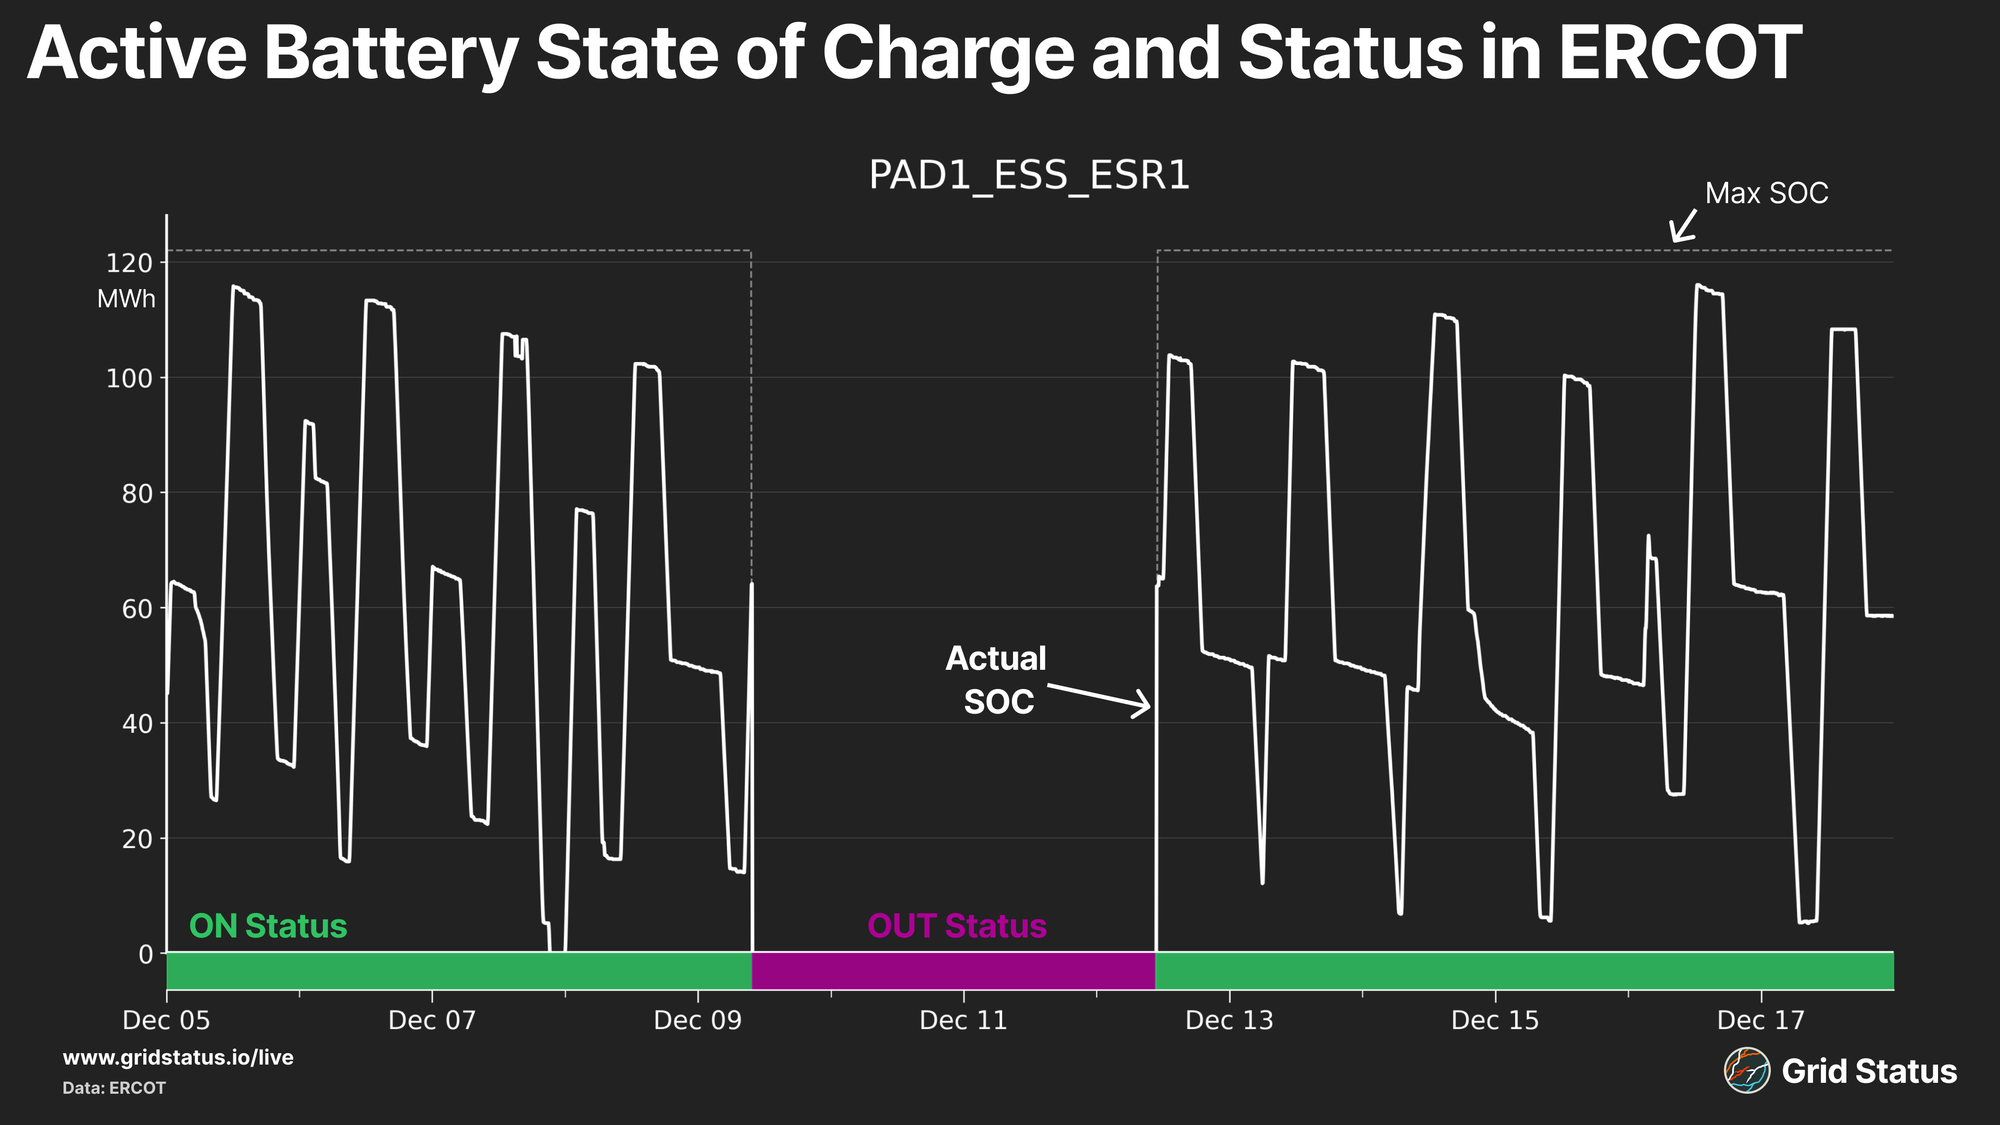
Fortunately, we’re not limited to system aggregates, but can also dig into individual units.
Moving into individual batteries, it’s helpful to also include telemetered unit status for any given interval, as it can often explain not just big swings in SOC, but also overall asset behavior. For the available data (through the first ~half of December), ESRs telemetered 5 different statuses to ERCOT:
- ON: Online, with an energy offer curve
- ONOS: Online, with an output schedule
- ONTEST: Online, testing with an output schedule
- ONHOLD: On Hold, output is constant temporarily
- OUT: Offline, unavailable
Looking at SOC and status together, we came up with a handful of categories that most ESRs fall into. First, Clearly Testing. These units telemeter the ONTEST status nearly all of the time and exhibit inferred behavior (via soc) that doesn’t really mesh with typical market-based operations.
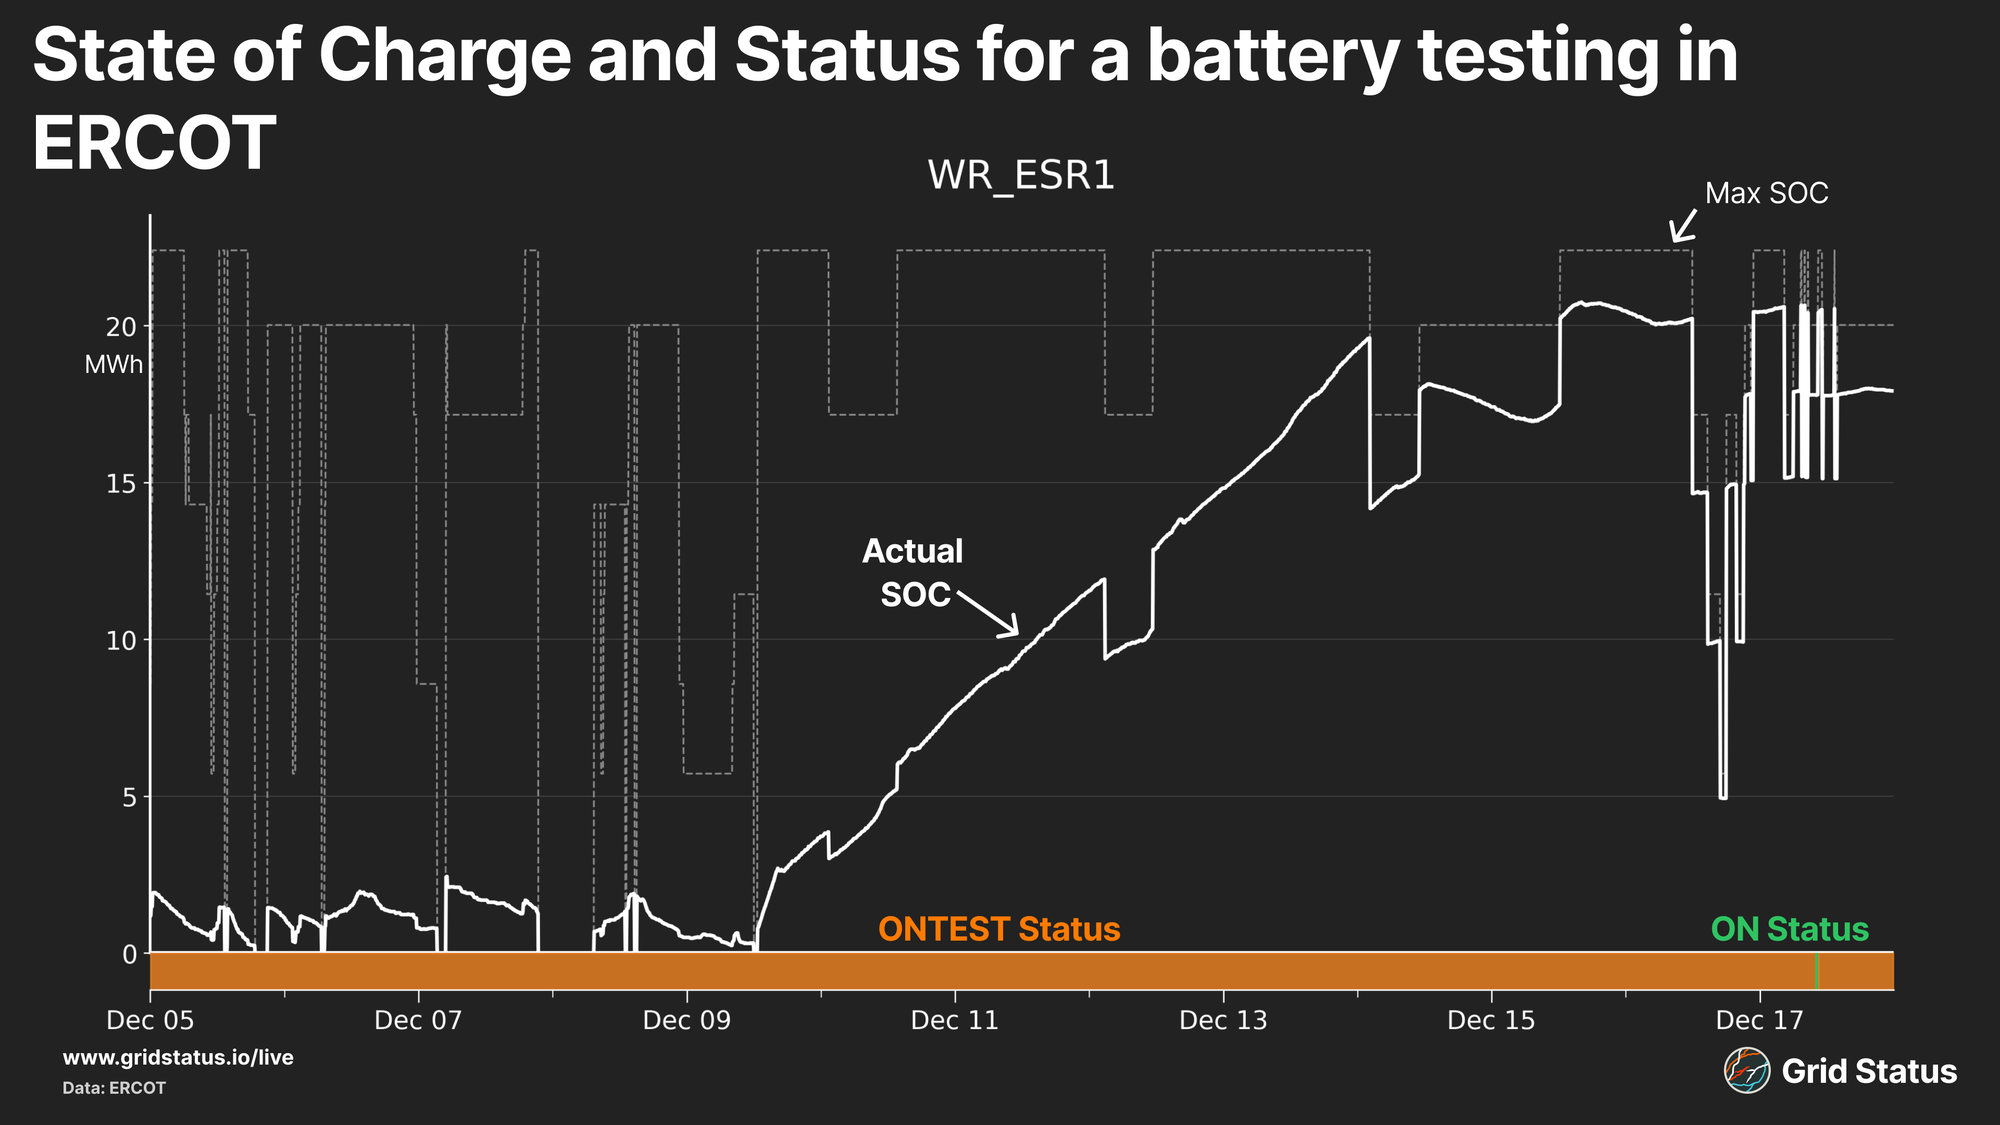
Wharton BESS, a 2 hour 9.9 MW site in Wharton County displays a very low SOC with big swings in the max SOC metric, followed by a multi-day ramp up to maximum charge, which feels like clear and obvious testing. At the end of the charge ramp, the unit briefly enters ON, but flips right back to testing. Next, we have a different testing pattern, with mixed statuses.
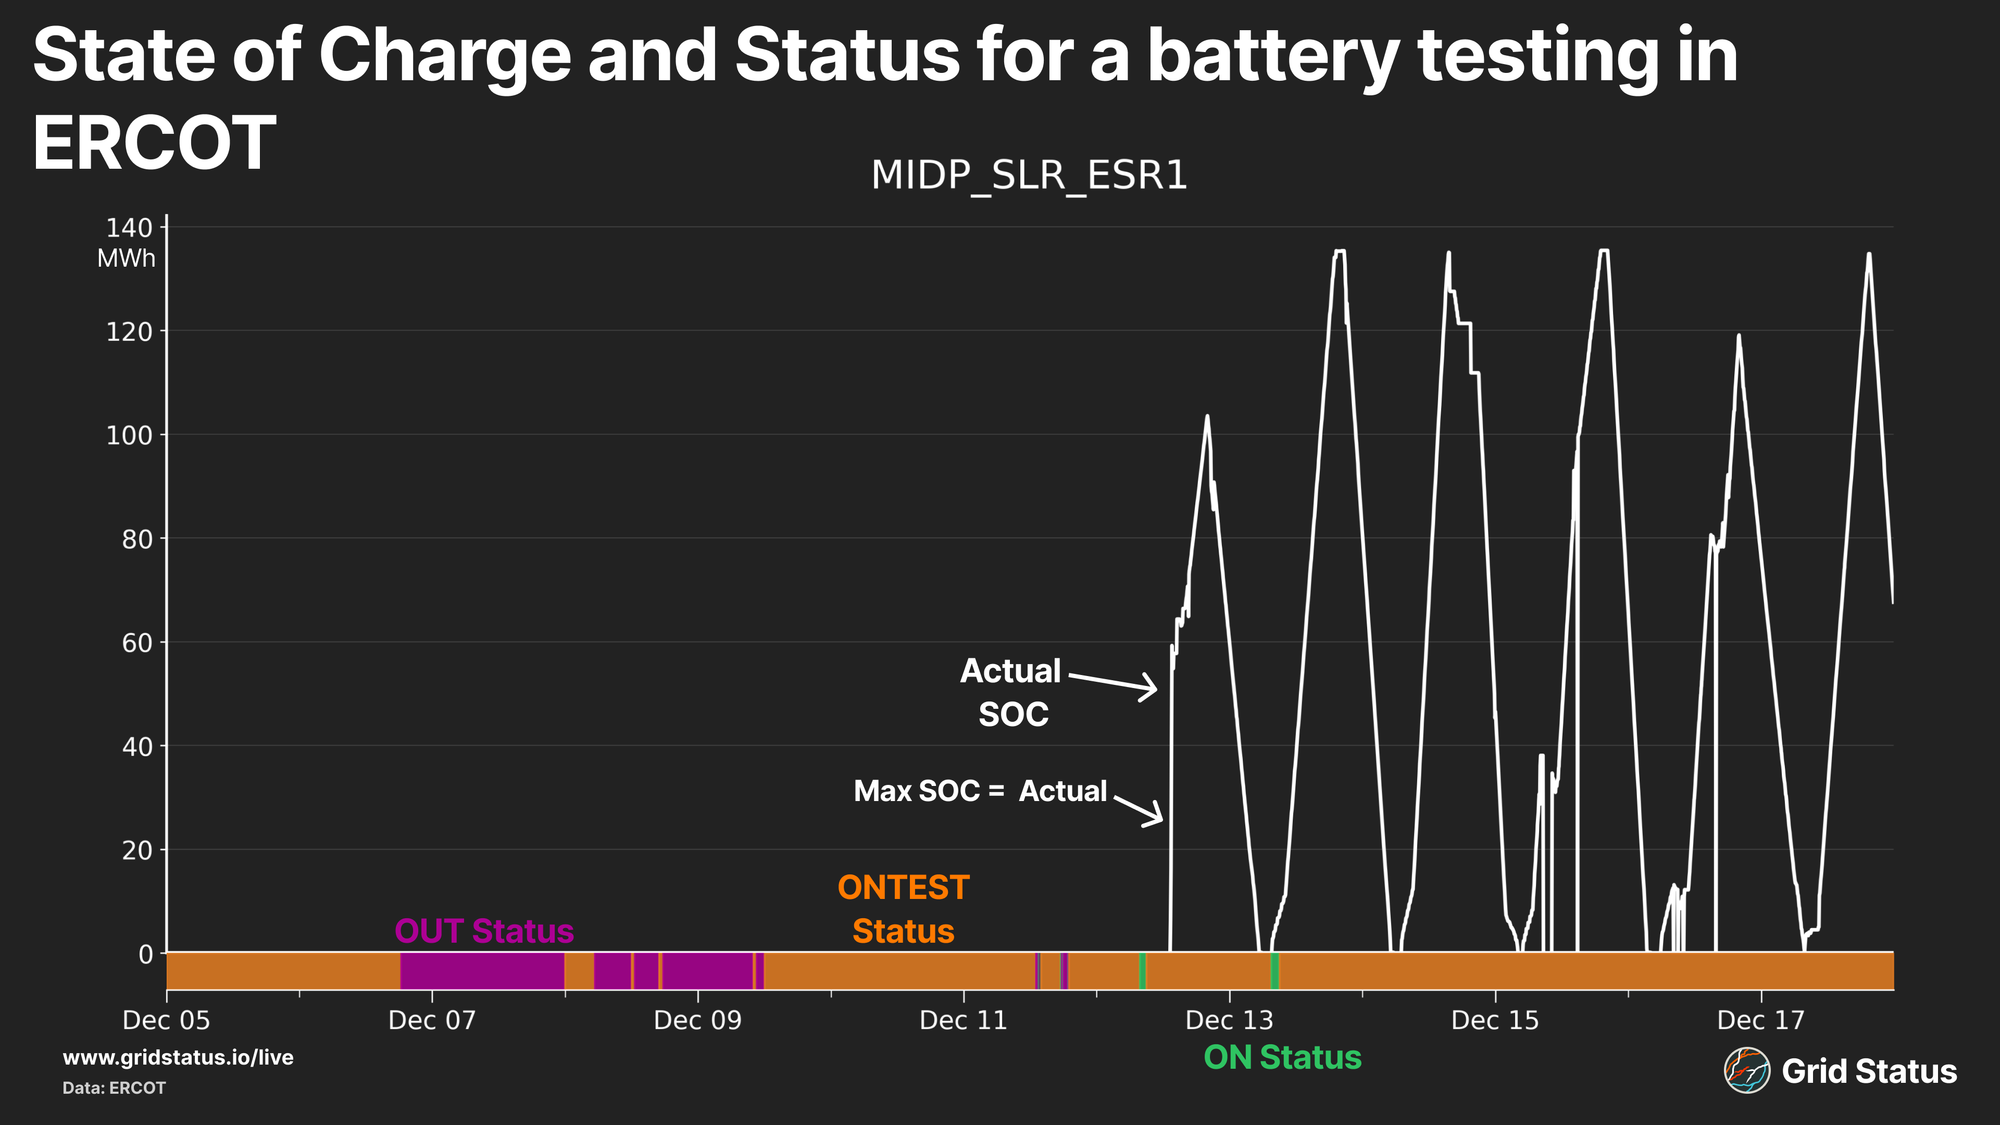
Here, Midpoint Storage, a Hill County project, has a few brief intervals of ON, but also stretches of OUT. Once the unit begins operating on the 12th, it shows repeated climbs up and down its capability, never sustaining a single level of charge or discharge and bottoming out between runs. Throughout this time period, the unit’s max and min SOCs aren’t visible on the chart because Max SOC is set to overall SOC, and the min SOC is 0.
Our second category is back from outage. The telltale pattern here is a stretch of OUT, followed by a brief ONTEST into ON, or issues that bring the unit back into ONTEST or OUT.
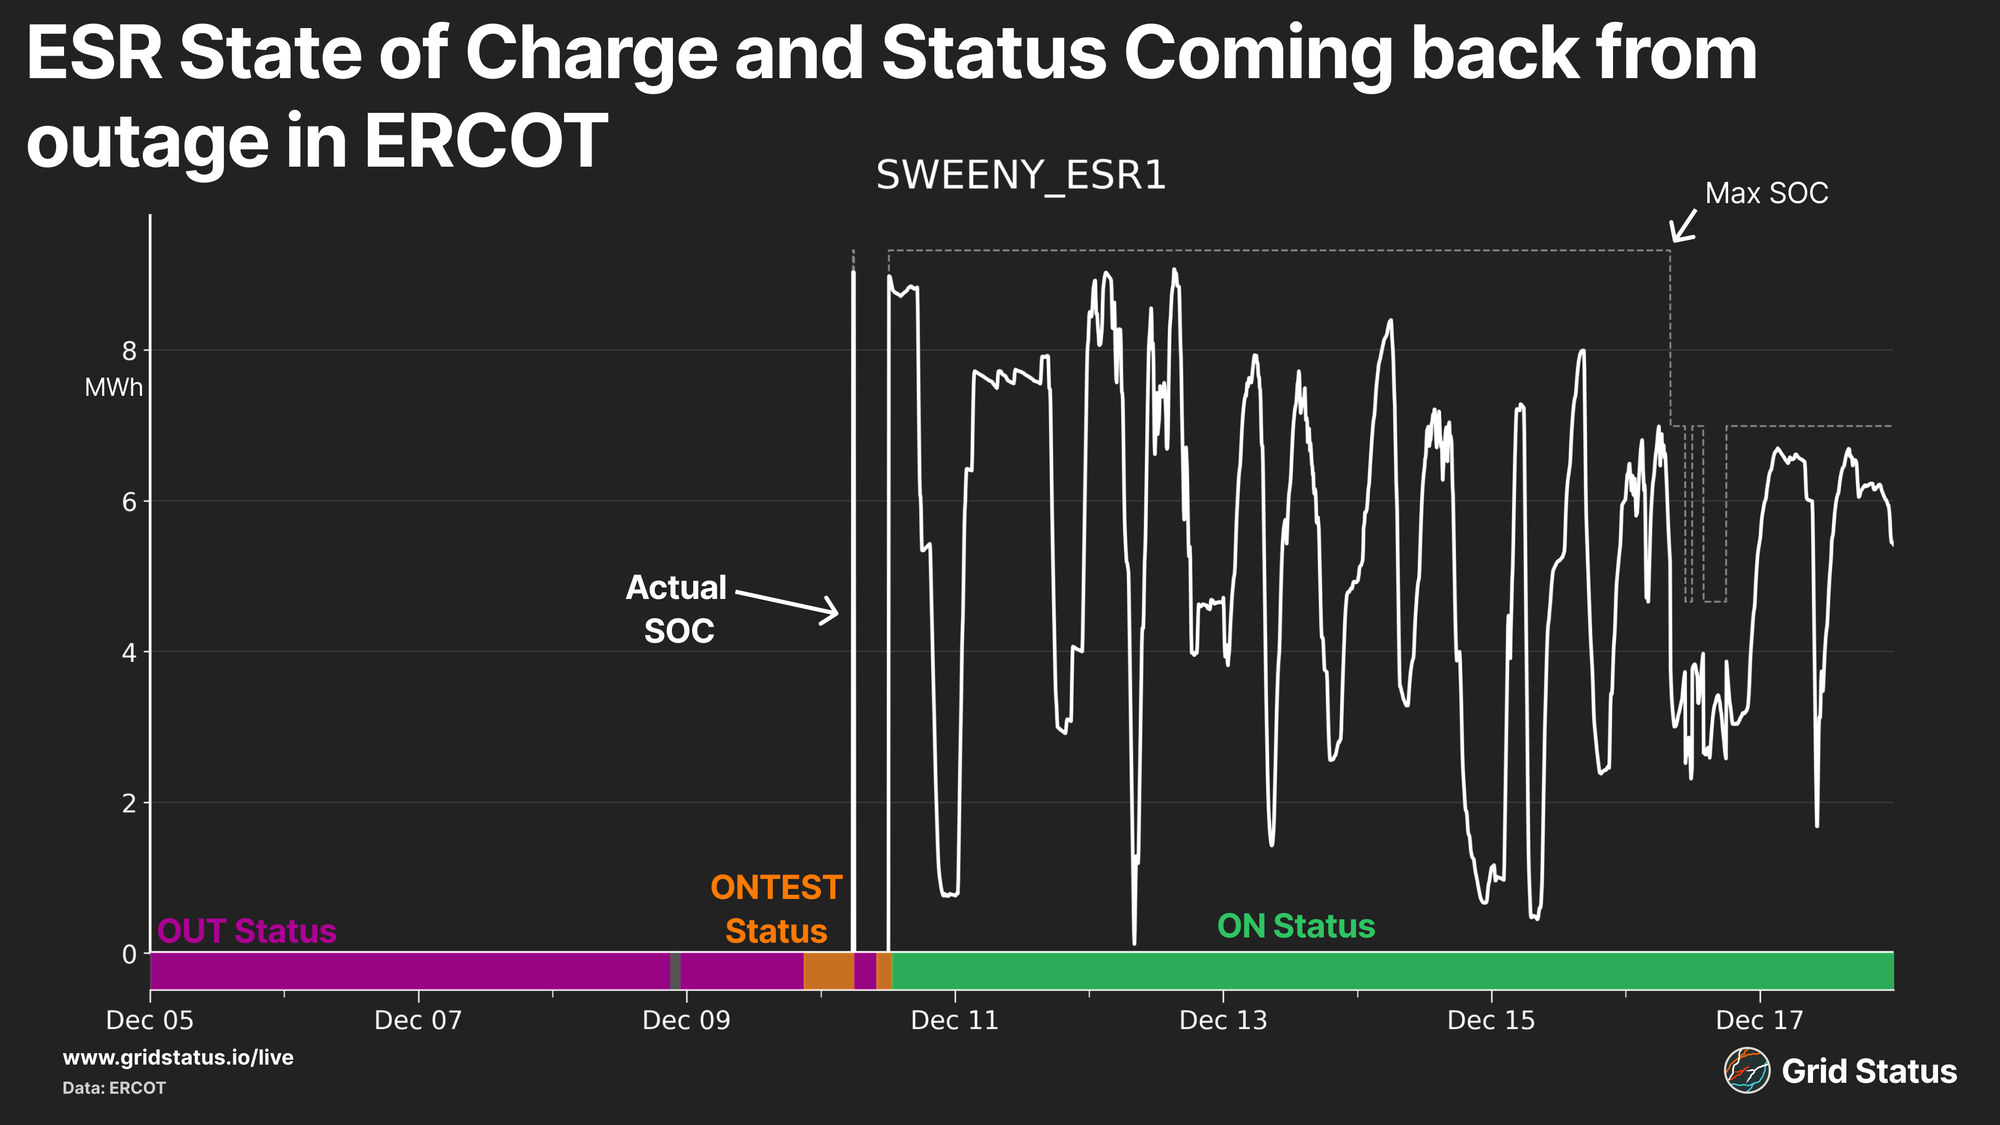
Sweeny, a 9.9 MW battery in Brazoria County, changes its status to ONTEST early on the 10th and begins to come back online, but SOC collapses and it briefly returns to OUT, and then ONTEST, before successfully charging and returning fully to ON and what appears to be regular operations.
Finally, we come to two flavors of normal operations, although their reporting standards are a bit different. First, Padua Grid BESS in Bexar County.
When Padua is out, Max SOC is logically 0, and that’s how they seem to treat it, sending 0 values across the board for SOC (min, max, and actual) while the unit is telemetering the OUT status. Rodeo Ranch, a large project in Reeves County, takes a different tack.
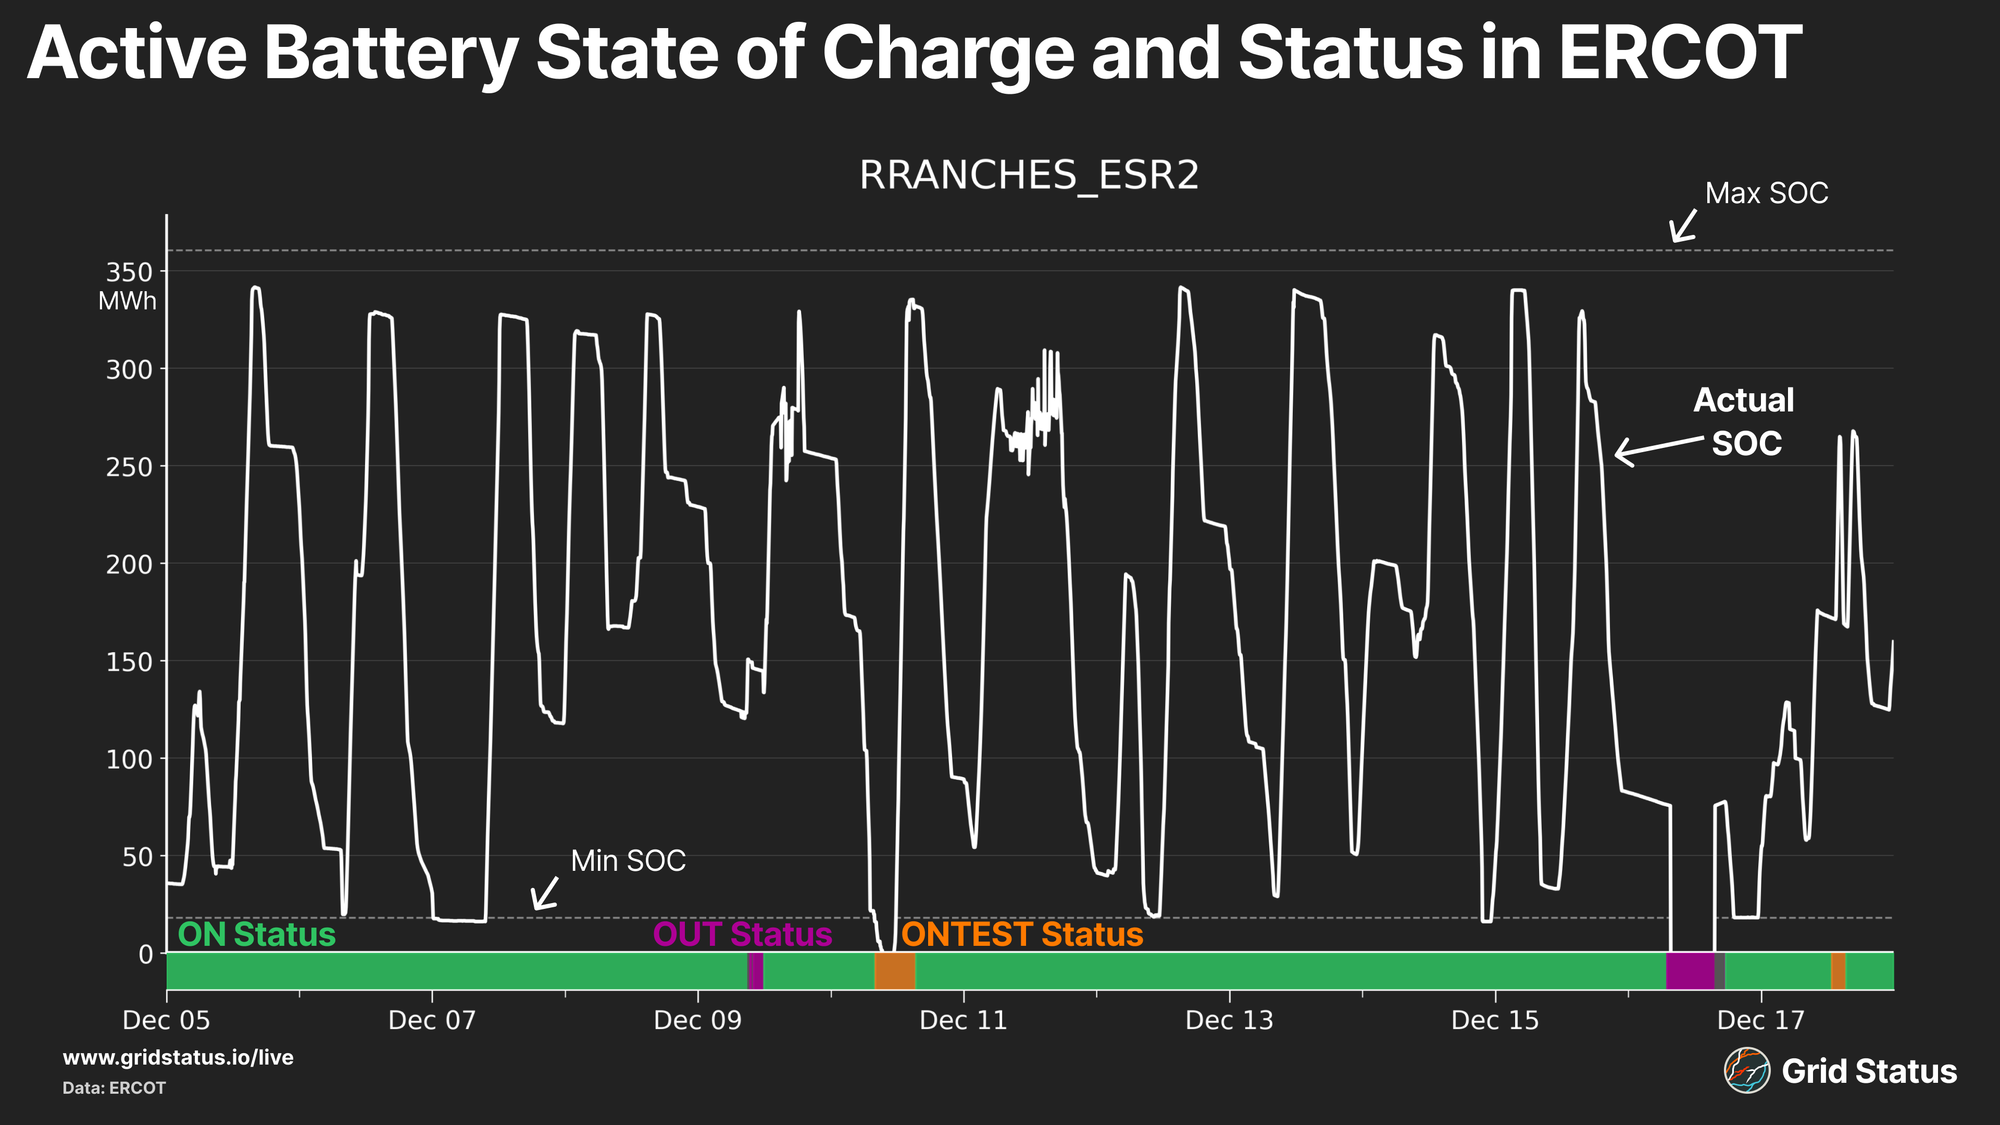
Rodeo Ranch occasionally goes on outage or to test during this period, but even when the unit seems to be offline, Max SOC stays pinned at the same value. This does make it seem that one of these units is likely reporting Max SOC incorrectly. Running with that observation, let’s take a look at max state of charge alone in the context of unit status.
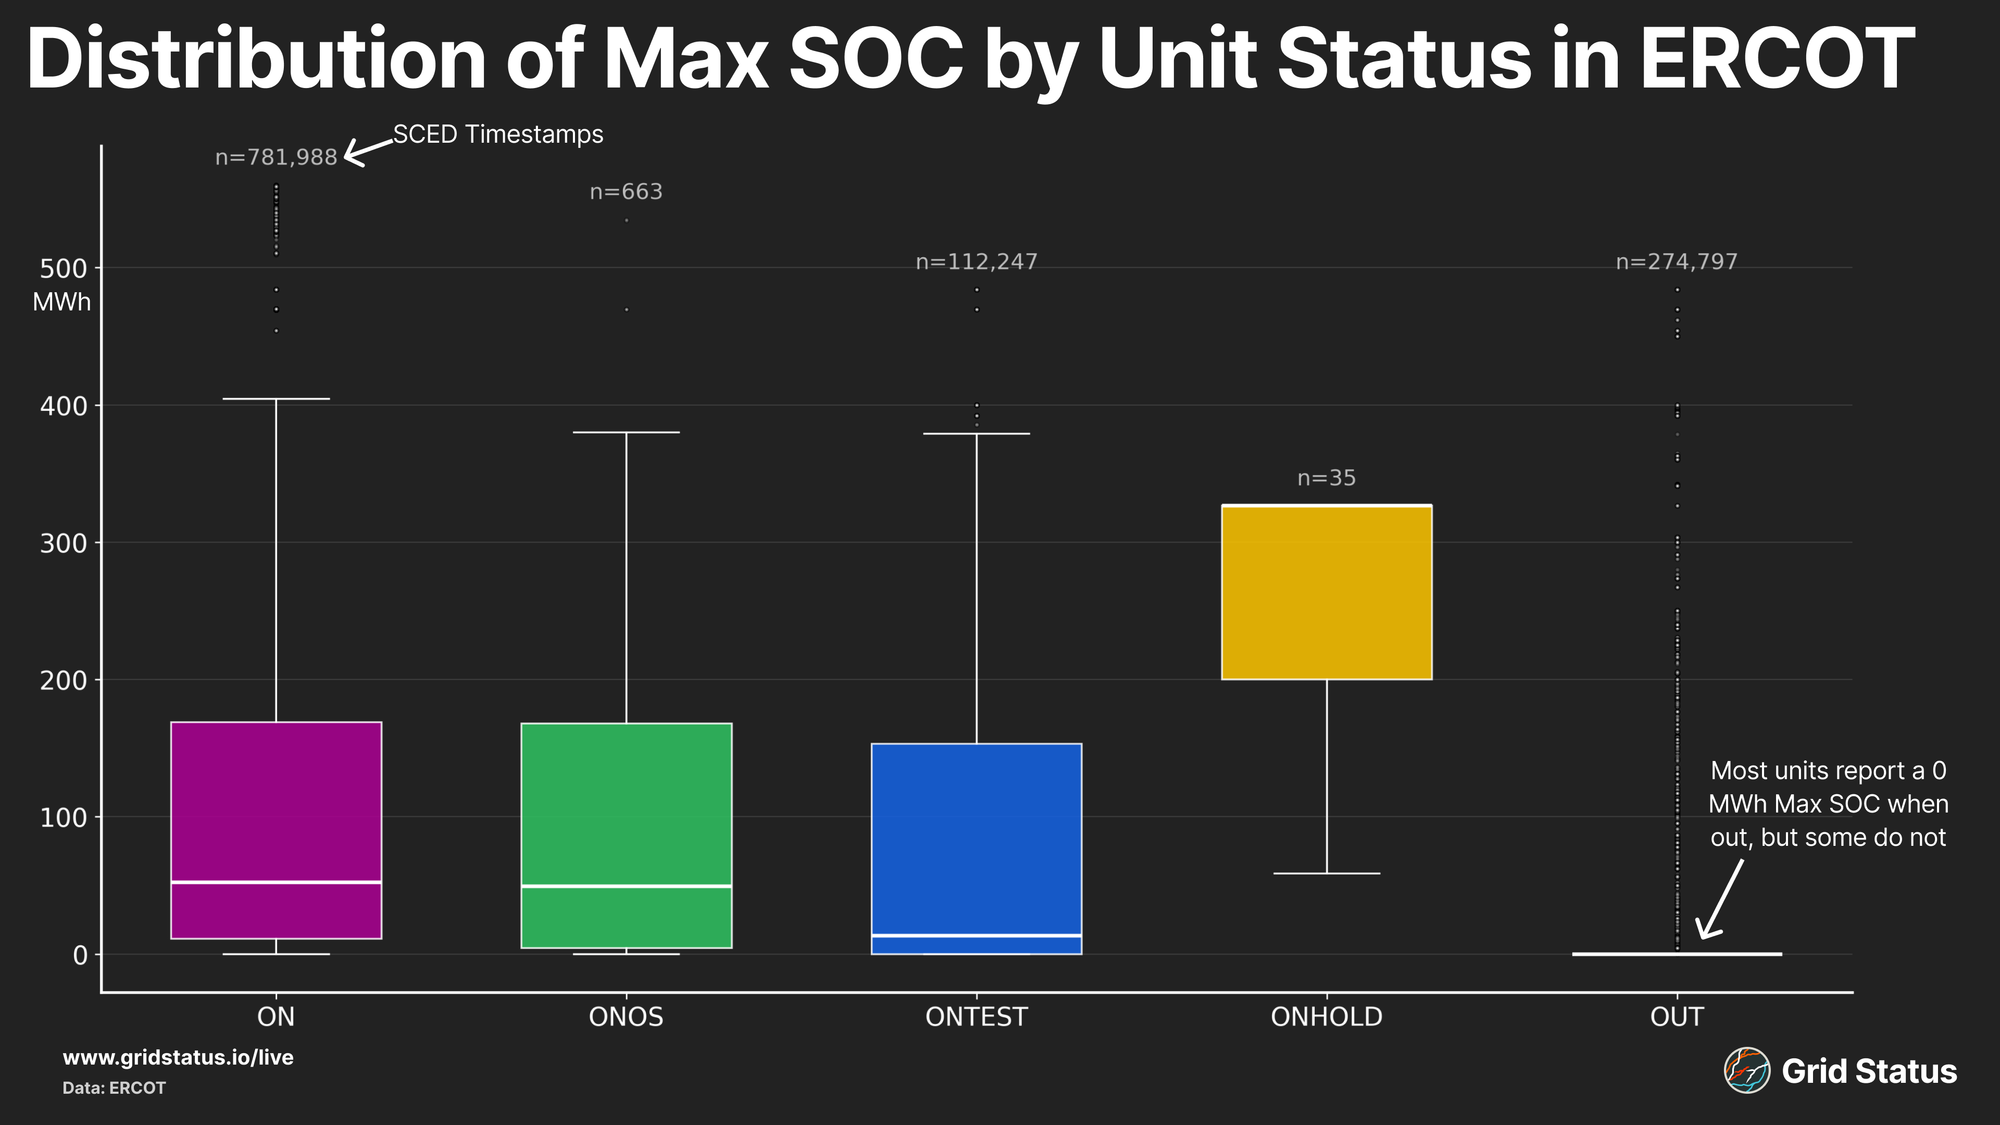
This generally looks right, with the three non-hold online statuses reporting similar max SOC distributions. However, as with the ramp rates, we do still see some odd values, this time associated with the OUT status.
Nearly all units telemetering the OUT status report a Max SOC of 0, which makes sense as they are unavailable. Some units, however, do report available SOC in some intervals. Another interesting tidbit is the relatively small range of resource status codes in use. ERCOT makes 16 different status codes available for generators and ESRs. While some of these (such as SHUTDOWN and STARTUP) don’t make sense for batteries, it’s mildly surprising that none of the “offline, but available under certain circumstances” statuses were seeing use.
Less surprising is the very small portion of resources utilizing ONHOLD. ONHOLD is for units that are online but experiencing some issue that forces them to sit at their current output, such that they are unavailable for SCED dispatch. Batteries should have a very limited set of operating states where they get “stuck” charging or discharging, so you would hope to see limited use of this status.
Update Your Models
Ancillary services and battery ops were top of mind for ERCOT's RTB+C implementation. But did you know it also changed real-time load reporting?
Previously, ERCOT's real-time demand reports included charging from energy storage resources. Post-RTC+B, this is no longer necessary, so storage is no longer included. While this has been possible to tease apart in the data since the transition, the release of post-settlement hourly load data last week covering the cutover day really hammers it home.
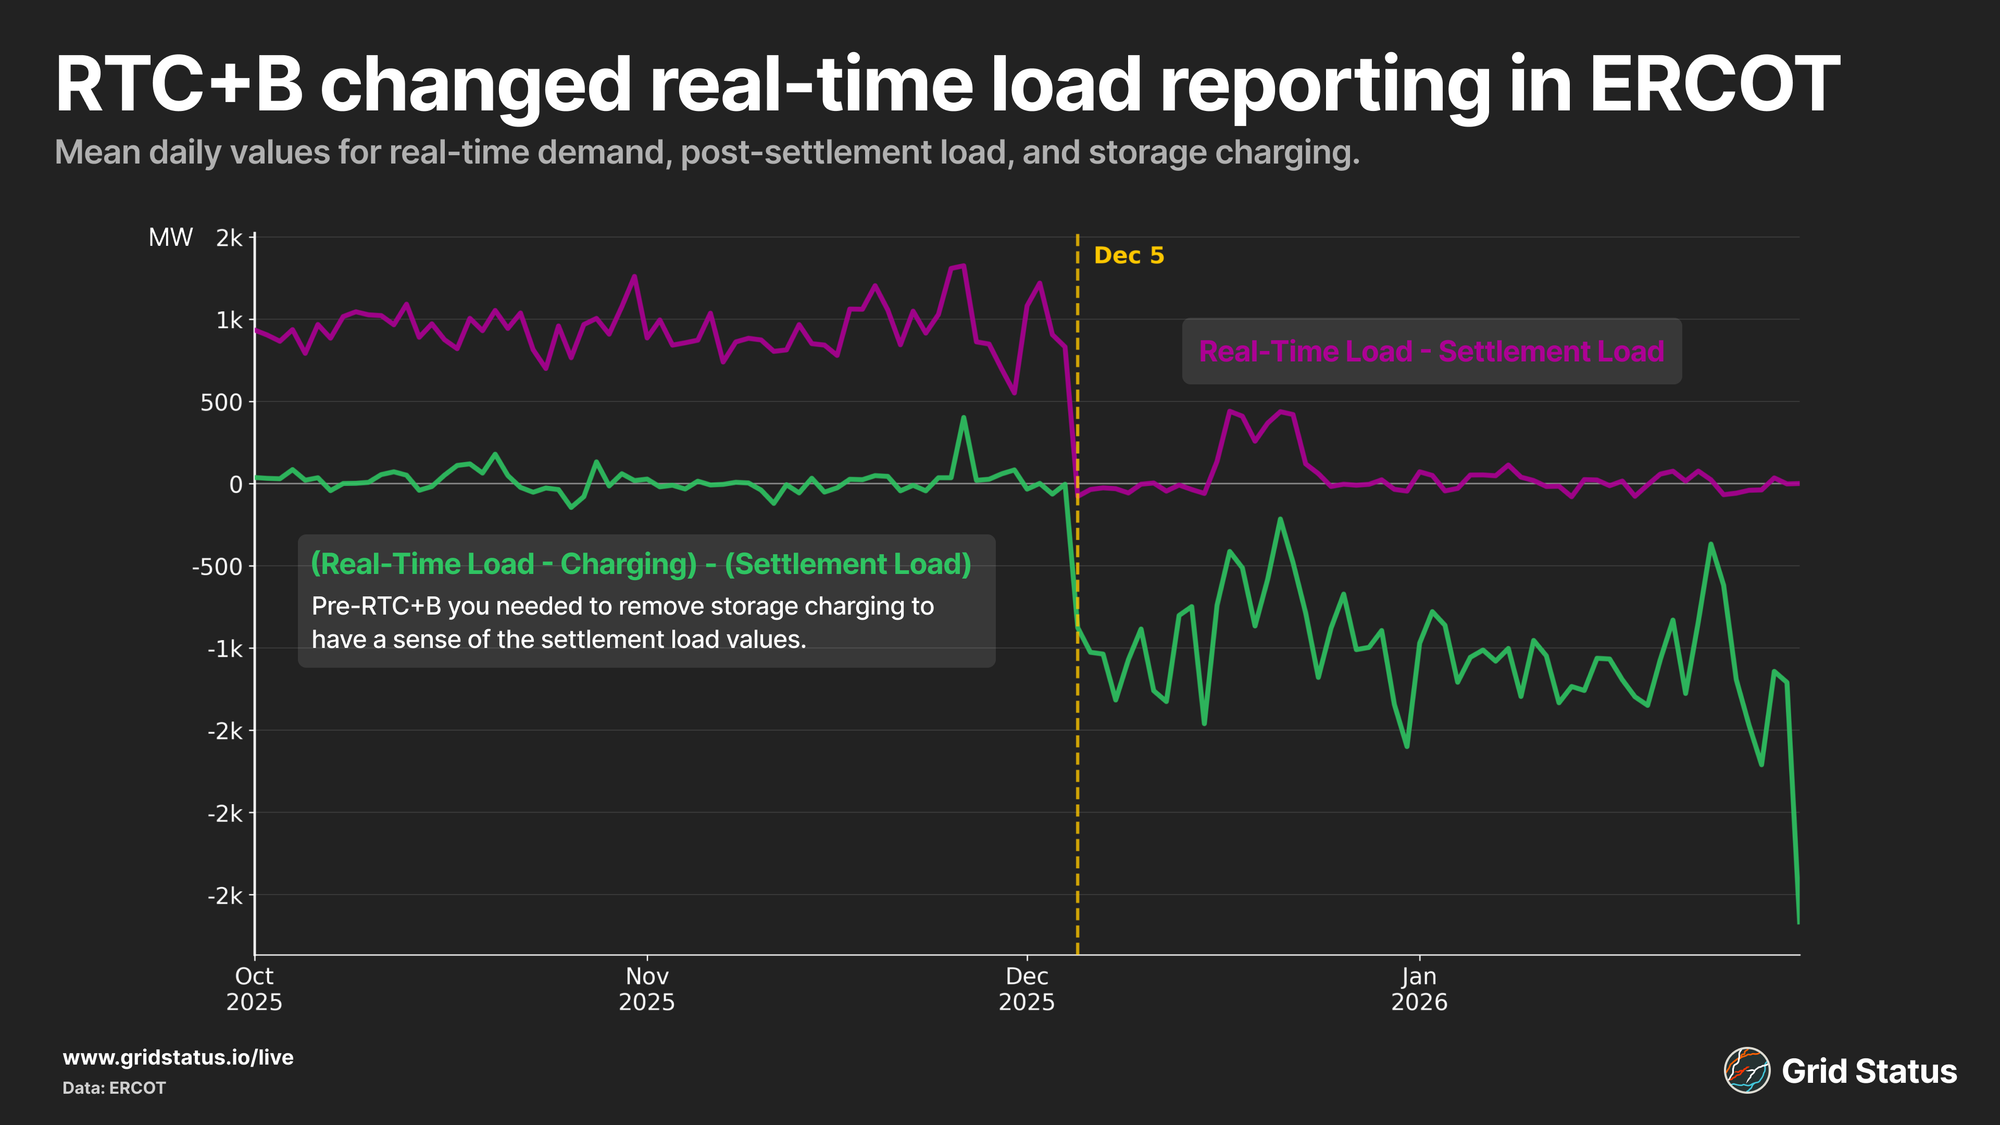
Pre-RTC+B, the spread between settlement load and real-time load could be almost entirely explained by storage charging. By October of last year, the daily average spread hovered between 900 MW and 1 GW. Once RTC+B was implemented, this relationship vanished.
If you’re tracking load as a function of fuel mix output, be careful! With battery operations included in the fuel mix, the negative charging values can mislead. If you go to ERCOT’s fuel mix during a charging period, and add all values together, then check the load, they’ll roughly match. You might be inclined to say, “Hey, charging is included in load because these numbers are the same!”, but you would be misled. What you need to do is compare the fuel mix without storage charging to the reported load in order to see how much more the system is generating to cover battery demand.
We can also take the spread from above and check its correlation with storage charging. Unsurprisingly, the relationship is close to 1 prior to RTC+B, and essentially nonexistent after implementation.
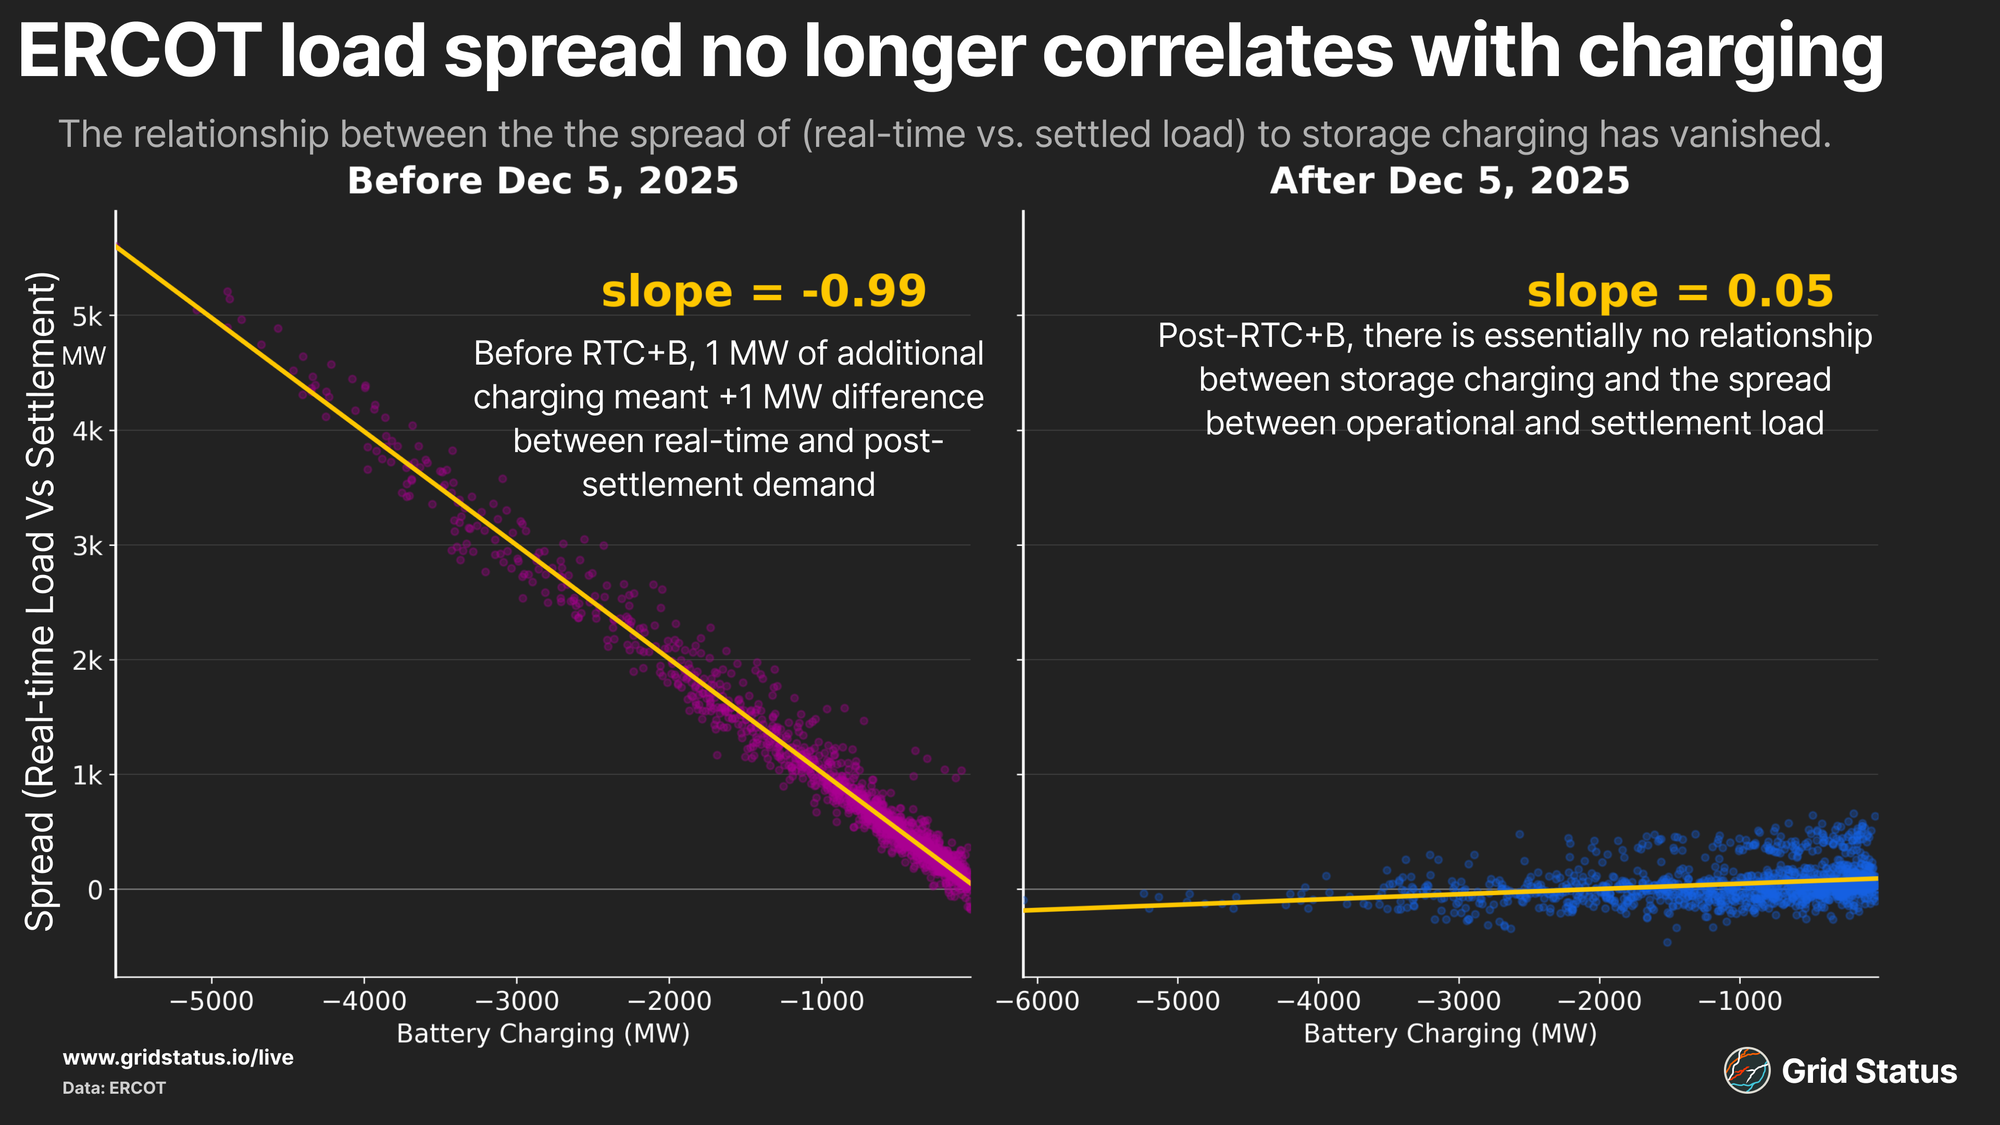
Cost allocation is complicated, and what different loads should pay is a hot topic. As net consumers of electricity that also play the role of generator (until they can't), batteries are tricky. Whether they're a generator, load, or transmission asset depends on the particular context of a given moment or program. While the integration of storage is advanced in multiple markets, this won't be the last time this dynamic shows up in the data as the technology expands into additional ISOs.
Trying to Figure it Out
The biggest RTC+B data updates happened more than two months ago, but reverberations through ERCOT’s reporting products have been ongoing. Most recently, the aforementioned 60-day data was released, although not without issue, as ERCOT had to issue multiple updates and corrections. As with 12/5, the 60-day milestone saw more than changes to existing reports, but entirely new datasets as well. These fell into two major categories:
- Energy Storage Resources (ESRs)
- Real-Time Ancillary Services
If you’ve been relying on ERCOT’s SCED Generation Resource 60 Day data to track battery activities in real-time, now you’ll have to do it in the SCED ESR 60 Day dataset, and the same thing goes for the day-ahead.
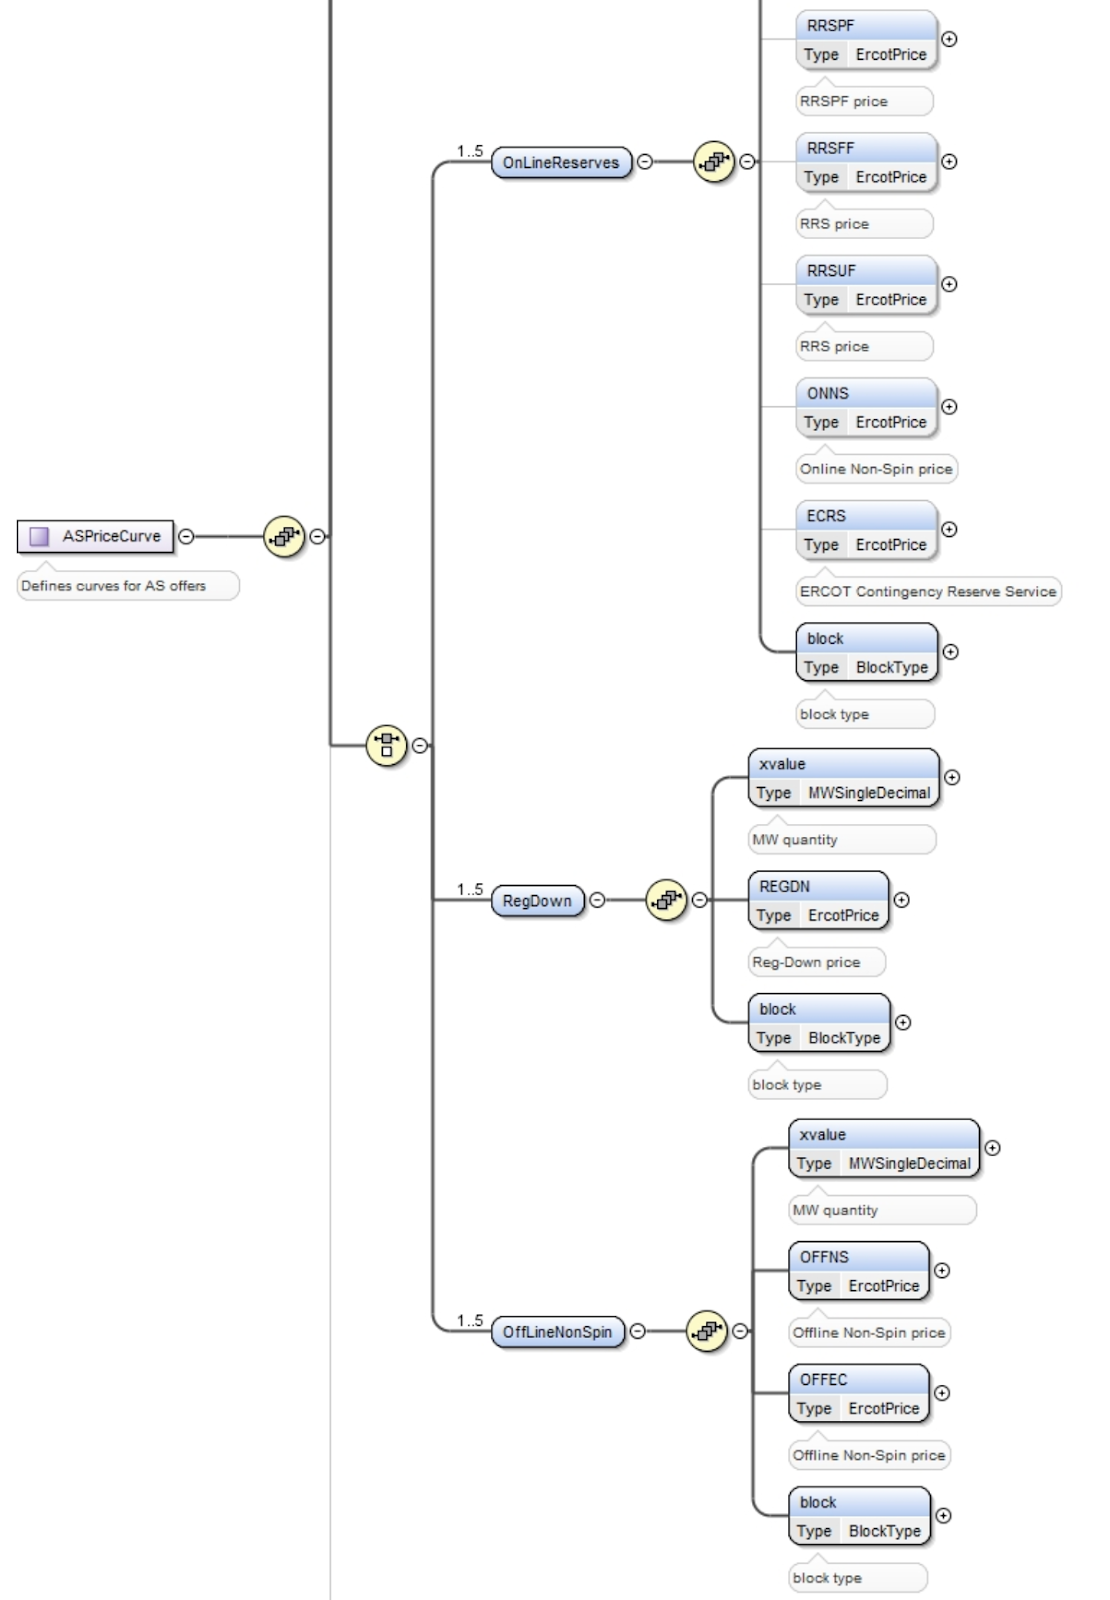
With real-time co-optimization and ancillary service offer action in SCED, we also saw the addition of ancillary services 60-day SCED datasets, such as:
ESRs got a new cut at day-ahead ancillary service offer data as well, where previously they were included in both the generation and load resource files. Ancillary services data is obviously key to RTC+B, and one of the biggest changes to existing data structures was splitting the old as_repsonsibility columns into as_awards and as_capability. Previously, QSEs managed AS obligations across their portfolio, but with the move towards individual unit assignment directly out of ERCOT’s processes, the underlying data was also able to become more granular.
While we’re on the topic, a brief diversion into one of the more annoying setups out of ERCOT’s files. To get lightly data-technical for a moment, primary keys to identify unique rows of tabular data are critical to most storage structures. Often, you can do this with just a time interval (like a systemwide load dataset), or a time interval plus one other column (LMP datasets where you need time and a location). In rarer circumstances, it becomes more complicated, and you might need a handful of columns to get true uniques. And sometimes, unfortunately, the data arrives in a way where you can’t immediately tell rows apart at all. This is the case of AS Offers in the 60-Day data from ERCOT.
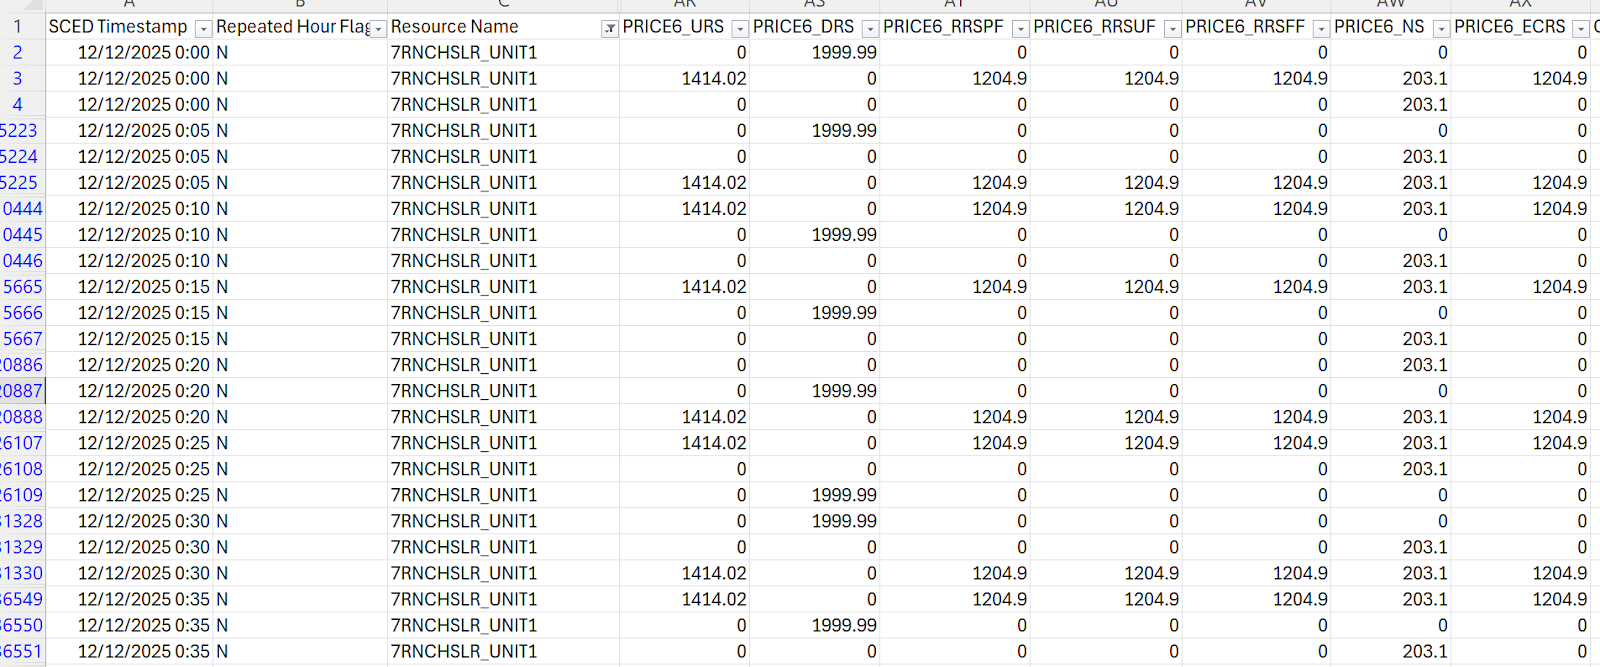
I’ve hidden some rows and filtered to a single resource to make it clearer, but the “raw” data from ERCOT shows 3 (mostly 3, sometimes 2) rows where the SCED Timestamp and Resource Name are the same, but the values across ancillary services change. So which row is the “real” one? They all are.
The answer lies in how ancillary service offers are actually submitted to ERCOT by resources; they fall into 3 buckets: reg down, online, and offline.
From here, you should be able to figure it out. 0 values aren’t really 0, they’re more like null. The row that has a non-0 value for PRICE6_DRS is the regulation down offer, the row with values for RRS contains the online services, and then both Non-Spin and ECRS can support offline offers. This structure is further corroborated by the SCED AS Offer Updates in Op Hour 60 Day data, which reports three ancillary service types: REGDN, ONRES, and OFFNS.
These aren’t all of the changes RTC+B ushered in, but they’re some of the biggest out of the recent data releases. For the full rundown, you can check out our RTC+B Dataset Changelog, which has hopefully seen its final updates.
Outro
We’ll keep digging into the data and tracking how unit reporting evolved as the system settled into RTC+B, but don’t get too relaxed. Over the next year or two, we should see a new ancillary service in ERCOT and continued tweaking (slide 10) of the ancillary services procurement methodology, with the annual process already changing for 2026 with the implementation of a probabilistic model for ECRS and Non-Spin volumes. Plus, there’s the ongoing large load interconnection stakeholder process and plenty more to track in the market.
We’re also always posting new market notes and analysis over at Grid Status Insights. Check it out, and if you’re on a higher-tier plan, you can schedule a call with our analysts to talk about anything you see there, here, or on the markets in general.
A few of us will be at ERCOT’s Innovation Summit in March, so feel free to reach out if you want to meet in person to talk energy and data.