SPP Expansion Provides a Blueprint for the Future of the Grid
The U.S. power grid is so complex that trivial changes are hard to comprehend and harder to implement. Yet, a recent announcement by the Southwest Power Pool (SPP) is closer to historic than trivial, making it a good case study for a more integrated and efficient grid.

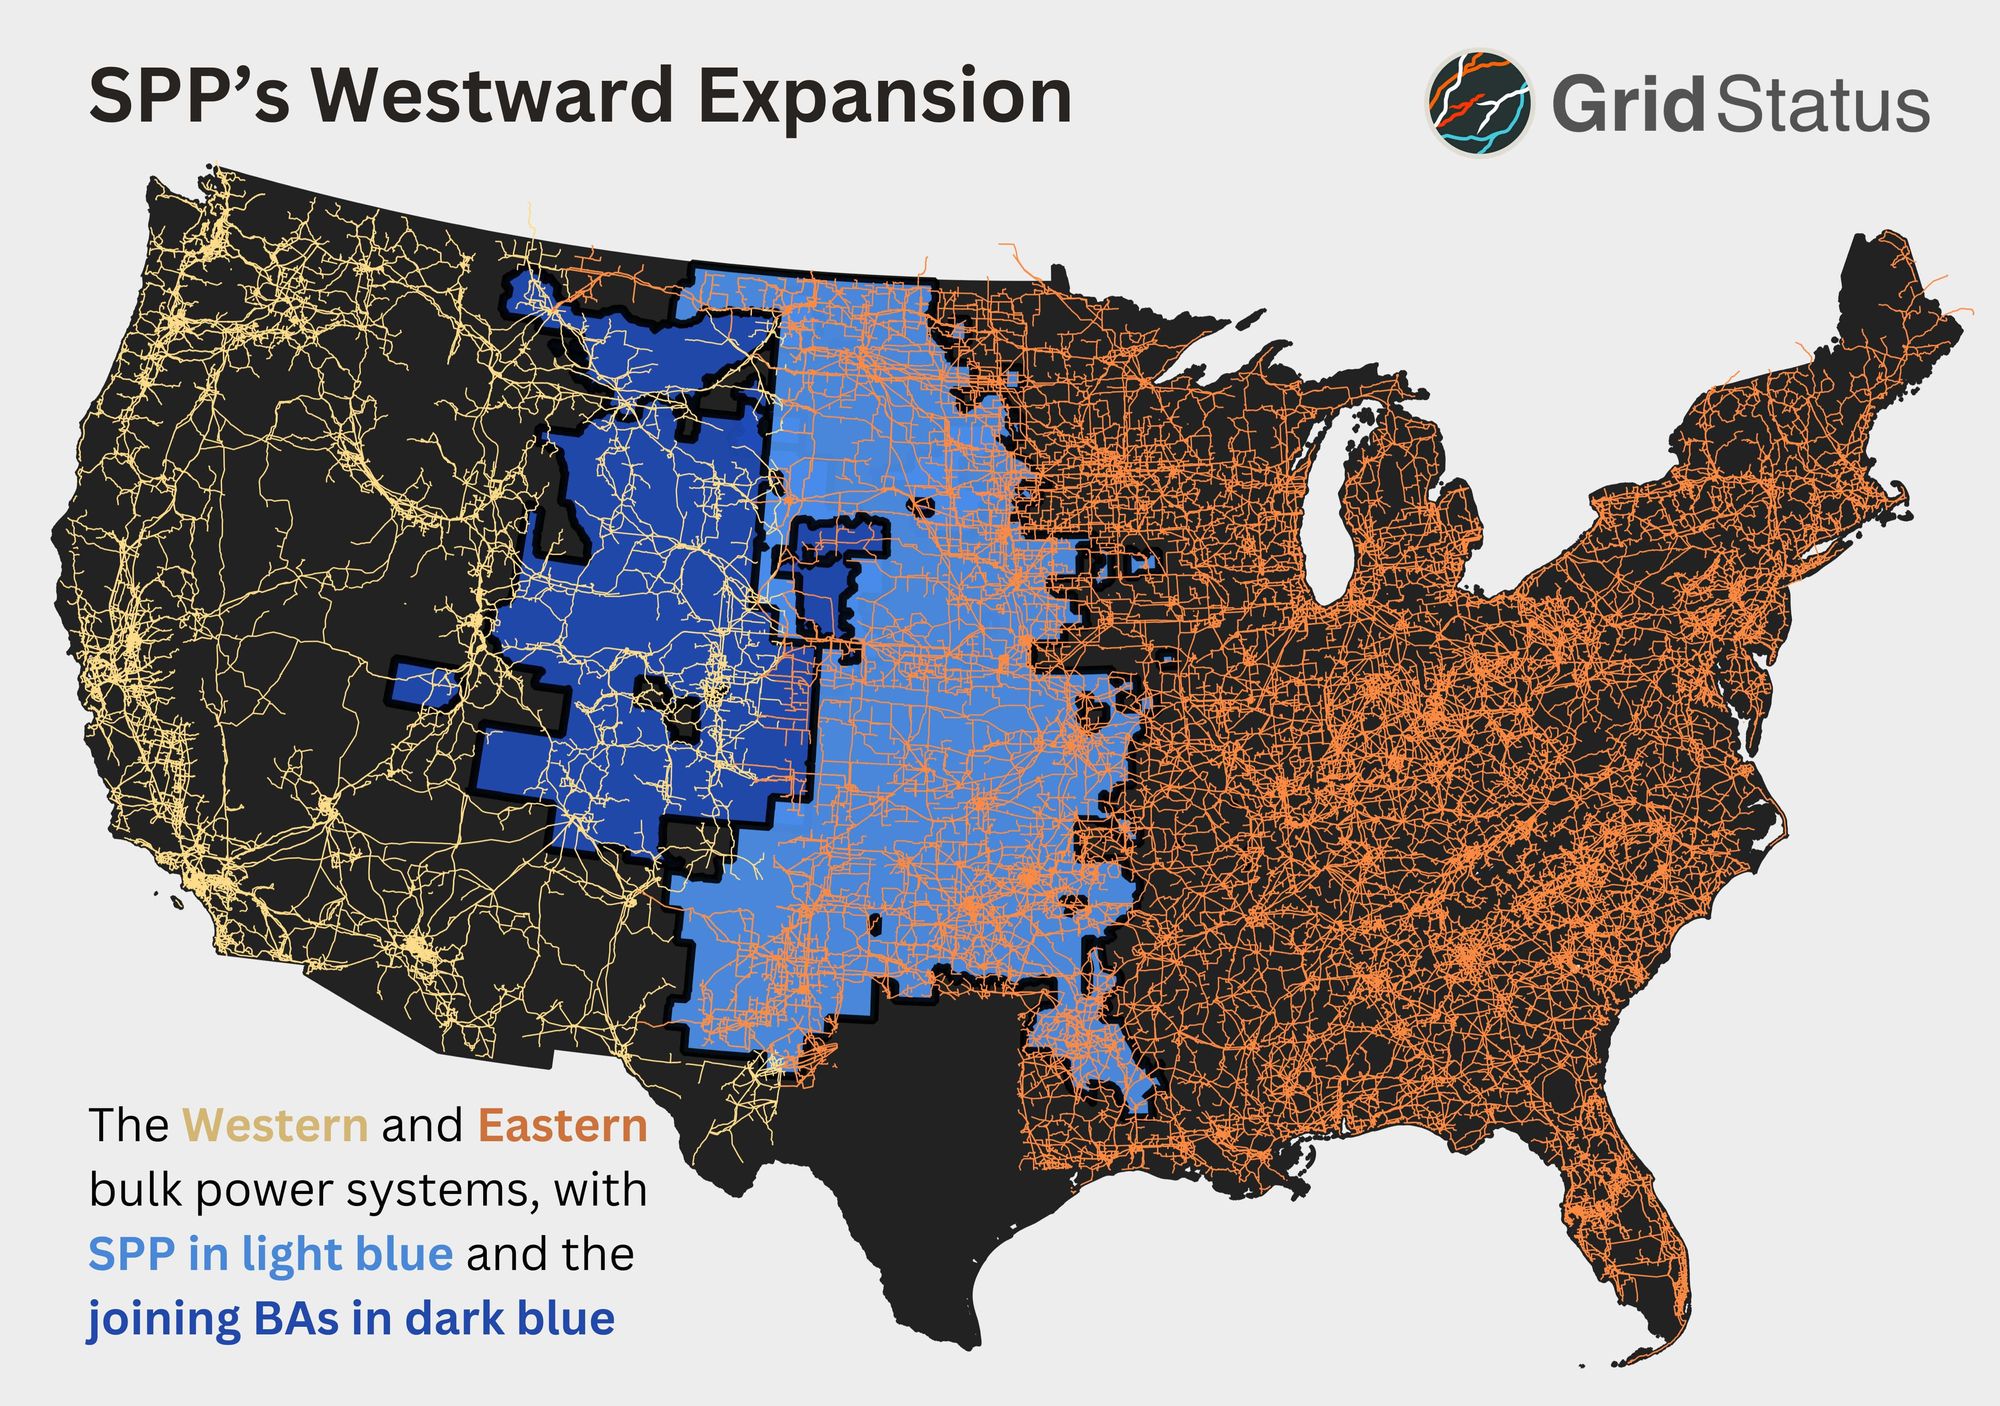
SPP, the organized electricity market dominating the Great Plains, announced a substantial expansion of their footprint to the West earlier this month. When it goes into effect in early 2026, it will be the largest RTO/ISO expansion since MISO South in 2013.
What made this announcement particularly notable is that the joining entities mostly operate in the Western Interconnection. This expansion makes SPP the first RTO in the US to bridge that gap.
Given the importance of this change we wanted to explore the interchange, fuel mix, and emissions data for relevant Balancing Authorities (BAs) using the new EIA Data Browser on Grid Status. As we will show, greater connectivity and unified planning over the patchwork of the West can help to facilitate a reduction in both power prices as well as total emissions.
Grids in Transition
Two new Balancing Authorities are joining SPP, WACM and WAUW. WACM is managed by the Rocky Mountain region of the Western Area Power Administration (WAPA) while WAUW is under the control of the Upper Great Plains region of WAPA. WAPA itself was originally created to market and transmit electricity from federal hydropower facilities, but by developing into BAs these regions became more entangled in the wider resource mix of the west.
Fuel mix is available for every BA in the EIA-930 data, whether interesting or not. In the case of WAUW it’s only interesting in a historic context - it looks like an isolated grid from the 1900s, totalling under 100 MW of pure hydropower - directly in line with the original WAPA mission.
WACM vs SPP Fuel Mix
WACM, however, is more interesting, managing a larger area with the resources of multiple entities, and is a great representative example for the continued evolution of the grid.
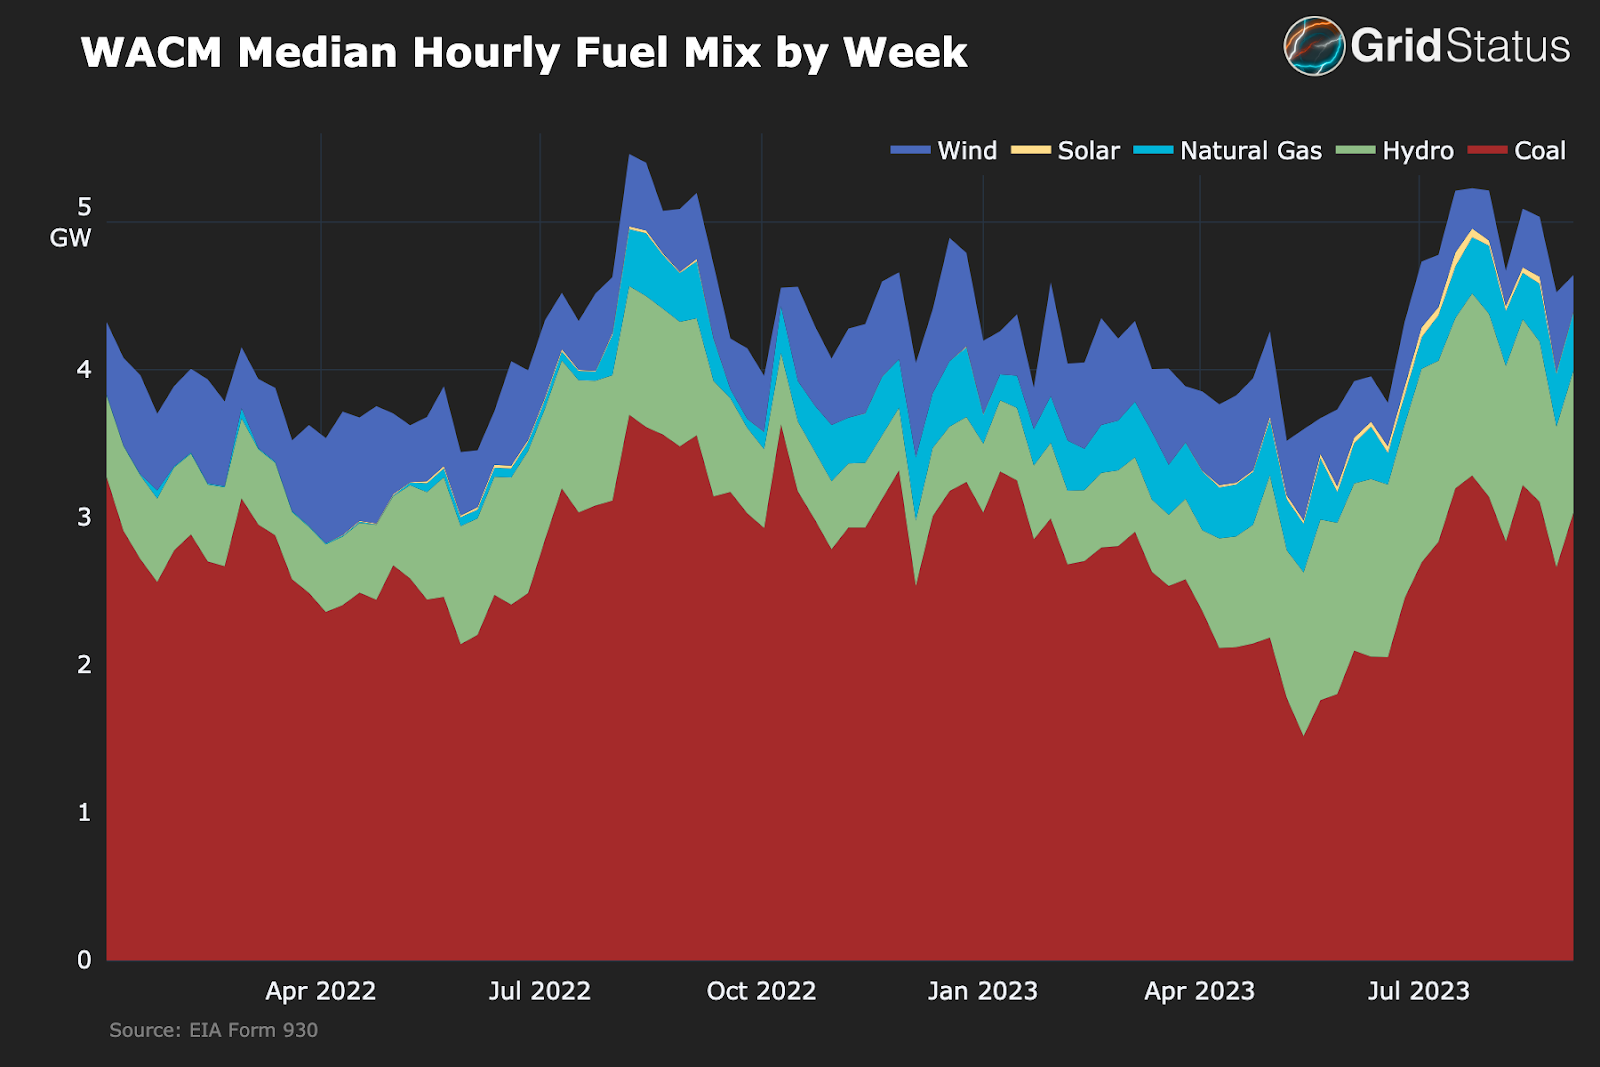
If you squint a bit, the contribution of different resources to WACM does not look altogether dissimilar to where SPP itself was only 12 years ago (albeit with a greater amount of hydropower in place of natural gas). Just over the last year you can see the natural gas generation begin to grow and coal begins to drop off somewhat. Hydropower helps in displacing some coal - the West had an excellent winter from a water-recharge perspective - but you still see natural gas running more frequently as demand has also picked up.
For comparison, here’s SPP’s fuel mix over the same time frame and also from the EIA data (which does have some inconsistencies with the ISO-reported values). SPP has a lot more wind, but also far more natural gas.
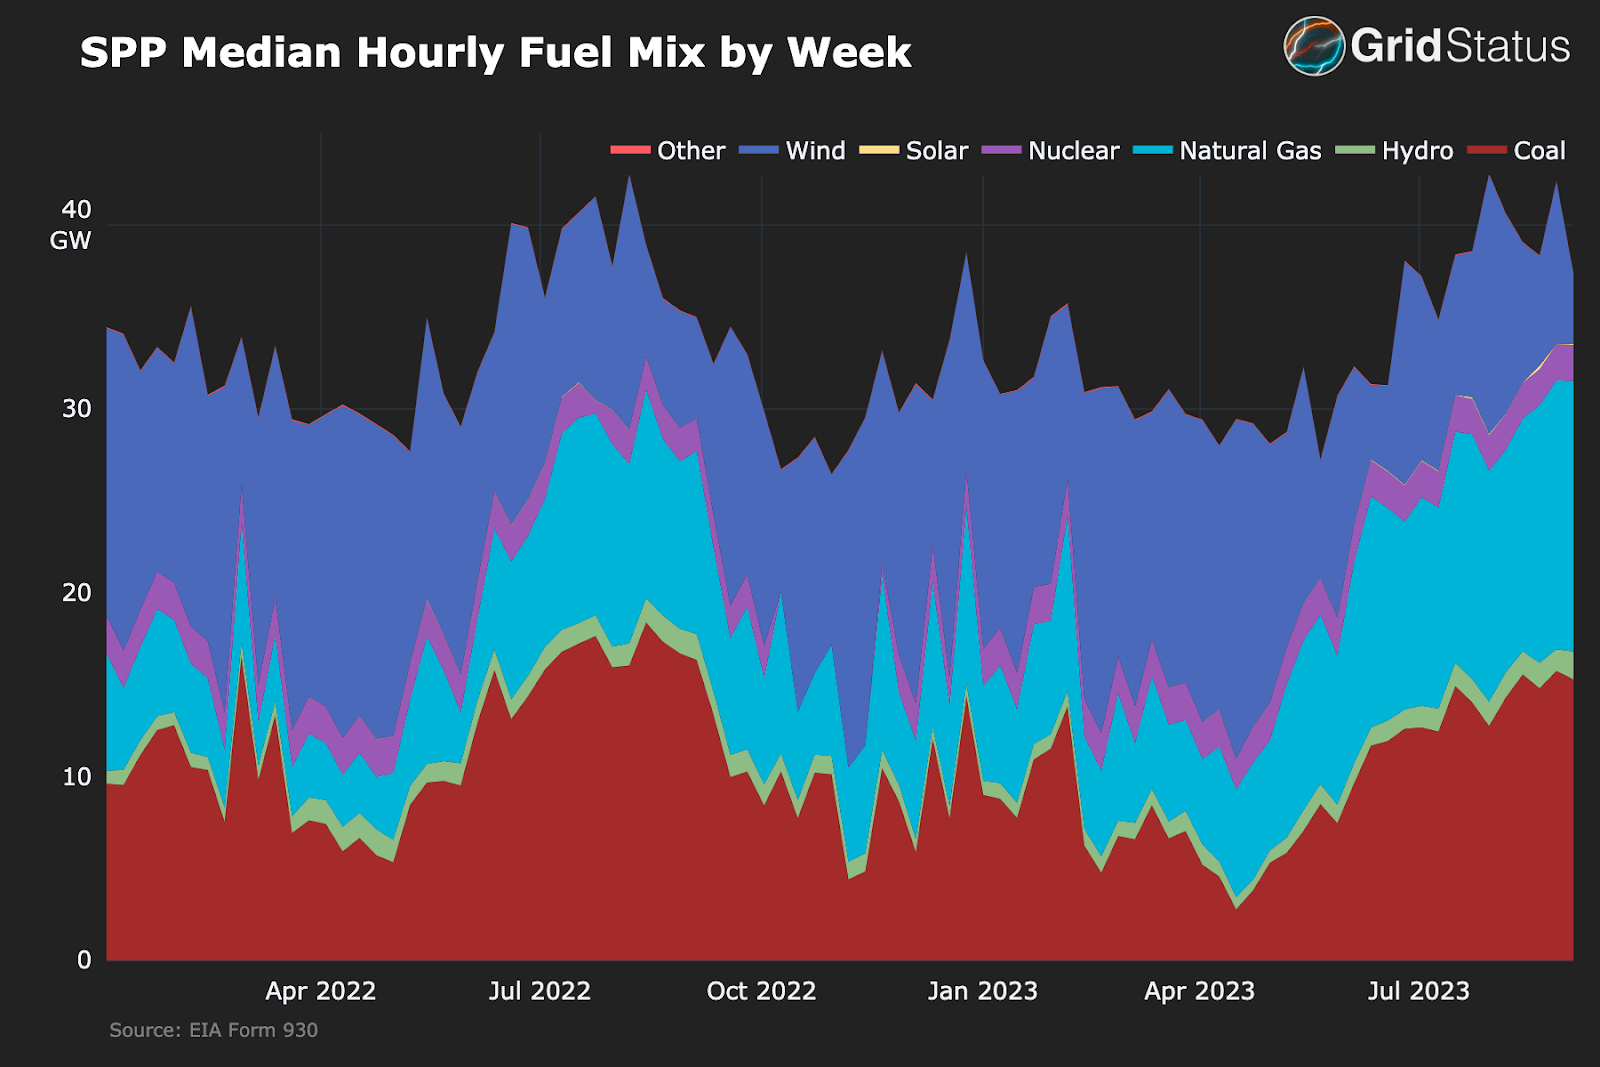
SPP represents something like what we may see WACM transition towards - an increase in wind and solar, along with some natural gas, accompanied by a reduction in coal’s share of generation.
Entry into a coordinated transmission process at the RTO level could accelerate the retirement of coal resources and incentivize more rapid development in relatively wind, solar, and geothermal rich areas of the BA’s footprint.
WACM vs SPP Emissions
The preponderance of coal in WACM is also borne out by the BA’s CO2 emissions factor from the EIA.

In comparison to SPP, generation in WACM’s footprint not only emits substantially more CO2 per MWh of production, but is in a smaller range due to the relatively low penetration of variable renewables such as wind and solar.
WACM vs SPP Pricing
Additionally, there is increased potential for trading between the markets, both via the limited interconnection capacity of today as well the transmission lines of tomorrow. You can already look at real time prices today in both BAs to see the impact wind-heavy western SPP could have on coal-heavy WACM. Indeed, this process is already ongoing - in 2022, 400 MW of coal in WACM retired.
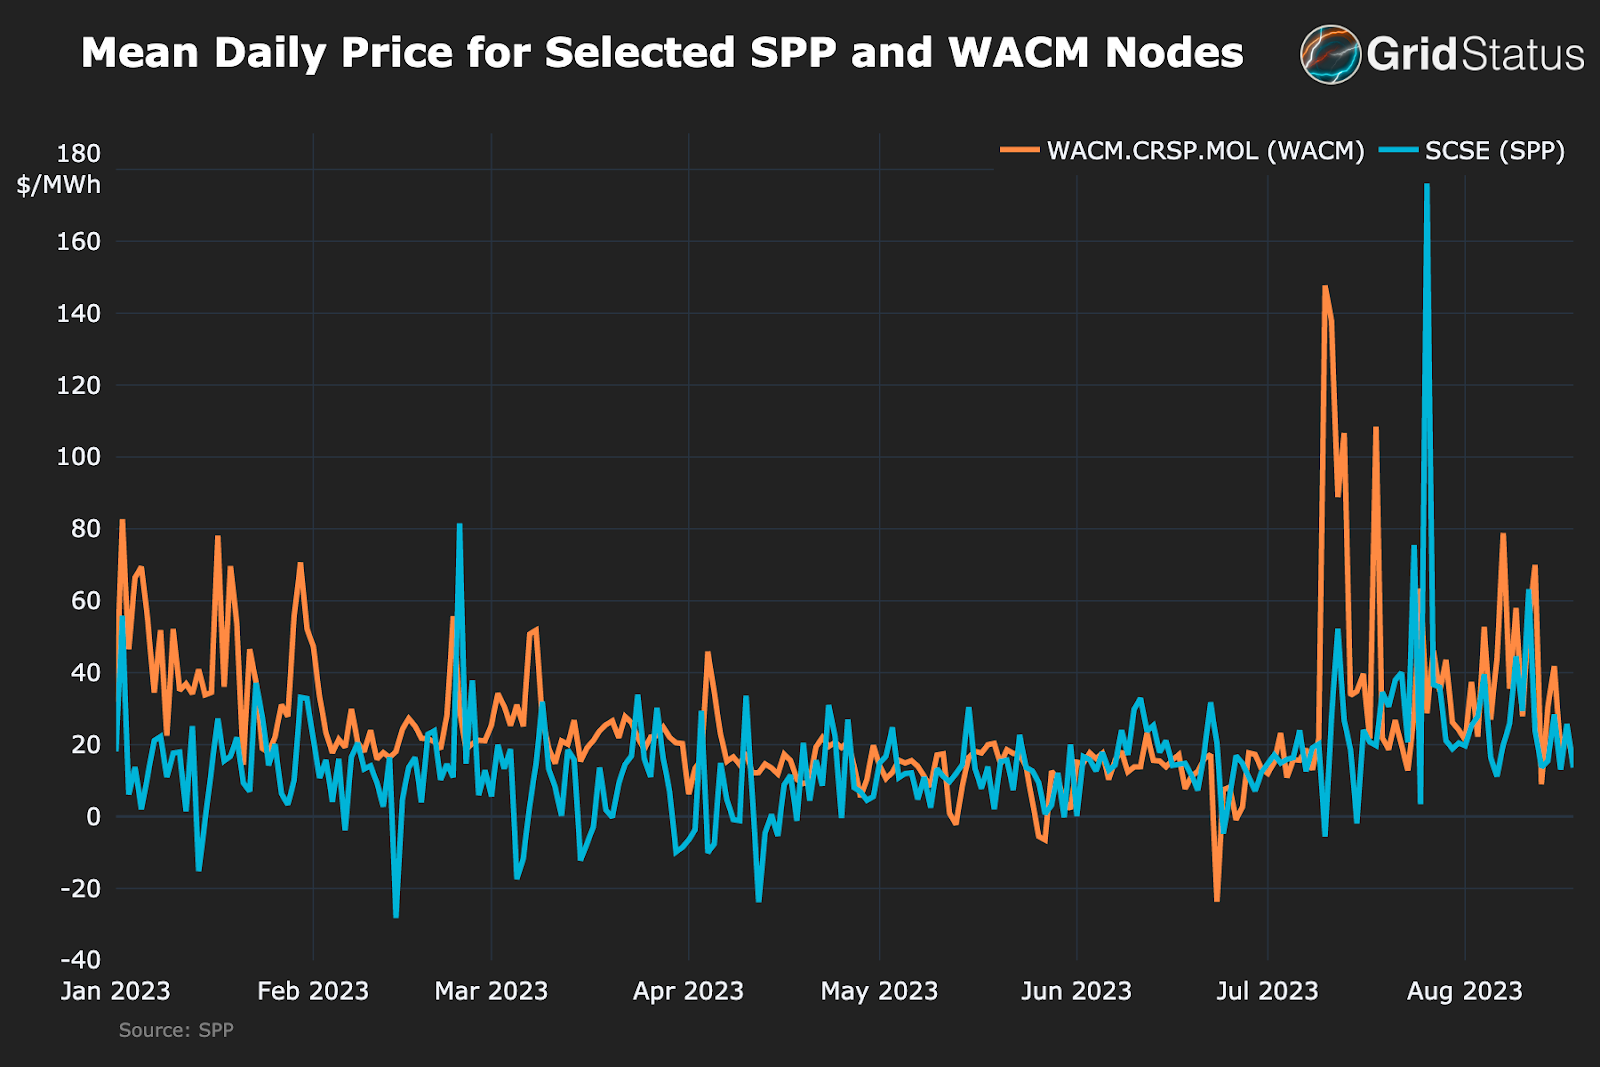
SCSE’s mean daily price is often lower than the WACM node, particularly during the time of year in which hydropower resources are in the part of their annual cycle waiting for “recharge” from snowpack and the “missing” hydropower generation is replaced by technologies that have fuel costs. This bodes well for the transition of WACM, and in these graphs you can see a blueprint for the transition of coal heavy regions.
With any increase in regional connectivity SPP’s extant wind resource can help to drive down both prices and emissions during the annual “off peak” for hydropower, which lines up well with the seasonal pattern of stronger wind.
Bridging the Gap
When this change goes into effect, SPP will be the first RTO to breach a historic barrier in the US: coordinated operation across two grids.

It may surprise some readers to discover that the US consists of not one, but three “grids”. Other than Eastern and Western Interconnections, the third is ERCOT’s, which encompasses most, but not all, of Texas. There are historic and political reasons for the three grids, which we won’t dive into here (although check out this fun Planet Money episode for a taste of the ERCOT grid).
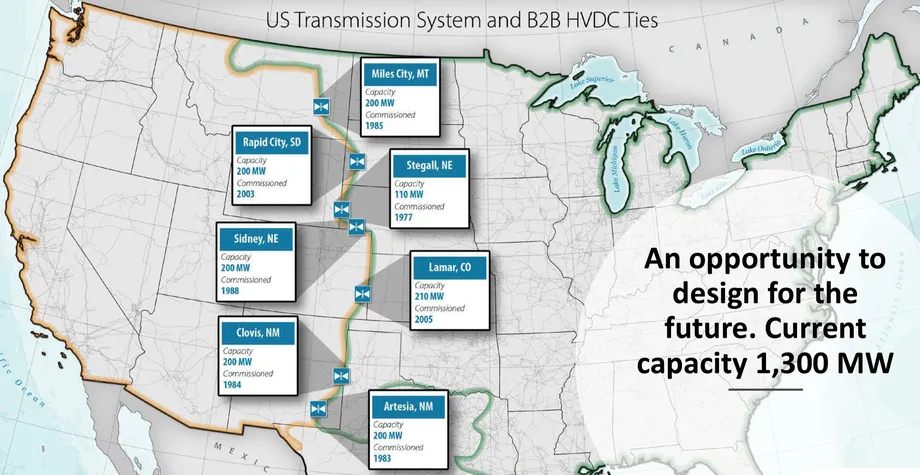
Per NREL’s Seams study, there is only ~1,300 MW of direct connection between the eastern and western grids. To describe the technical obstacle very simply, while the two grids operate at the same 60Hz frequency (unlike Japan), their actual AC currents are not in rhythm, so these HVDC connections are the only major pathways.
Some of this interchange is facilitated through lines with endpoints in SPP’s footprint, and with the addition of EIA-930 data to Grid Status, you can explore the fuel mix, emissions, load, and interchange between SPP and the two joining BA’s, WAUW and WACM.
Interchange Trends
Bringing balancing authorities together creates the potential for further coordination. At the simplest level, a single operational entity could help to optimize extant flows between the three BAs. With that in mind, let's look at the interchange between these regions for a sense of how it may evolve over the coming years.
Southwest Power Pool (SPP)
Let’s take a look at trends over the last several months, starting with SPP’s interchange with the joining entities that are in the Western Interconnection.
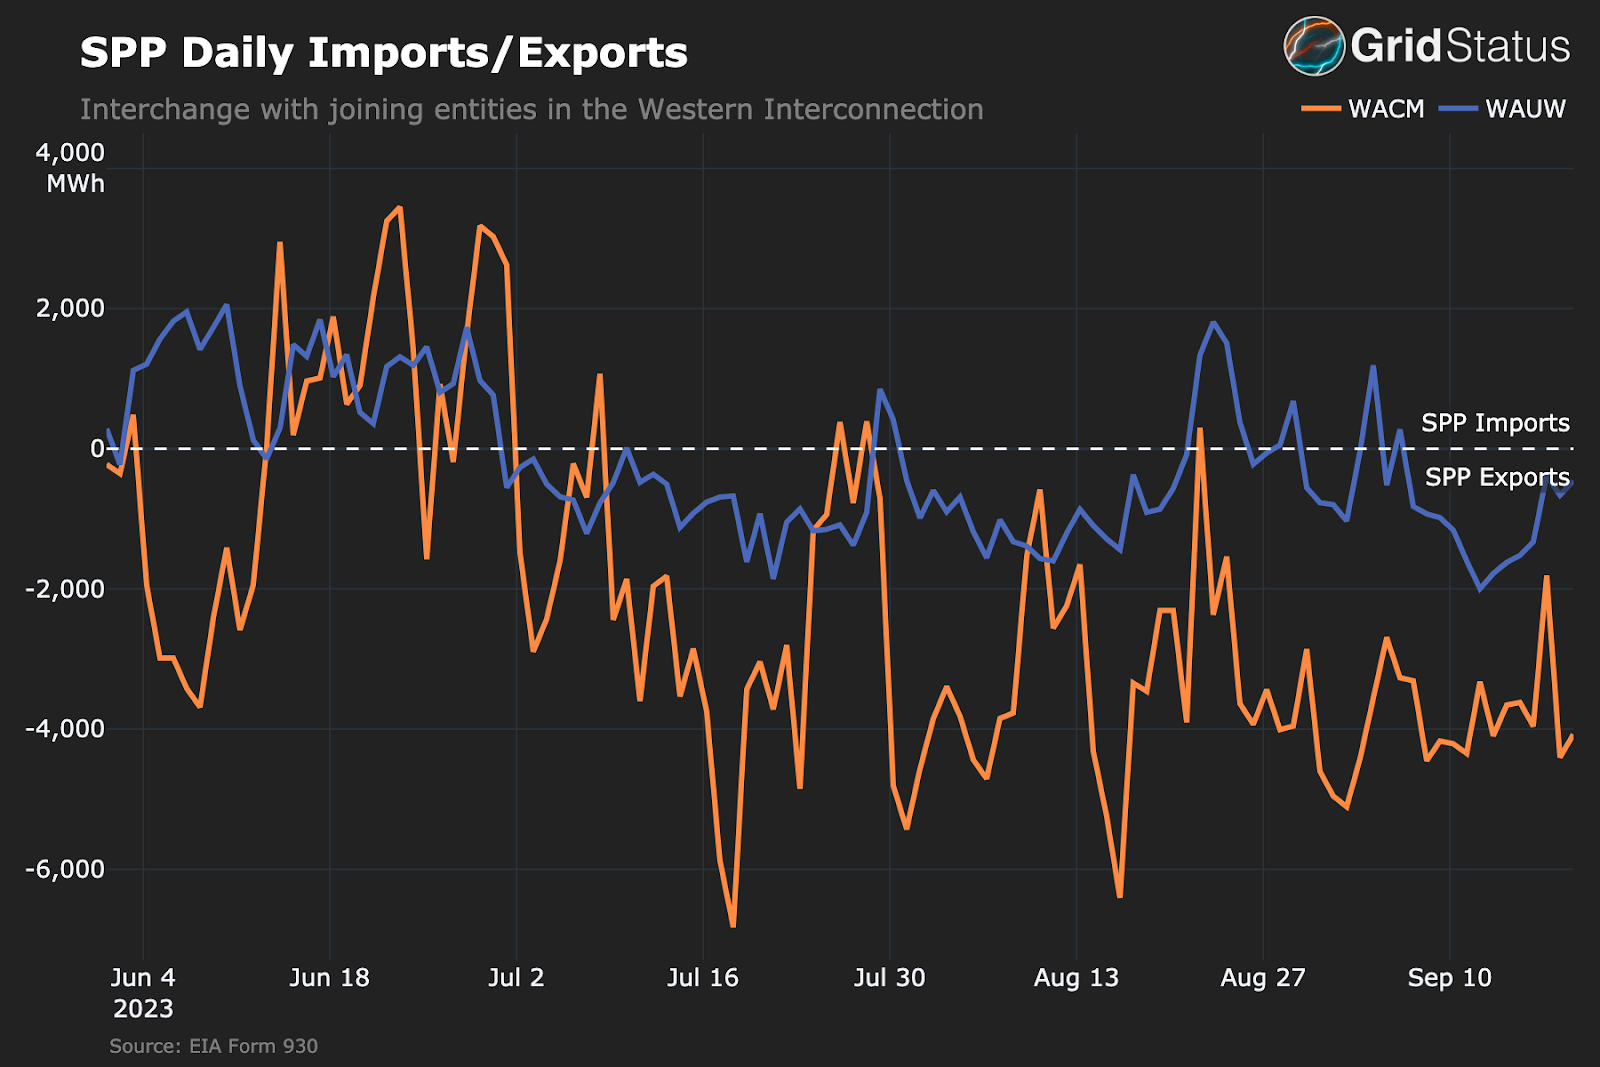
Of the two BAs, WACM has substantially greater daily interchange. During the period in the graph, WACM imported a total of 245 GWh from SPP, while WAUW imported only 23 GWh. WACM also has the largest one-hour peak transfer, with 486 MWh being imported from SPP. This is much larger than the peak 144 MWh being exported from WAUW to SPP.
Once these 2 BAs join they will become the interface between SPP and the rest of the west, substantially expanding the operational surface area between western and eastern markets, if not the physical capability. So, let’s look at the interchange from the perspective of these two BAs.
Western Area Power Administration - Upper Great Plains West (WAUW)
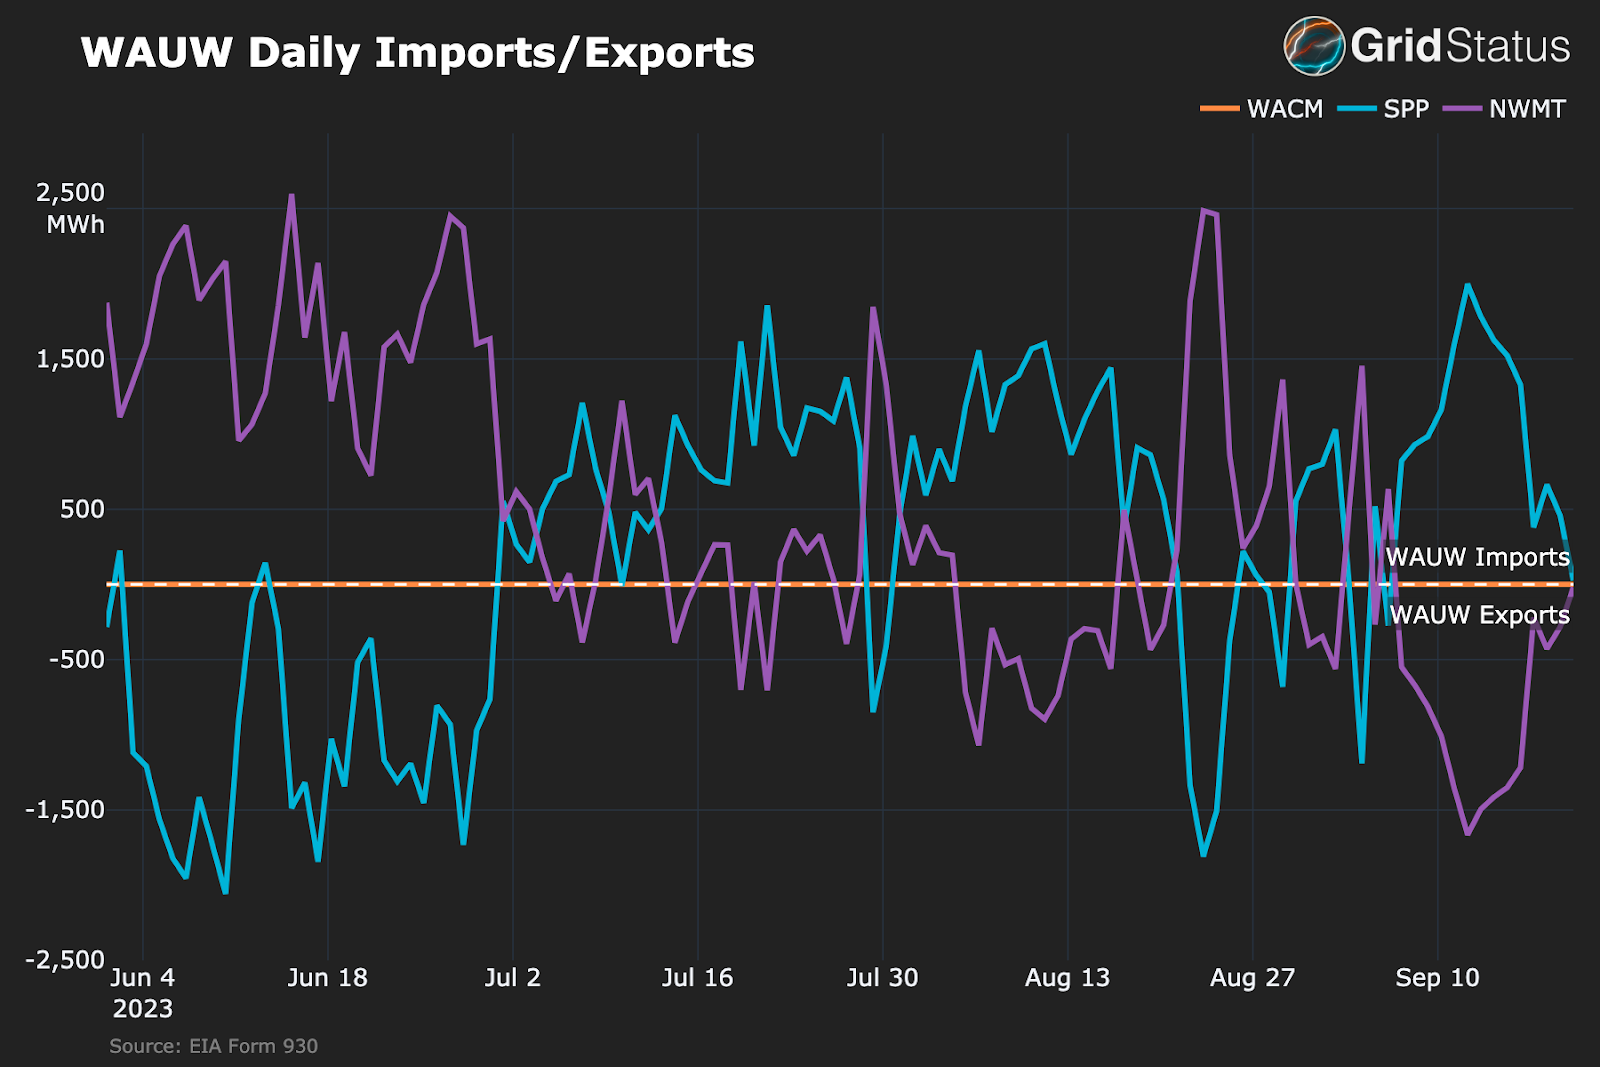
Perhaps to be expected from the smaller SPP flows, WAUW has a fairly straightforward set of interchange partners and generally a low volume of total interchange. Geographically this makes sense, as WAUW is the more isolated BA in the northerly reaches of the mountain west.
WAUW does show an interesting pattern: interchanges through the region between SPP and NWMT are near mirror reflections of each other. When SPP is importing from WAUW, NWMT is exporting into WAUW. This could reflect wheeled power or other obligations and speaks to the complexity of these systems and difficulty in assigning providence to any set of electrons on “the grid”.
Is SPP importing from WAUW or NWMT? Of course, neither is exactly true, as the entire interconnected machine must be kept in near perfect sync with the whims of demand at all times.
Western Area Power Administration - Rocky Mountain Region (WACM BA)
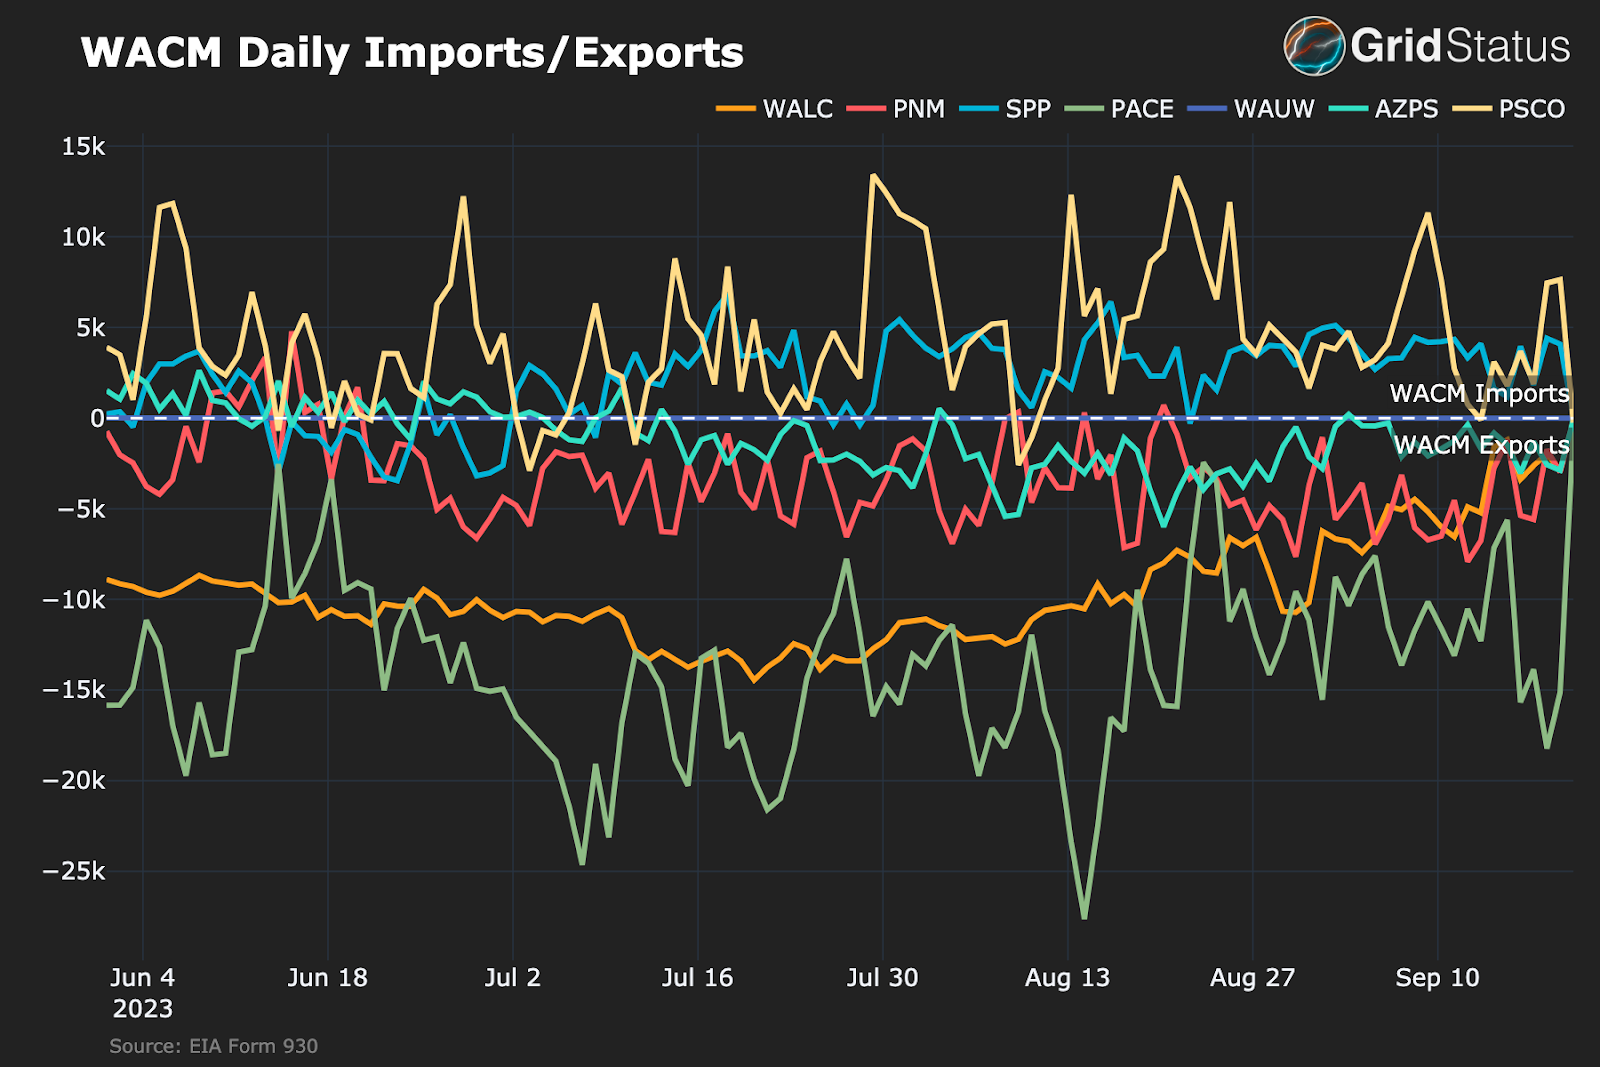
By contrast, WACM has substantially more interchange with a larger set of partners, fitting for its central location in the West, covering a more integrated and populous region than WAUW. Here we see very steady exports to WALC, which makes sense, as it is the Desert Southwest region of WAPA. PacifiCorp East (PACE) is also a major importer, although less steadily. The Public Service Company of Colorado (PSCO) is the largest exporter into WACM, which partially surrounds PSCO geographically. Additionally, PSCO is owned by Xcel, which has a much larger footprint than just Colorado.
Through the prism of interchange, WACM seems to be a bit of a switching yard through which substantial amounts of power in the mountain west flow.
Operational Consolidation In a Fractious Region
While the eastern grid is dominated by wholesale markets, most of the west has, to date, resisted consolidation. However, electric grid unification in the Western United States stands to benefit participants financially. In 2020, Brattle estimated $49M in annual savings under a potential SPP RTO West.
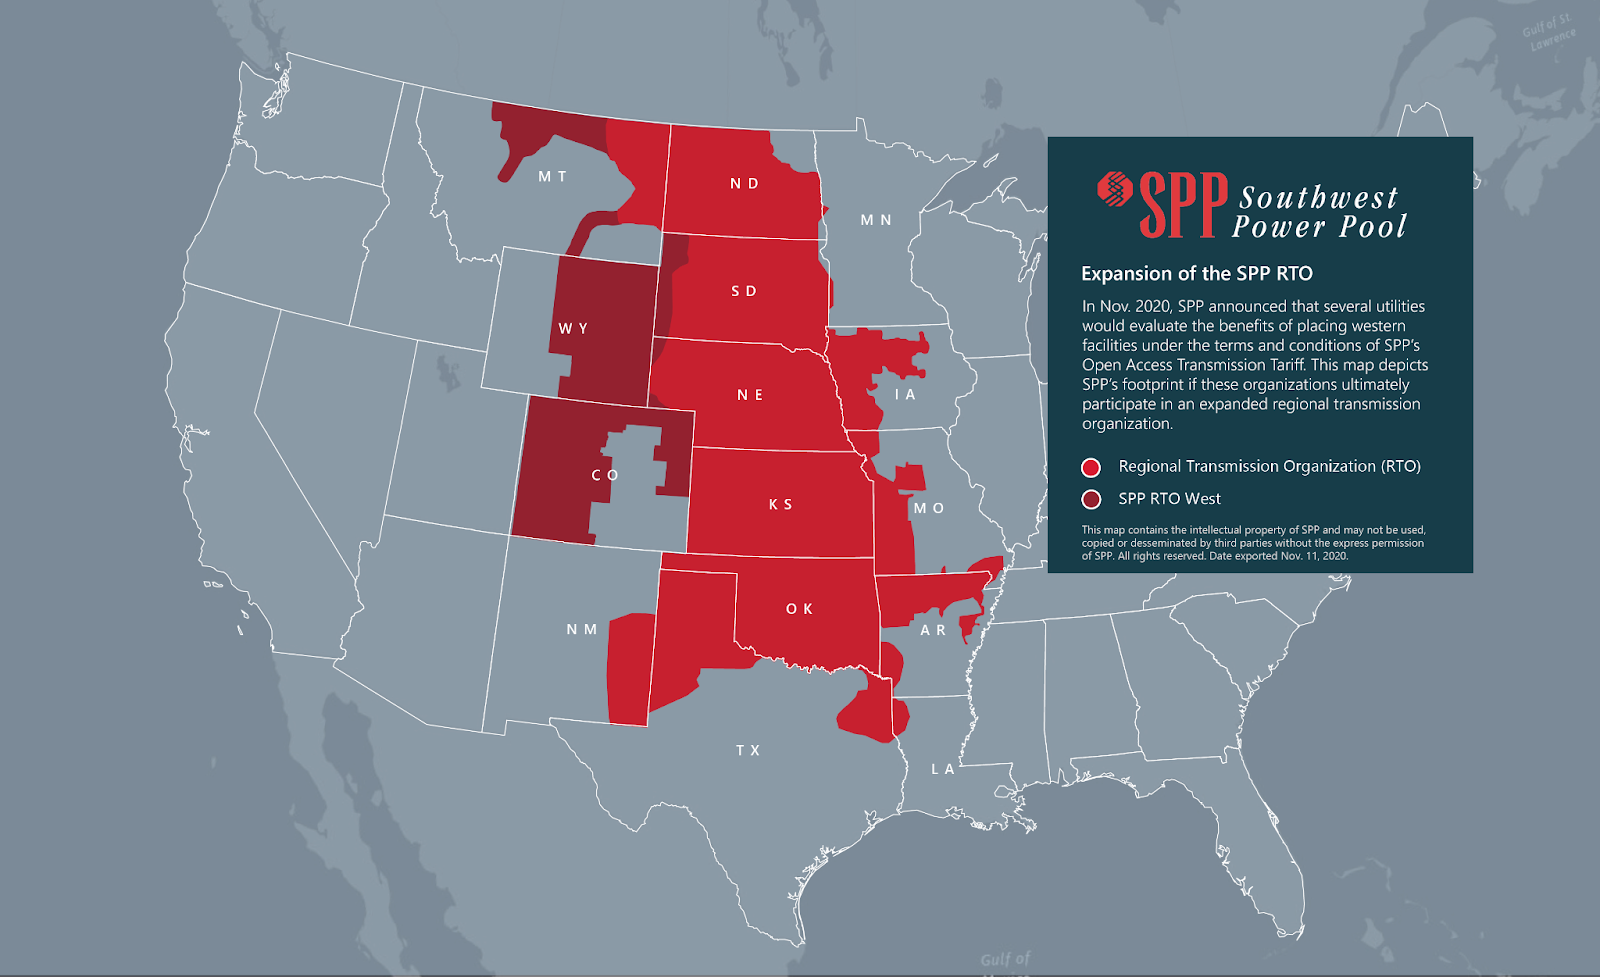
A Regional Transmission Organization (RTO) or Independent System Operator (ISO, you’ll see the terms used interchangeably) is a non-profit entity set up to run and manage the grid in “deregulated” and competitive market regions. Instead of a single utility owning all the power lines and power plants, deciding what facilities to turn up, down, or off, in an RTO the system is managed through price signals in various markets with different entities owning generation and transmission. “Open access” to the transmission system was a key regulatory change several decades ago which made this construct possible.
The most basic market in an RTO/ISO is Locational Marginal Prices (LMP), which is the cost of the next MWh to serve the grid. With proper oversight mechanisms this leads to generators bidding in their marginal costs, creating an orderly and efficient supply stack - the “merit order”. This is one piece of the topline dollar benefits, another is the economies of scale derived from centrally managing a larger and more diverse pool of resources.A larger coordinating entity can also take advantage of inherent regional efficiencies: the great plains are excellent for wind, the southwest for solar, pacific northwest for hydropower, and so on.
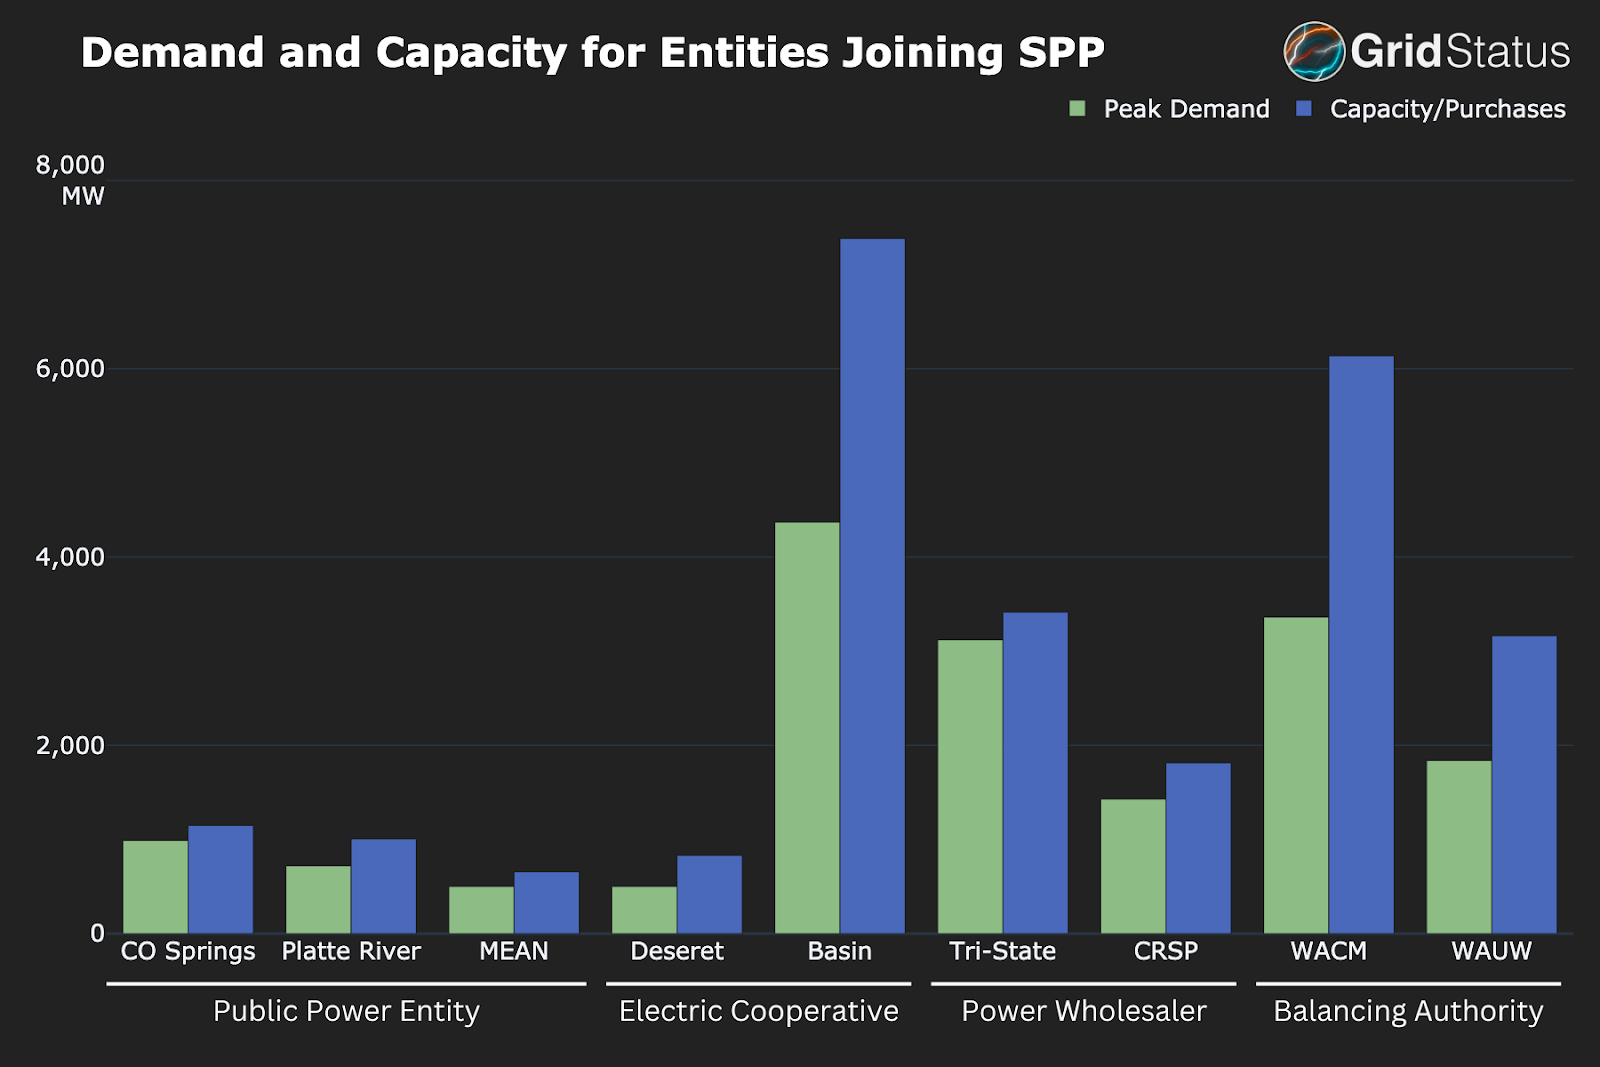
In addition to the two BAs, 5 other entities are joining SPP. The utilities announced to be joining SPP already operate at various stages along the progression to a larger coordinating authority (indeed, some of these entities already have eastern assets in SPP). At the smallest end, there are public power entities such as municipalities, ranging in size from one town to 70 communities to cooperatives spanning a larger territory, owning more generation and transmission themselves, and finally power wholesalers, which may own substantial generation and transmission assets and even manage chunks of the grid called Control Areas as Balancing Authorities (see map of all US BAs here).
In one sense, these utilities joining SPP is simply the continuation of the same trends seen elsewhere over the past 30 years, but this is a particularly notable step in that it brings consolidated operational management to a substantial portion of both the eastern and western interconnects.
Wild Wild West
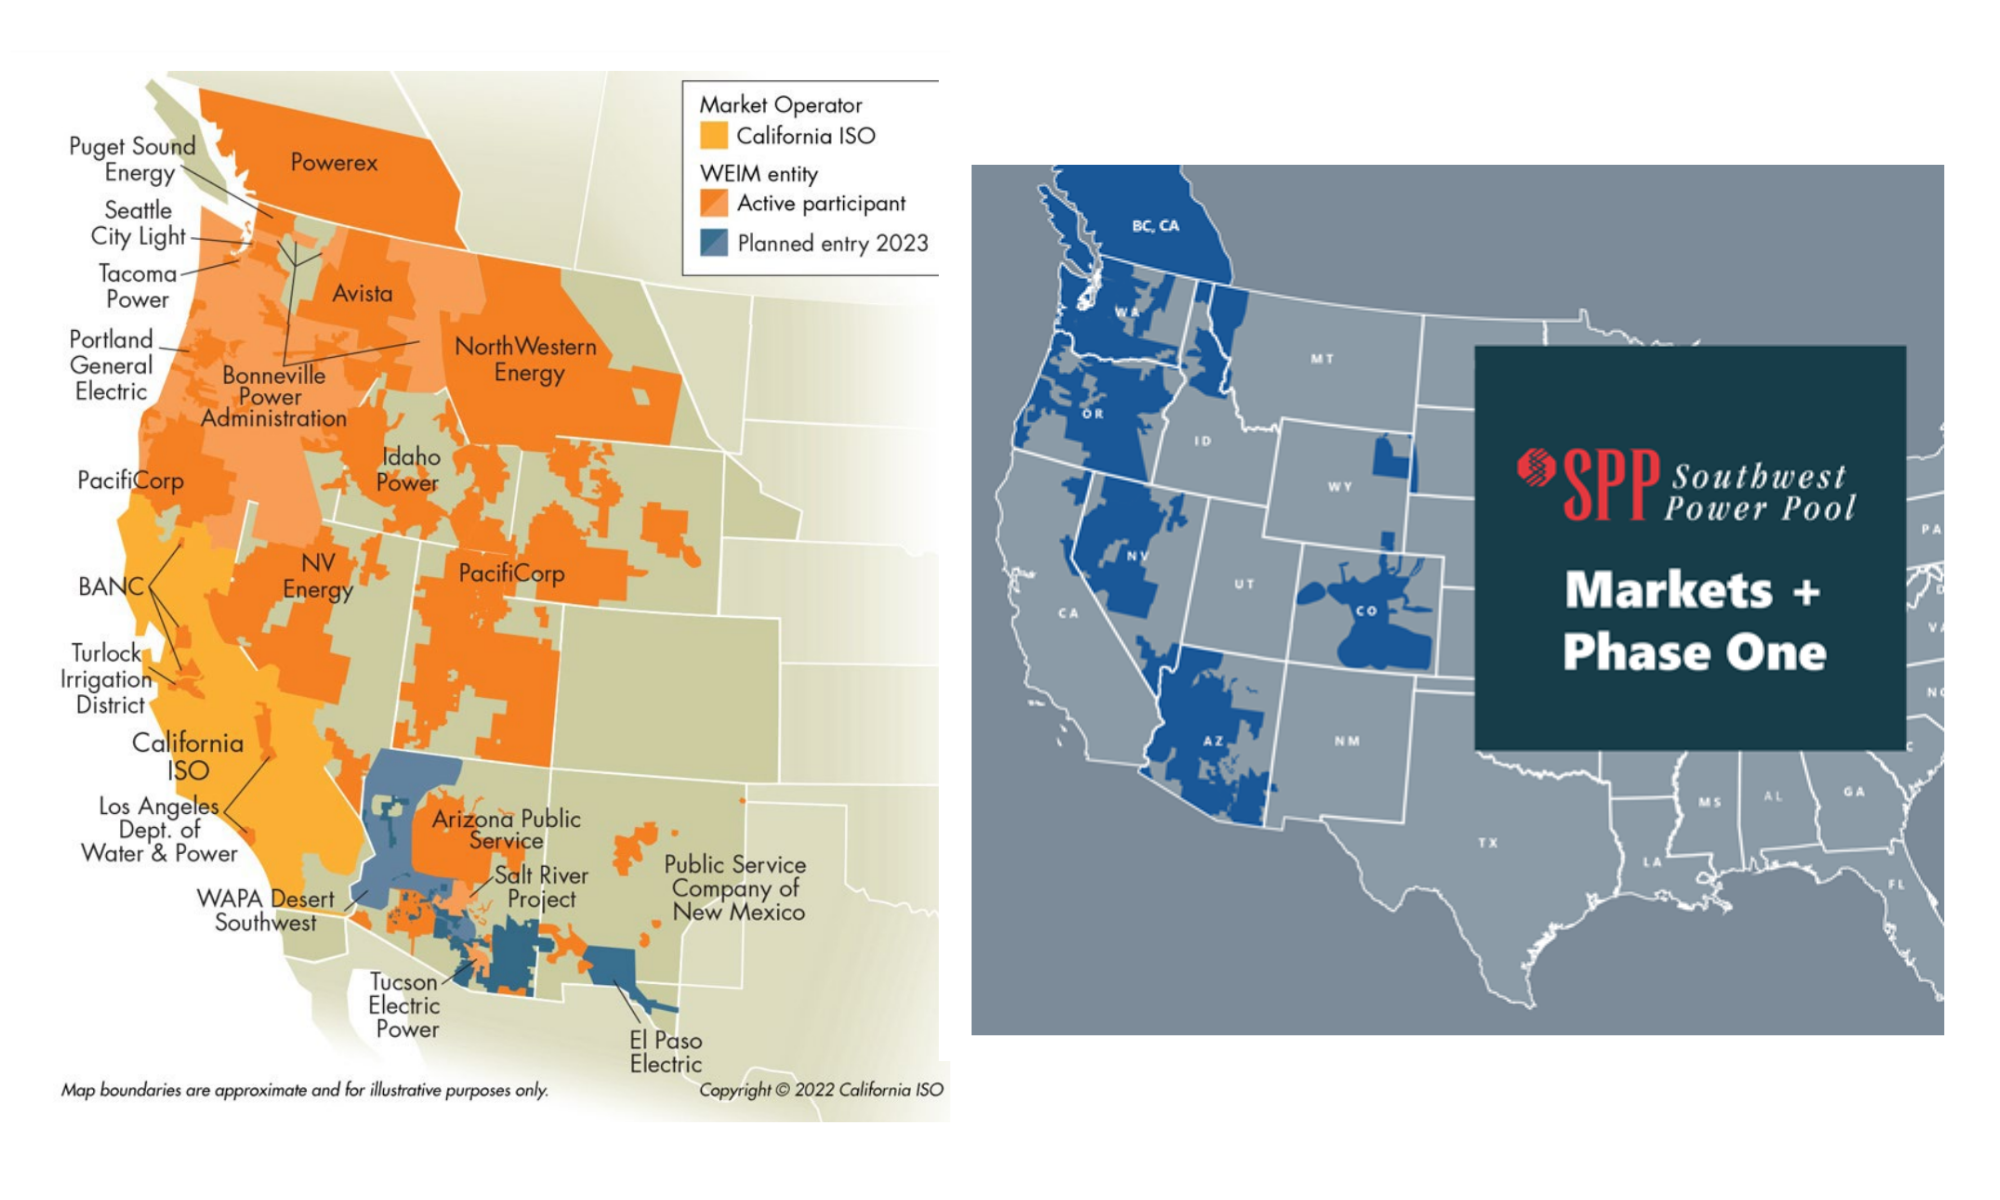
The important context to all of this is the ongoing struggle for the soul of western power markets. SPP’s RTO West is only one of many options, both extant and in development. Currently, in the west, CAISO, which covers most of California, is the only ISO/RTO. The remainder is an assortment of cooperatives, federal entities, vertically integrated utilities, IPPs, and municipals, among others. Today, both CAISO and SPP have at least real-time constructs that cover most of the west. CAISO manages the Western Energy Imbalance Market (WEIM), which is quite large, with 21 members, an estimated savings of $4.2B since it was put into operation in 2014, and partial day-ahead coverage. SPP’s Western Energy Imbalance Service (WEIS) was a comparative latecomer, beginning operation in 2021. All of the western entities joining SPP in 2026 are already participating in WEIS.
With real-time trading established, the next goal has been more fulsome day-ahead participation and optimization. CAISO’s variant is the Extended Day-Ahead Market (EDAM), while SPP is working on Markets+. Despite over a decade of work towards westward expansion from CAISO it seems possible that SPP has taken pole position.
Unlike the other FERC-jurisdictional ISOs, CAISO is uniquely controlled by California’s legislature. That level of political control has led other potential partners in the west to balk in the past, an issue which the independent SPP does not share. To date, all attempts to pass legislation divorcing CAISO from the legislature have failed. With existing real-time options and new day-ahead proposals on the table, wouldn’t this already mean a full ISO? Not quite. ISOs are involved in transmission planning and approval, resource adequacy, and unification of transmission rates. Generally, those will remain the provenance of member utilities even under stacked WEIM and EDAM participation.
Come early 2024 a major shoe will drop in this ongoing battle, as the Bonneville Power Administration (BPA), which manages more than 17GW of hydropower assets, is set to decide which day-ahead market, if any, they will join. CAISO has long relied upon hydropower imports from the pacific northwest and certainly covets that large, clean, and perhaps most importantly, dispatchable, resource as a planning tool. Despite their proximity to California, the fact that BPA is still considering SPP’s Markets+ in a clear sign of the aforementioned political trepidation.
Conclusion
This post only touches on the basics of market expansion in the West. We barely addressed the concept of the Western Electric Coordinating Council (WECC), and never mentioned the Western Resource Adequacy Program (WRAP) at all. Over the next few years, market expansion in the West is going to dominate a significant chunk of the wonkier power market conversations. With its abundant geographic advantages, a well-managed western market has the potential for rapid evolution into the premier grid of tomorrow. Alongside the expansion of markets comes greater data availability, and Grid Status will be there facilitating smooth access for analysts, investors, policy makers, traders, and hobbyists.
As always, please reach out on Twitter, LinkedIn, or through email with thoughts, questions, and suggestions on other topics you’d like to see covered or data you want in the API or on GridStatus.io.
This post is supported by funding from GridLab.