Year in Review: Solar Generation in 2024
Tracking solar's growth across US markets and its contribution to peak demand in 2024.
In 2024, solar deployment continued to grow, and began to expand significantly into markets beyond CAISO and ERCOT, the current leaders. We took a look past installed capacity to see how much solar is contributing to peak load - traditionally a high-risk time on the grid.
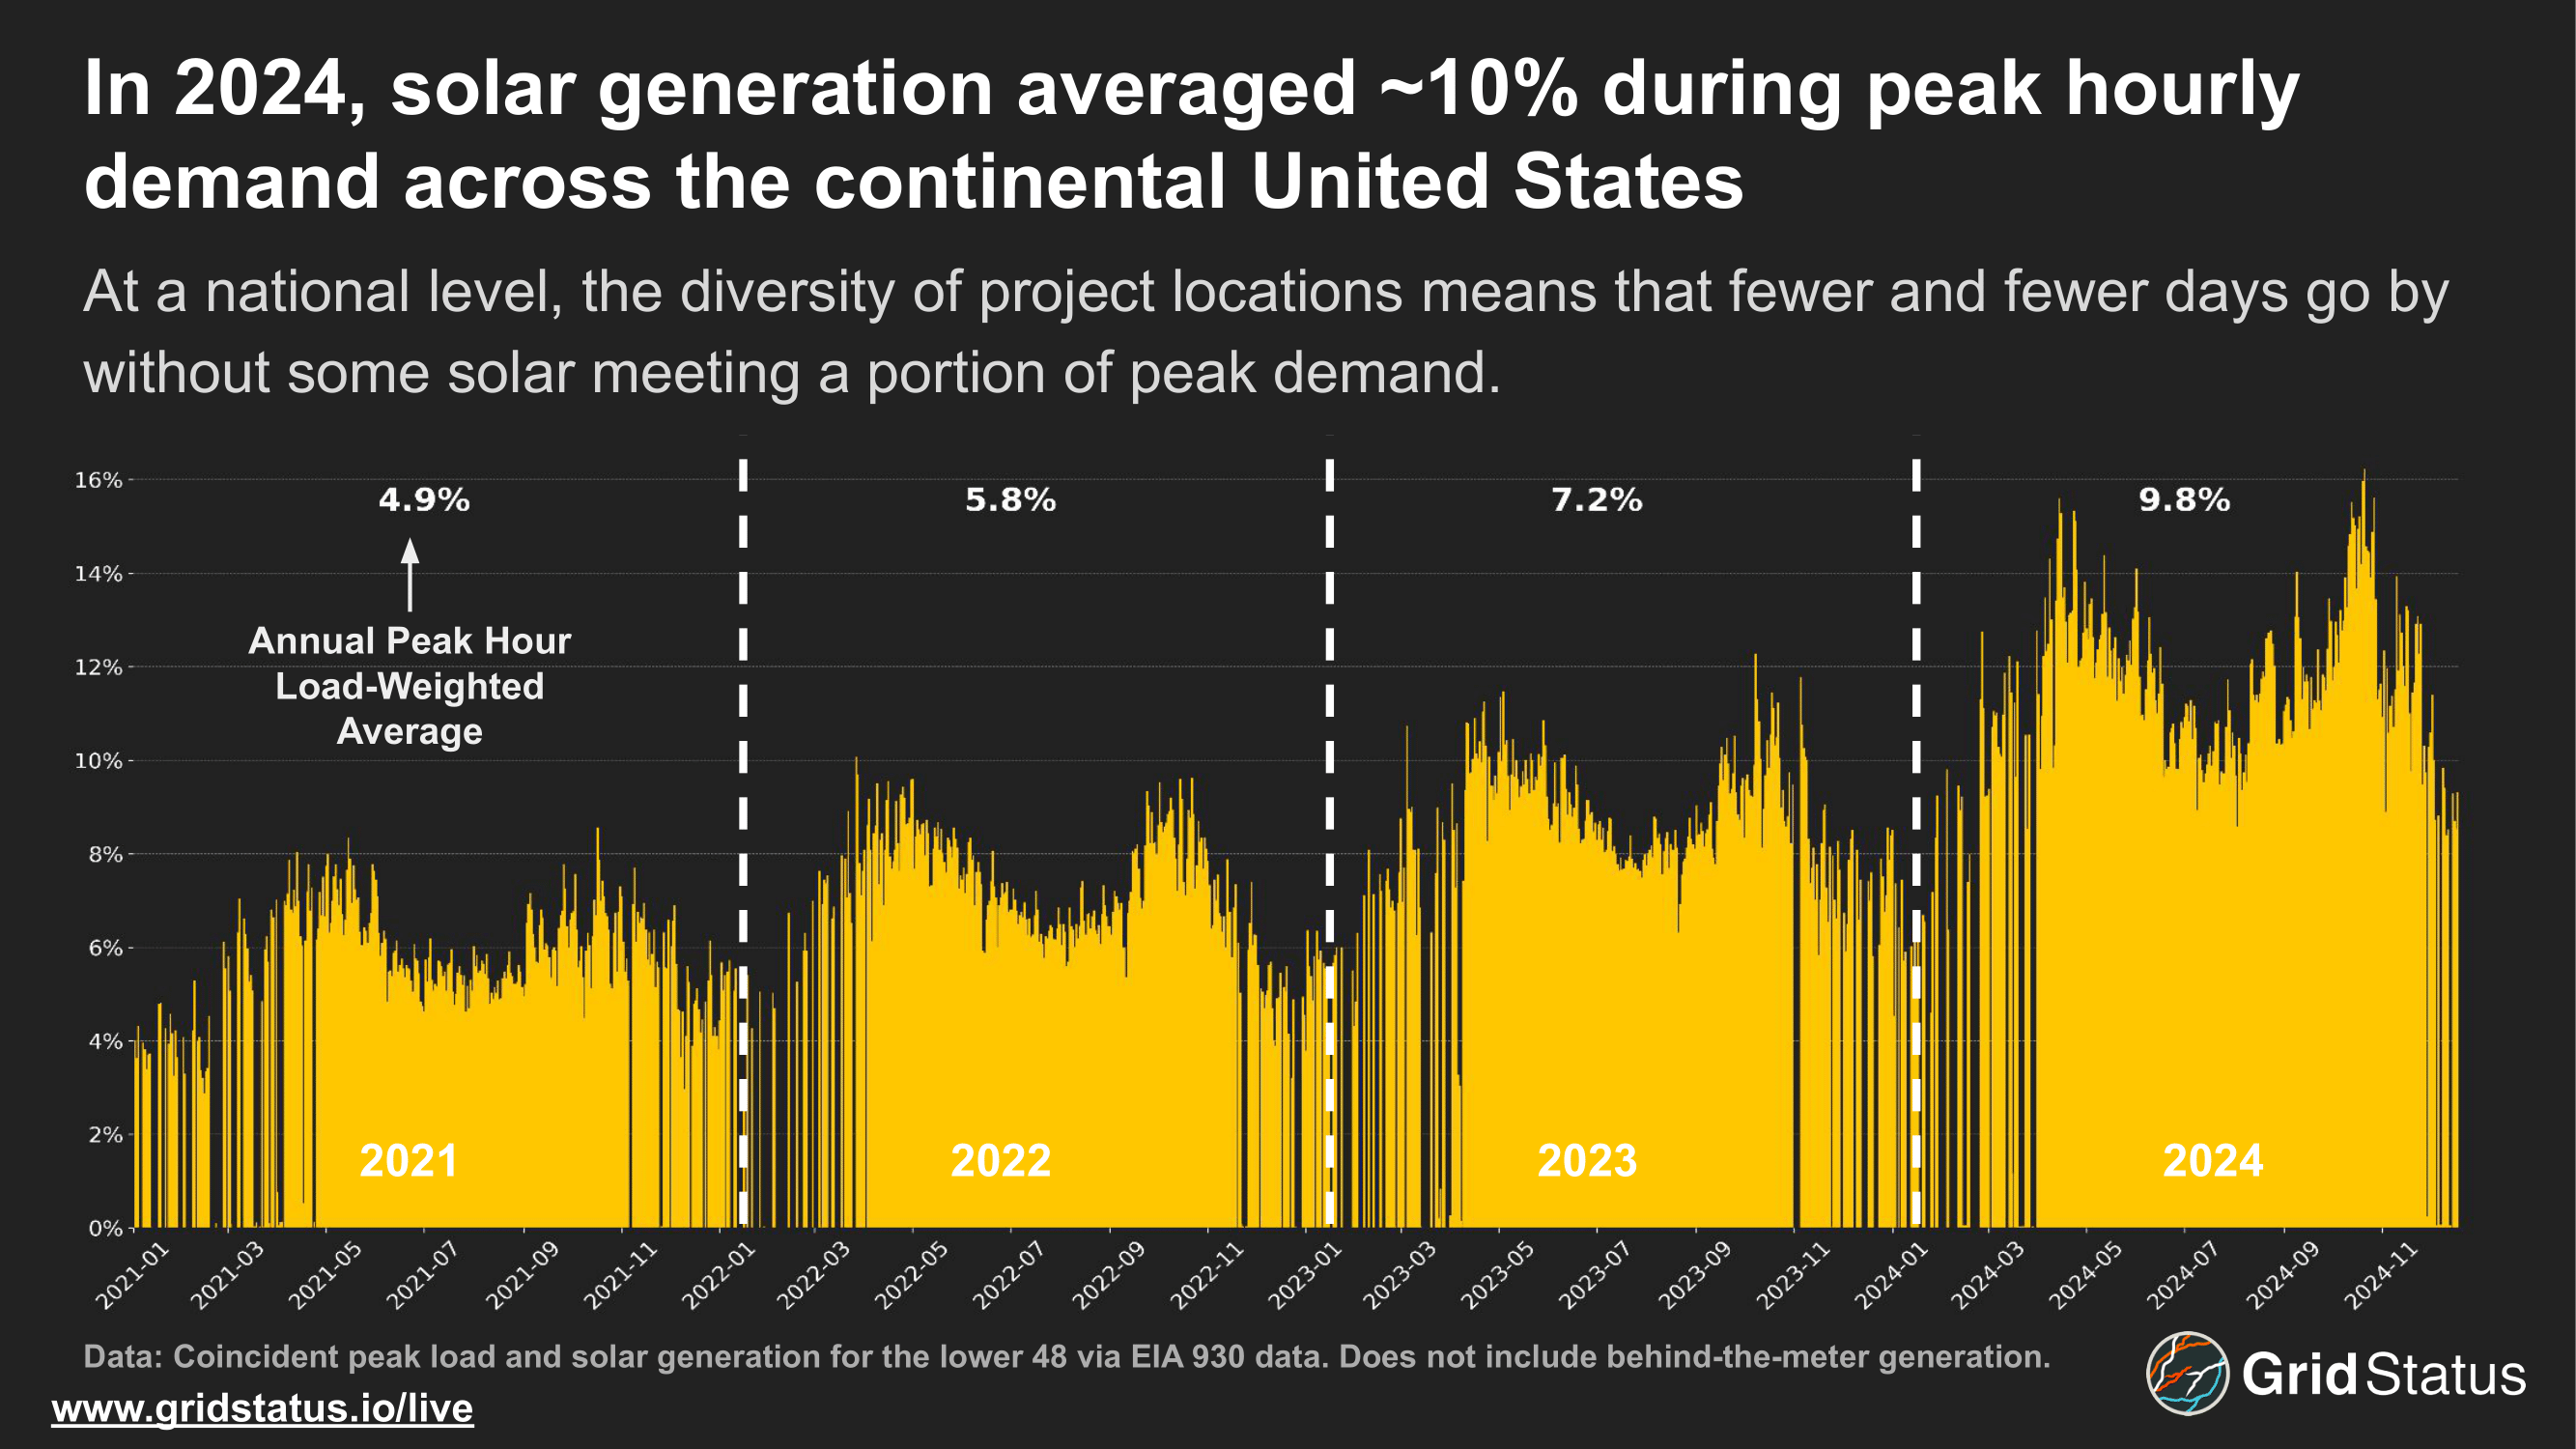
Nationally, solar's contribution to peak load has more than doubled over the 2020s. Winter gaps remain— whether in the morning or evening, peak load during the winter can be outside of solar generating hours, but the shoulder seasons in particular saw a large contribution from solar. Lower load and higher outages among traditional generators during spring and autumn means that solar can contribute a larger amount to peak load.
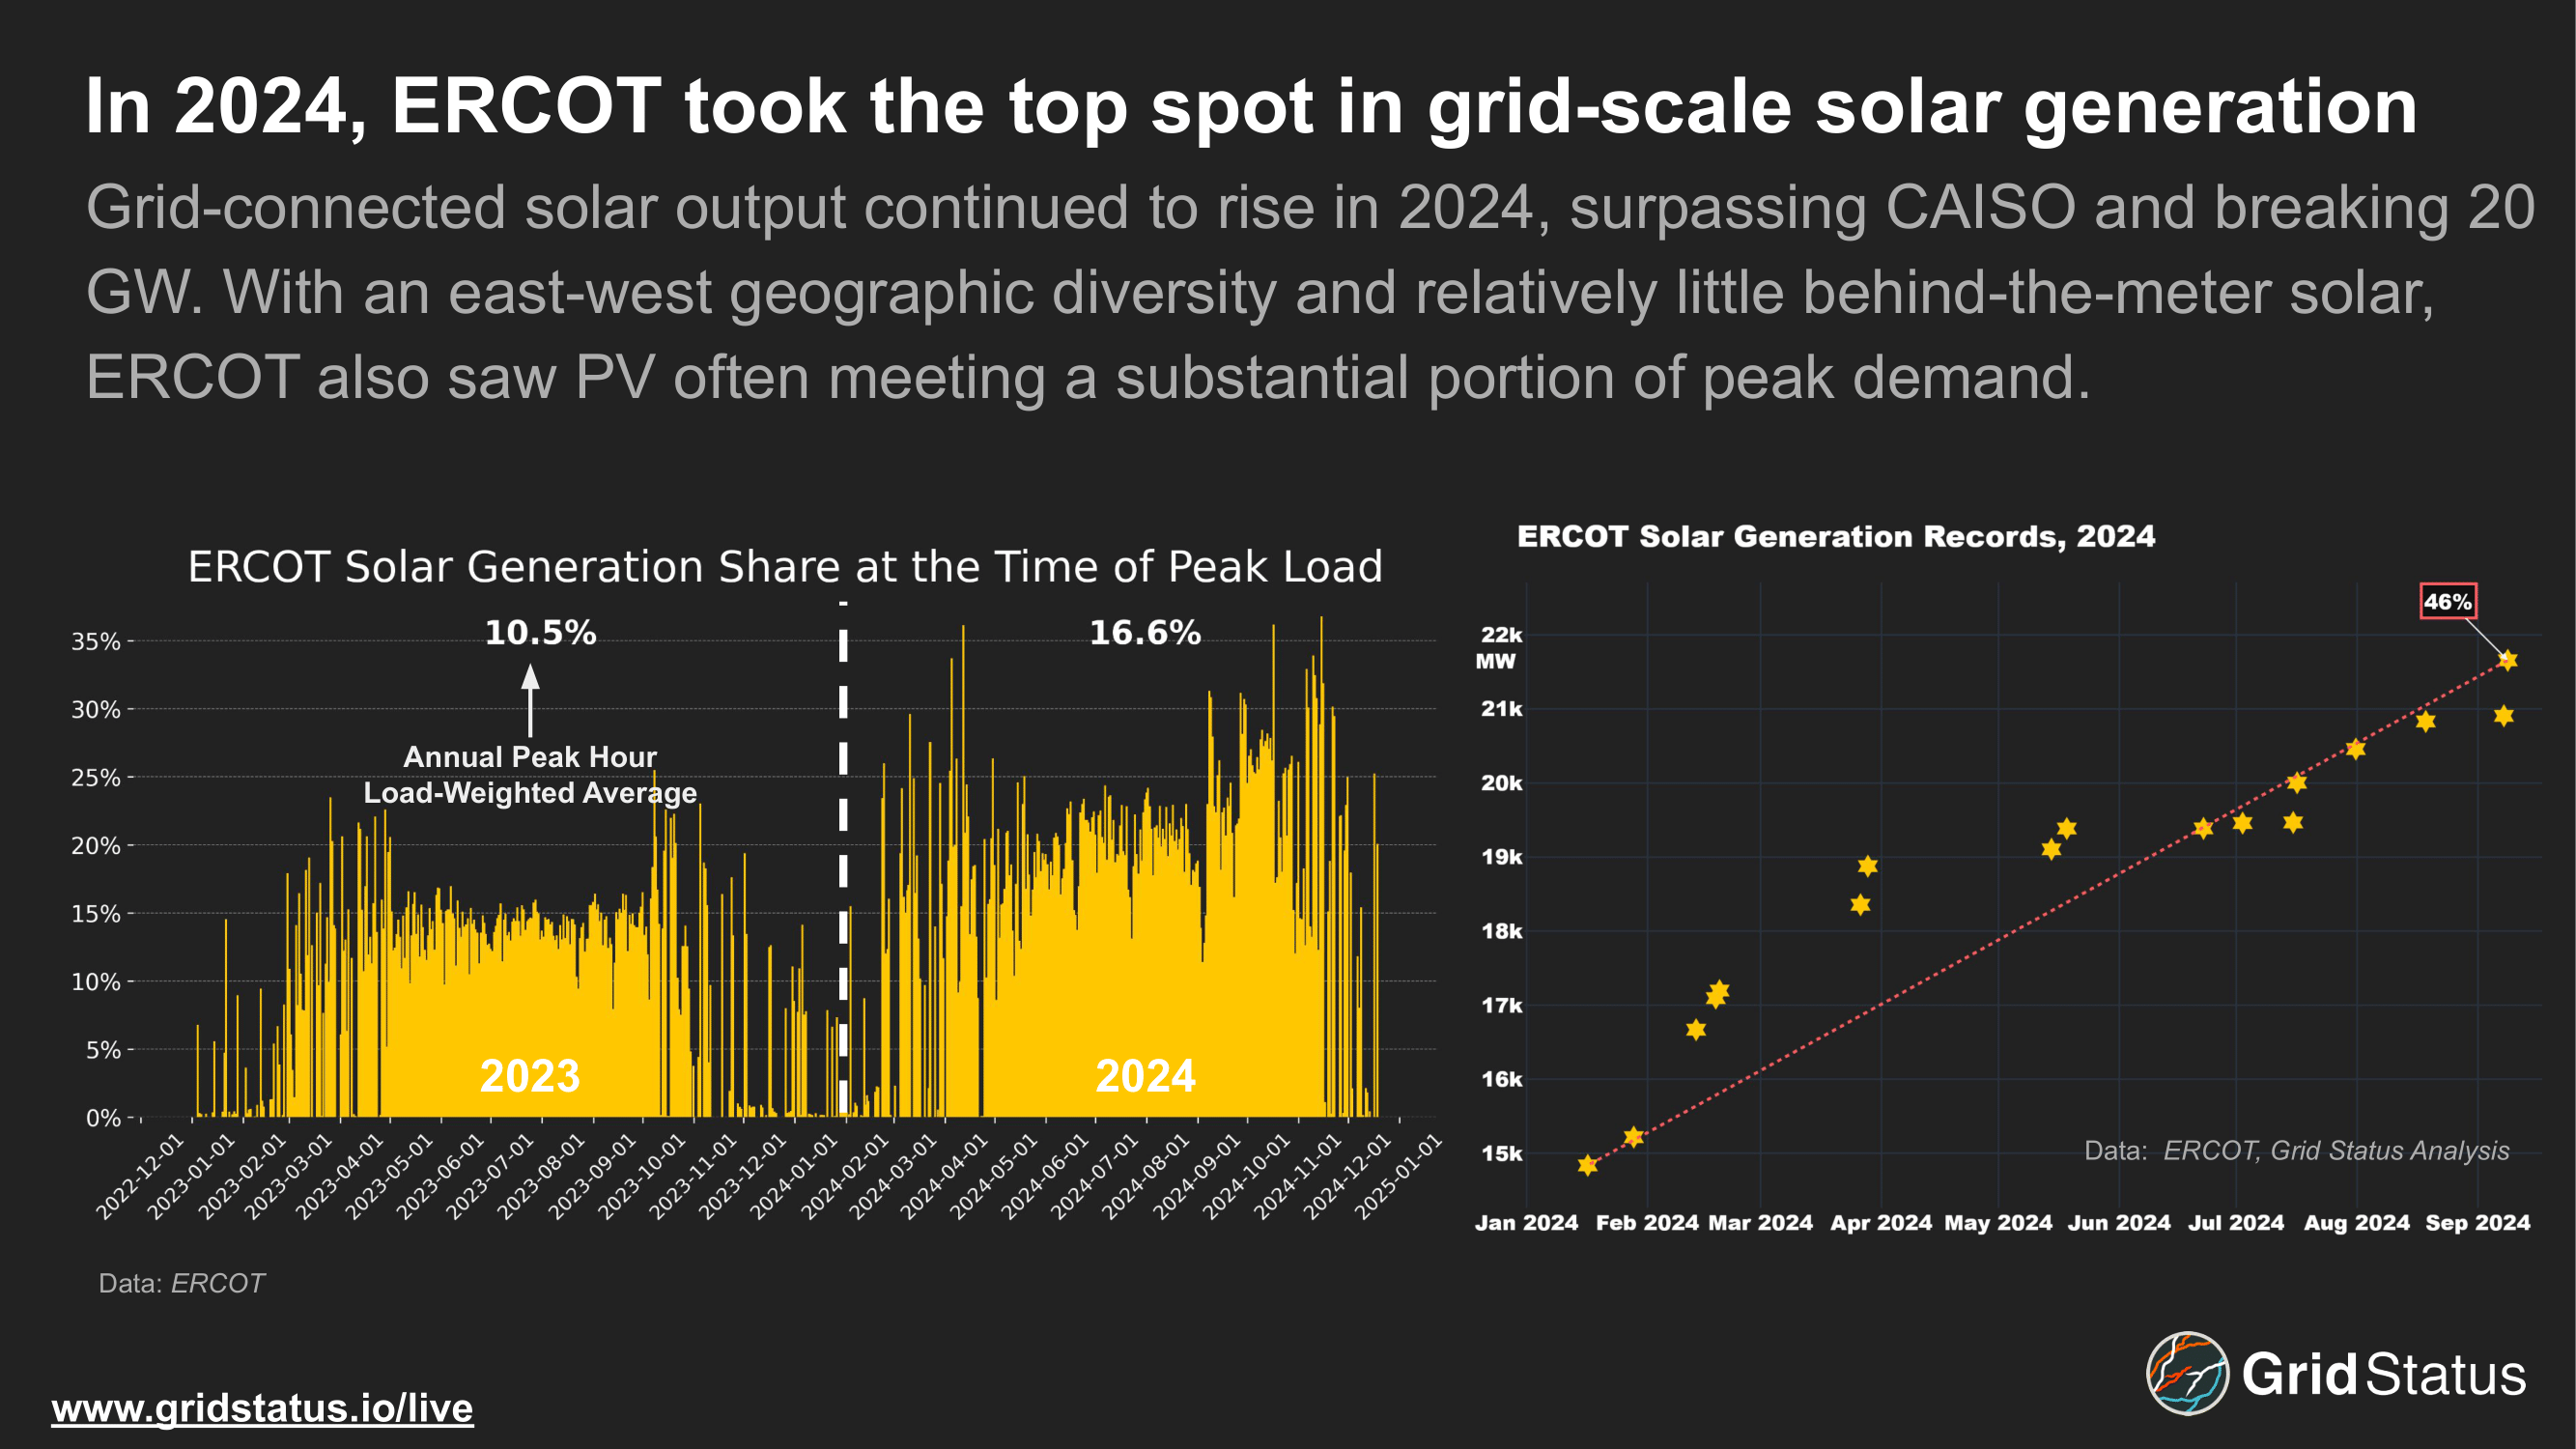
ERCOT's solar deployment continued apace, shuffling the mid-day stack and shifting more risk and volatility towards the net load peak (more on that below).
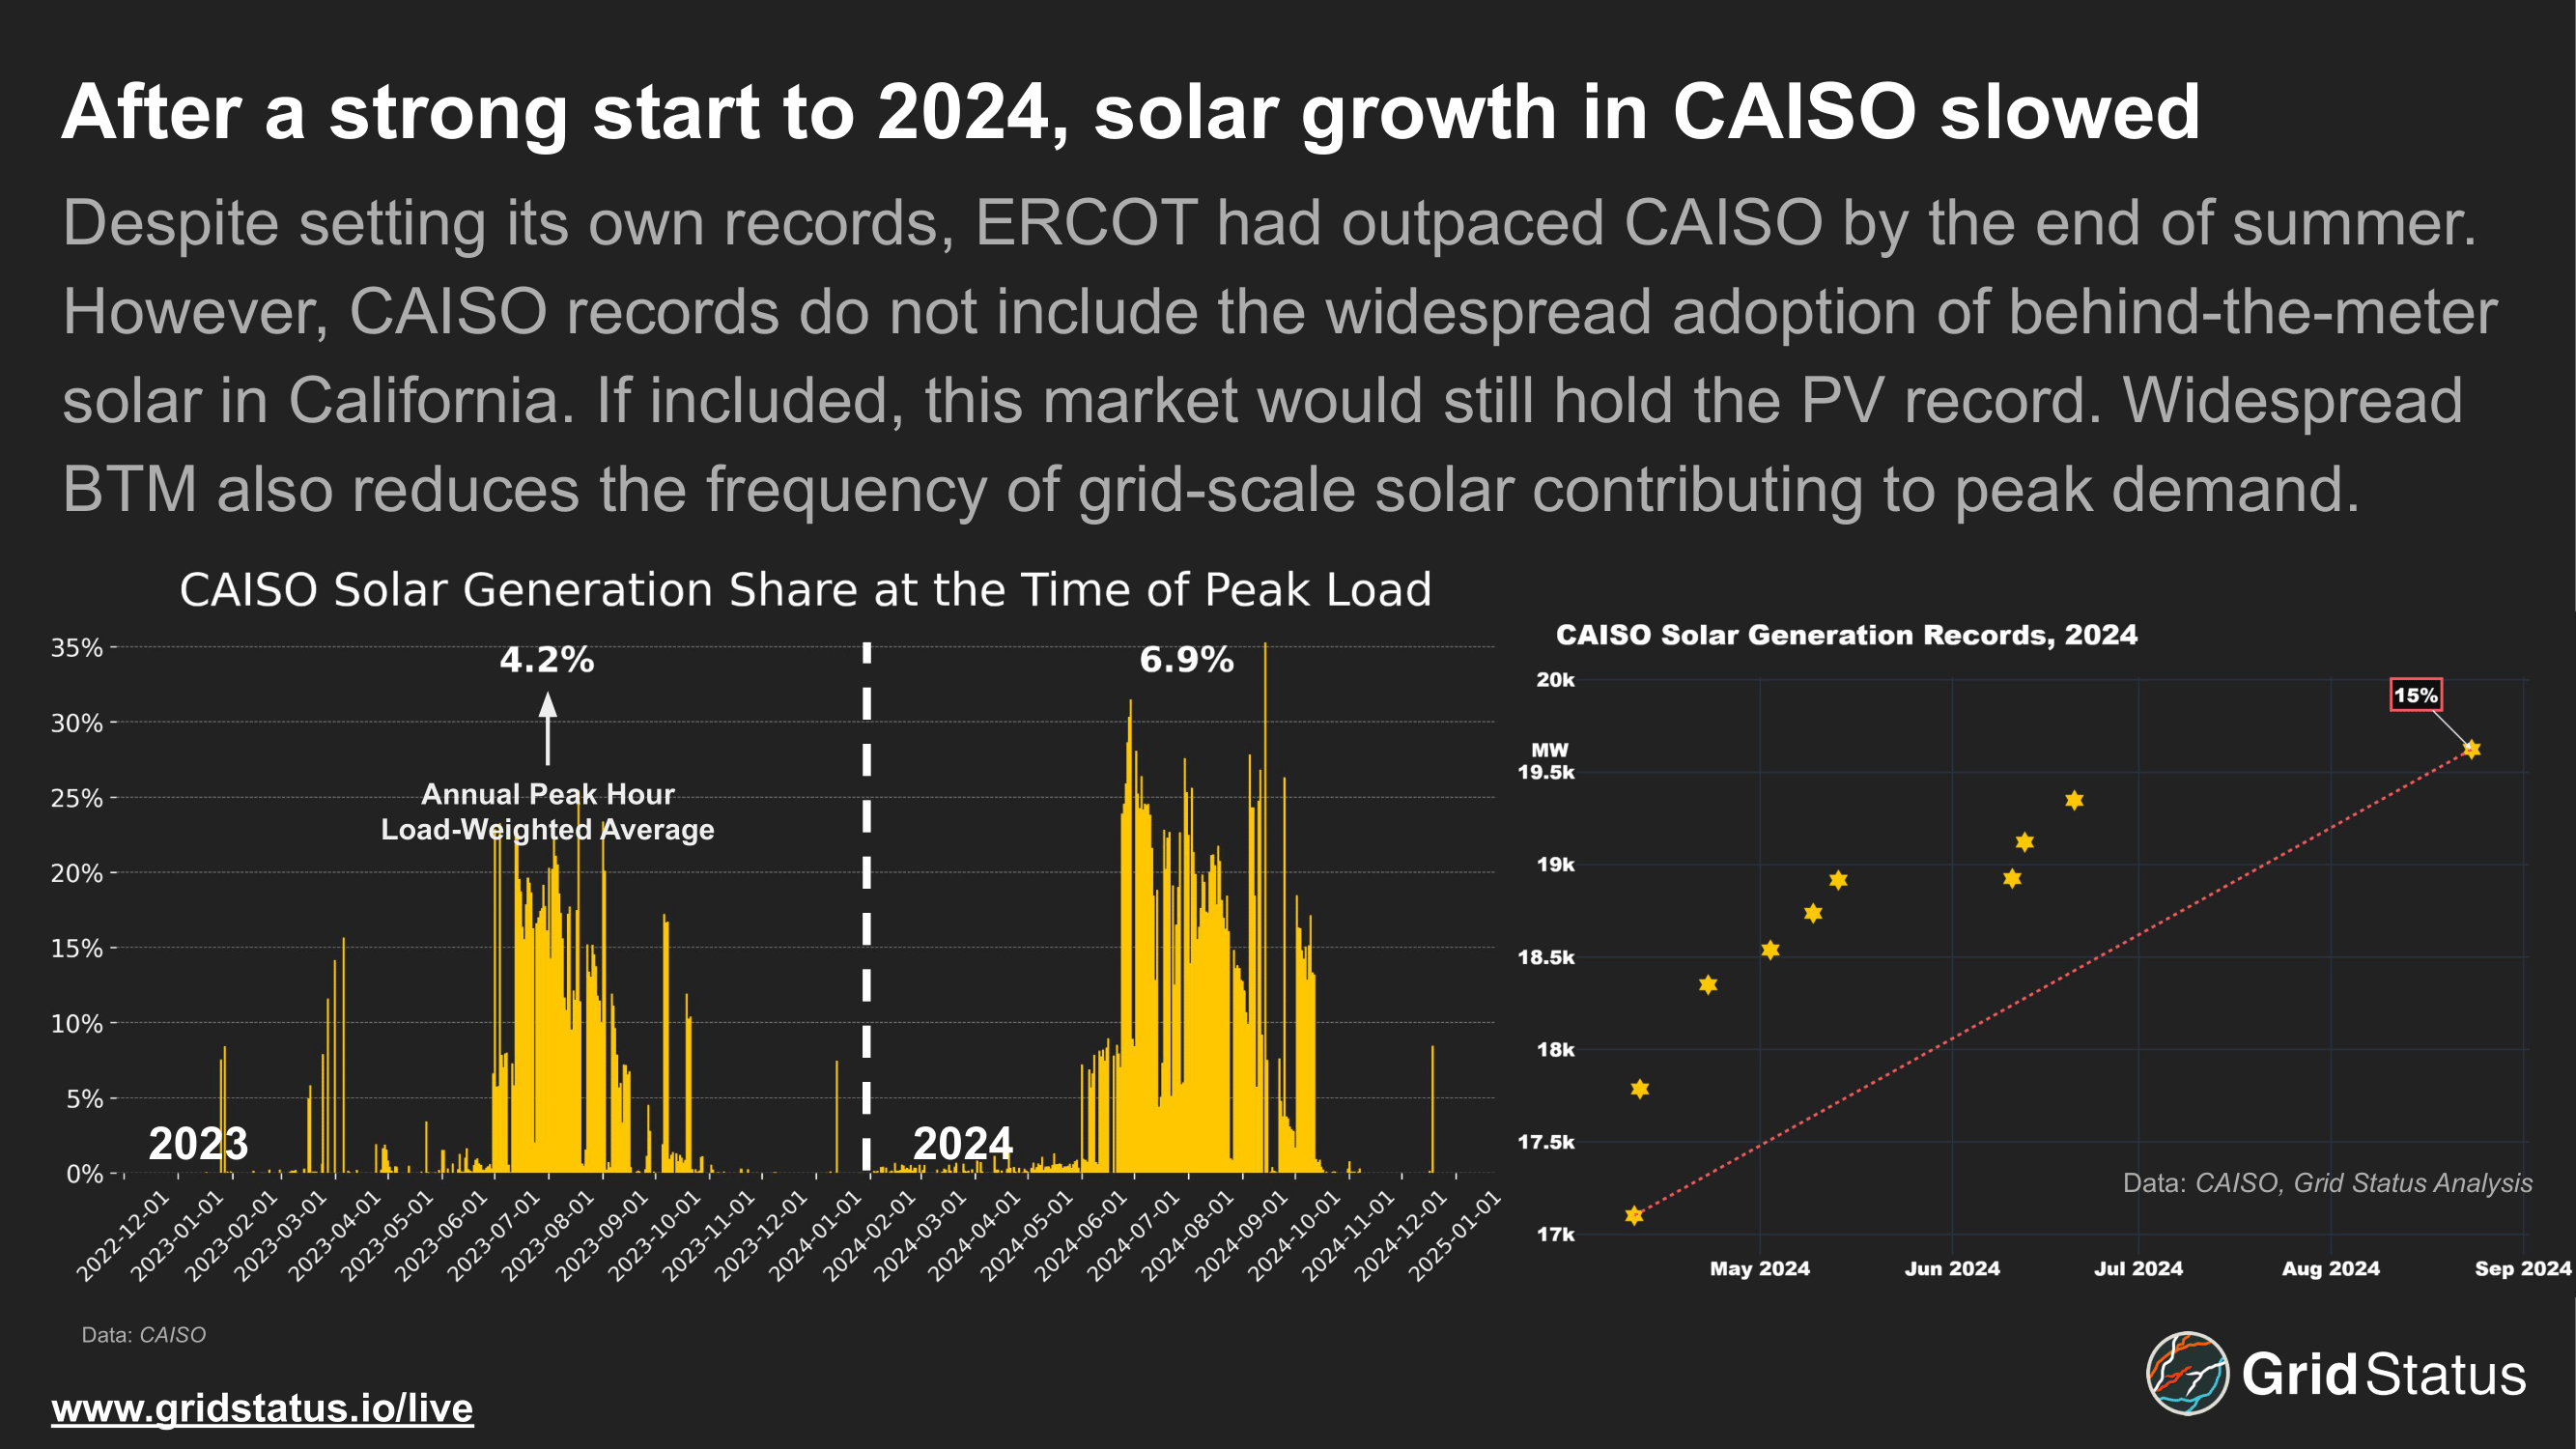
CAISO deployed GWs of utility-scale solar, but growth has slowed relative to other areas in the US which are either much earlier on the deployment curve (MISO) or with higher demand and easier development processes (ERCOT). Despite this, California remains the clear leader in solar generation when front-of and behind-the-meter installations are considered together.
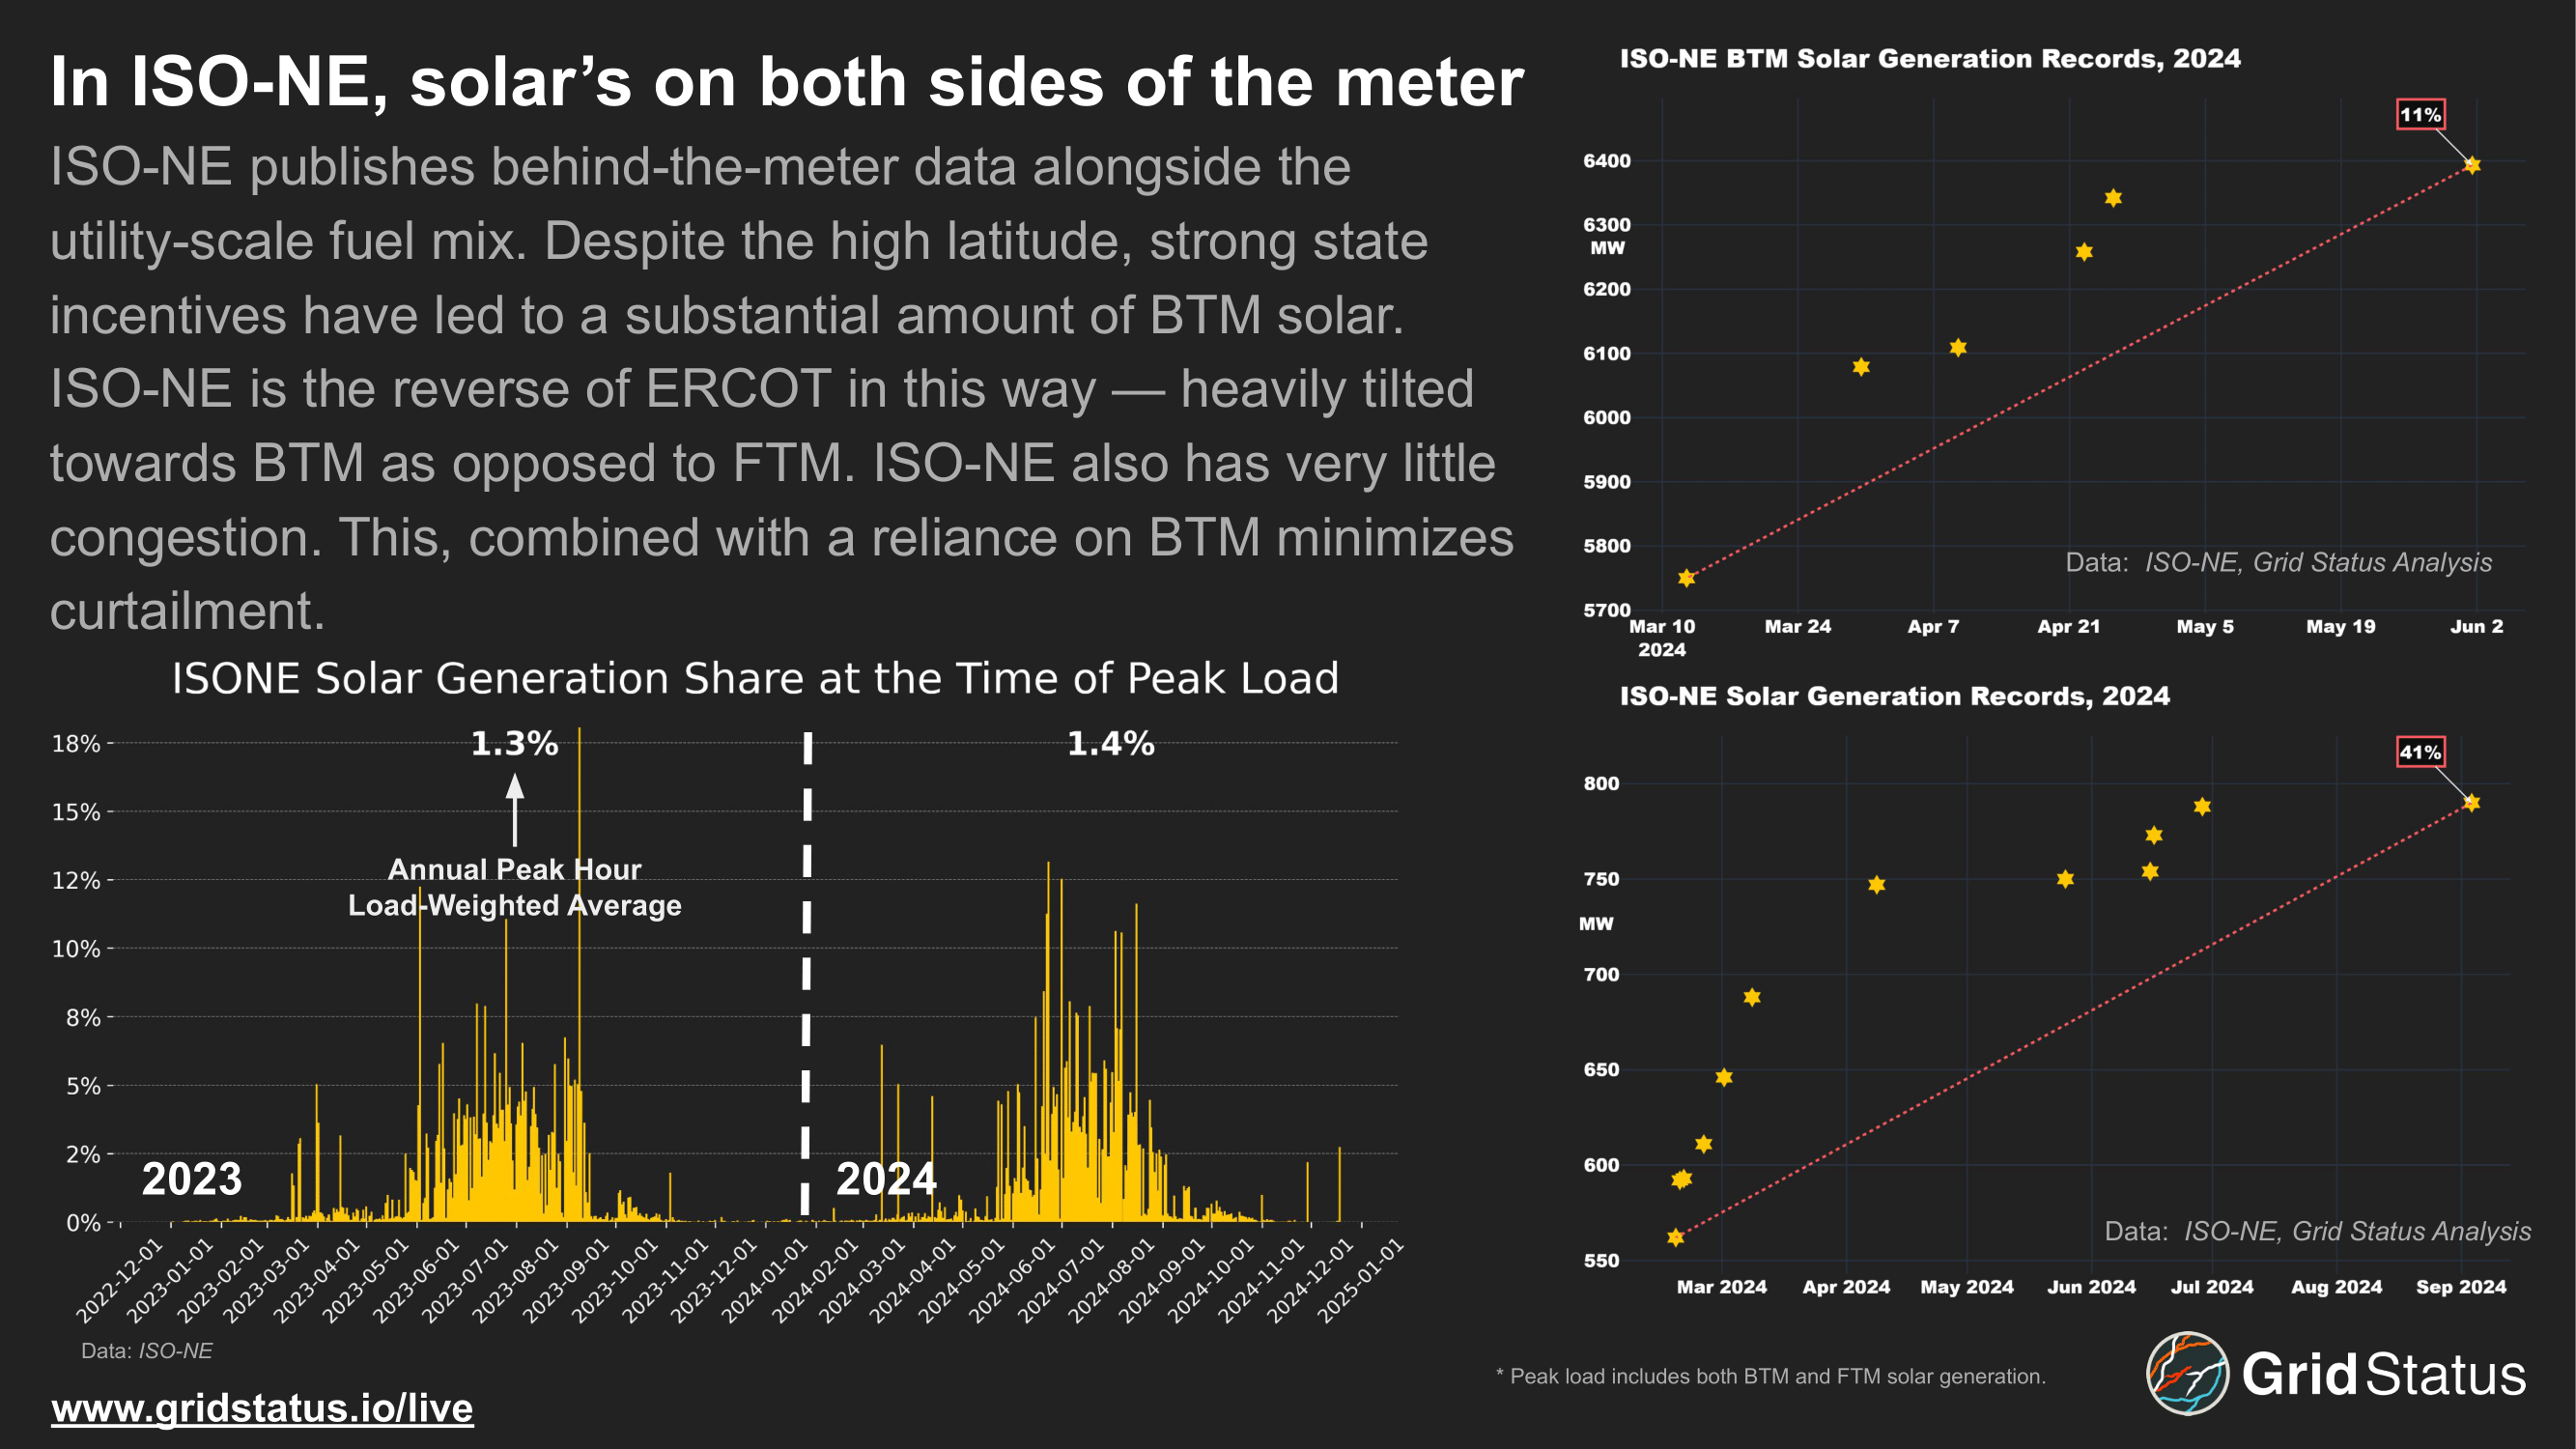
While grid-scale solar is relatively small in terms of absolute MWs, behind-the-meter solar in New England is quite large, particularly in the context of the smallest market by demand in the US. However, without substantial storage, solar can only do so much this far north in certain times of the year. Fewer hours of sunlight and earlier sunsets during the depths of winter limit its capability to meet peak demand.
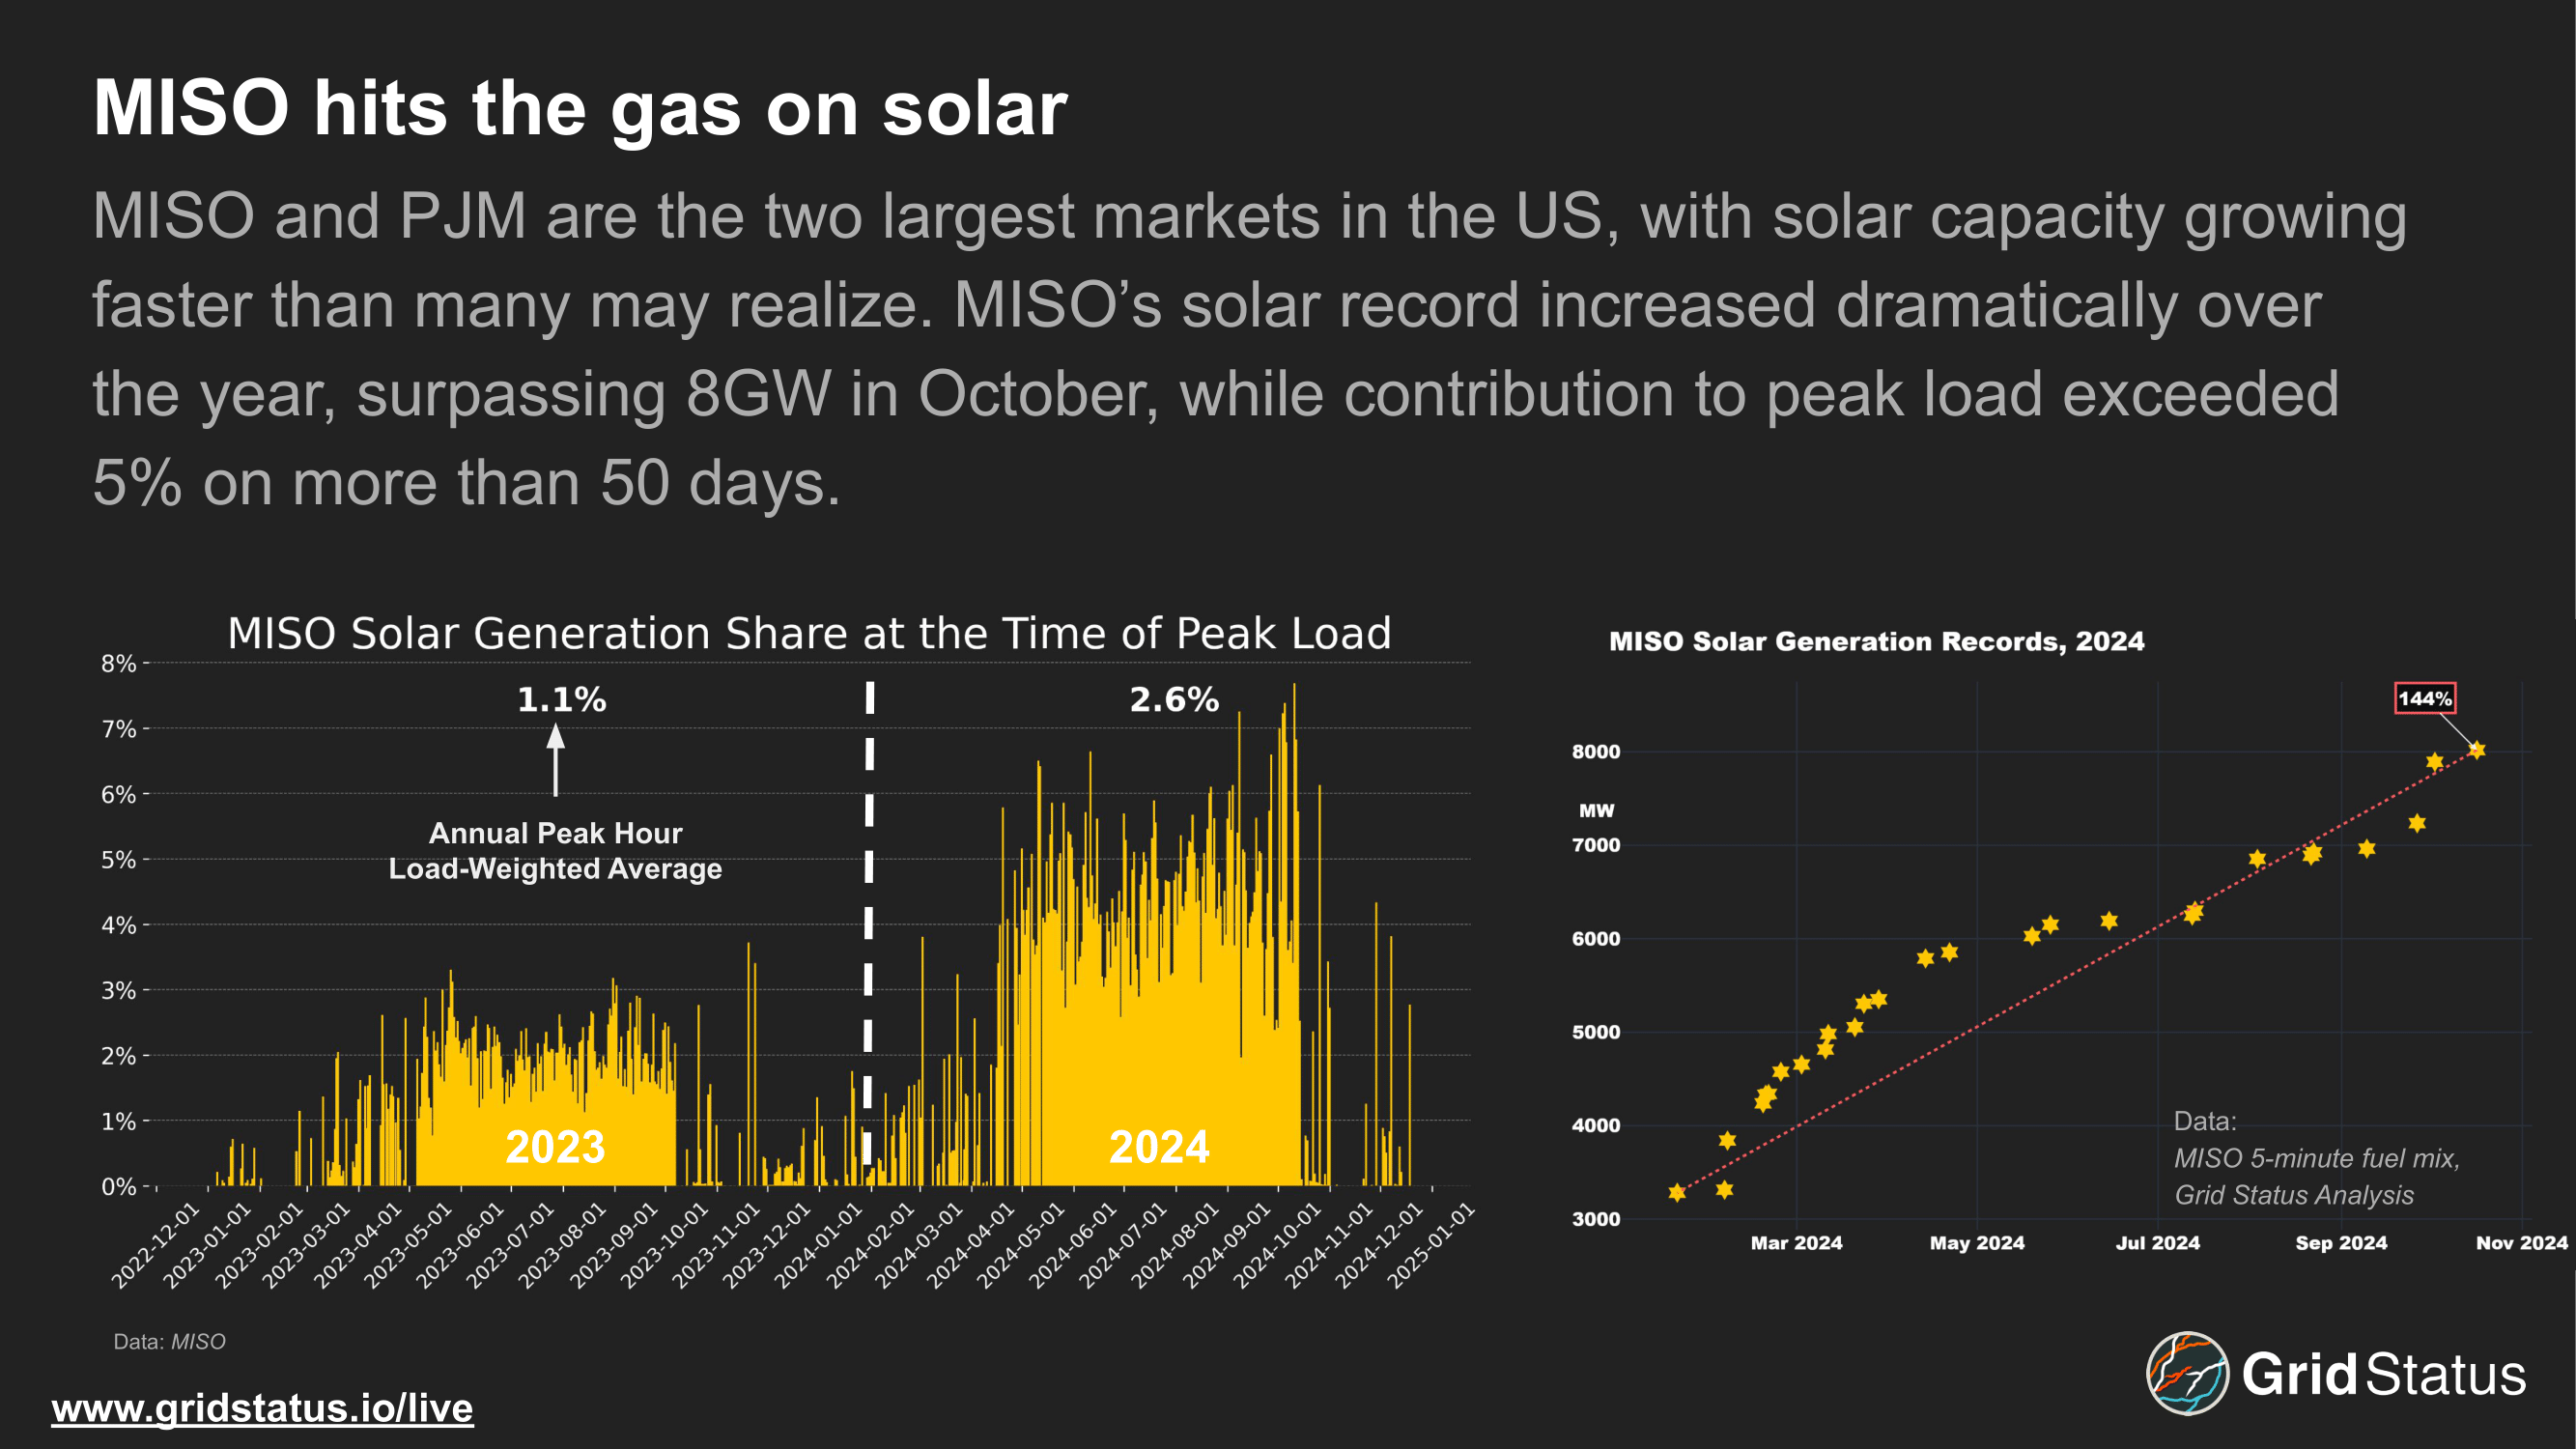
MISO is perhaps the most interesting solar market in the US. While CAISO and ERCOT are relatively well understood, MISO's massively varying geographic footprint, disparate state-level policies, and limited North-South transmission already complicate operations. With a generation record above 8GW, solar has certainly surpassed installed capacity assumptions of ~7.6GW for the next planning year.
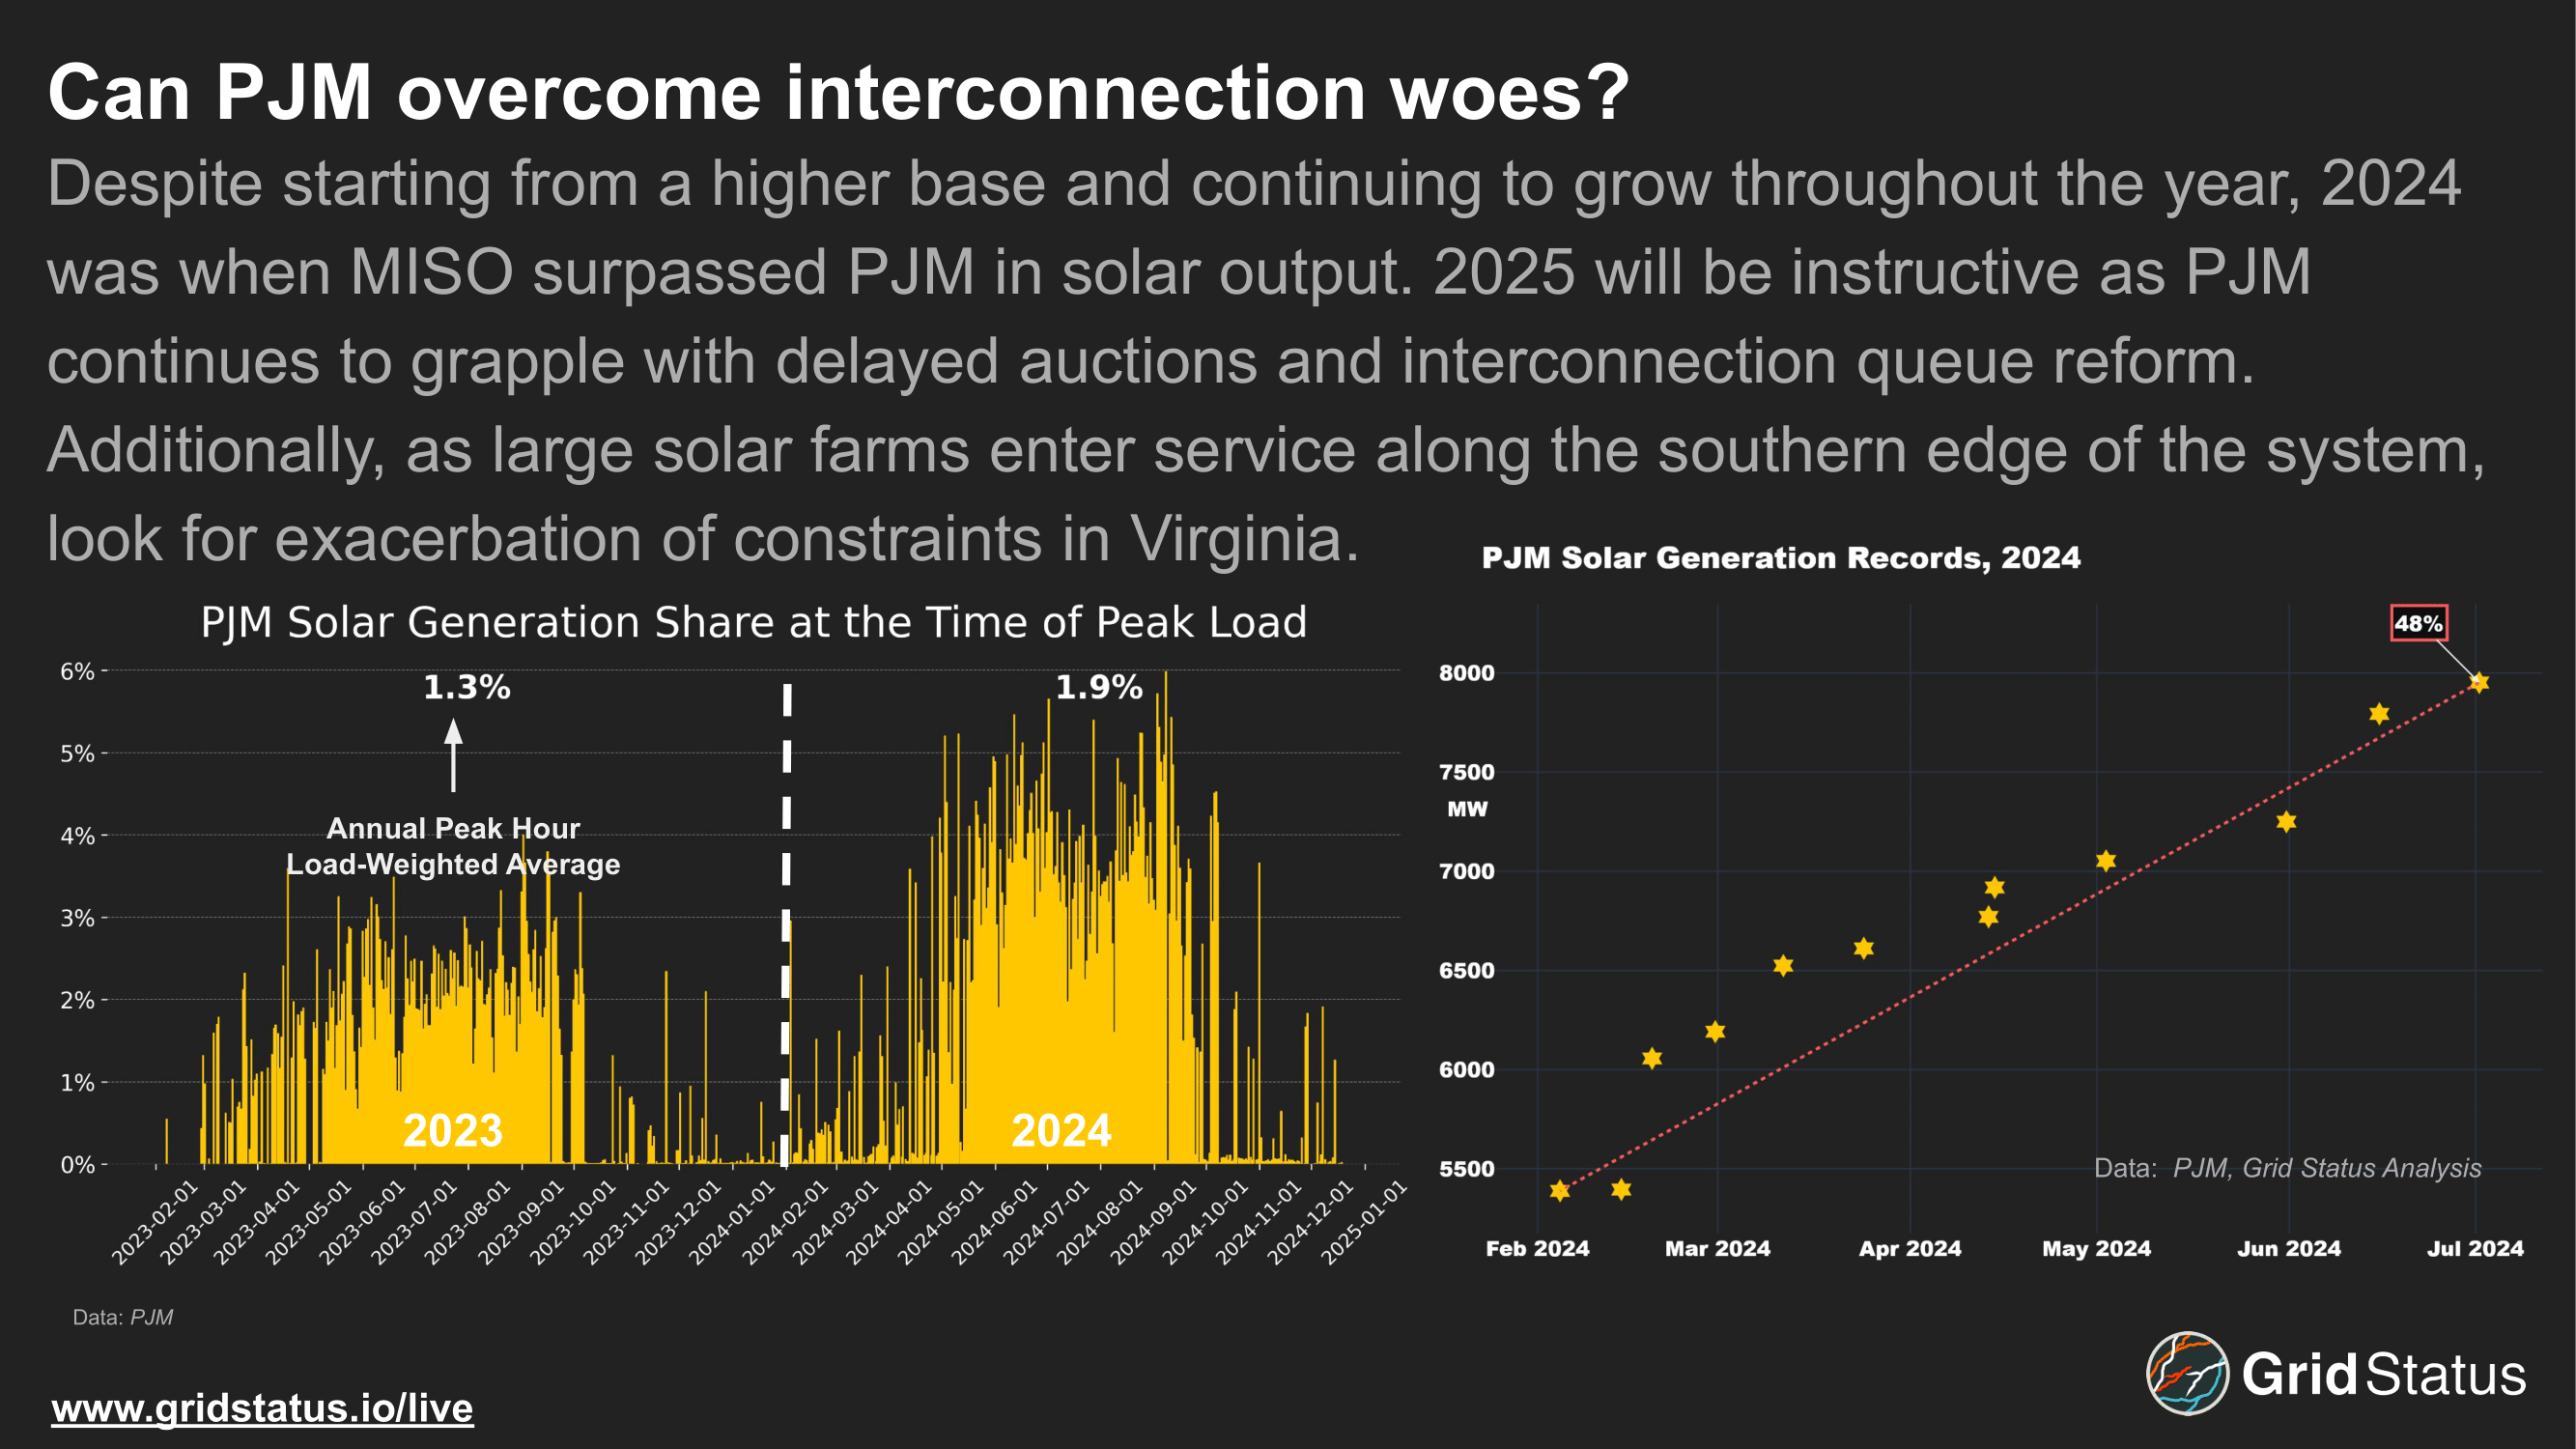
Between the original publication of these slides and the drafting of interstitial material to get them into blog-form, FERC affirmed PJM's decision to kick 900 MW of far-along solar back down the queue due to an internal communications snafu at the developer. From that perspective, the answer to this slide's headline question is "no".
As solar comes online in PJM there is also the potential for new constraints to developer or existing ones to become exacerbated. A large amount of new solar is positioned to come online in southern Virginia and northern North Carolina, which will also hit flows from Dominion's Coastal Virginia Offshore Wind project as generation tries to serve the rapidly growing load in Northern Virginia.
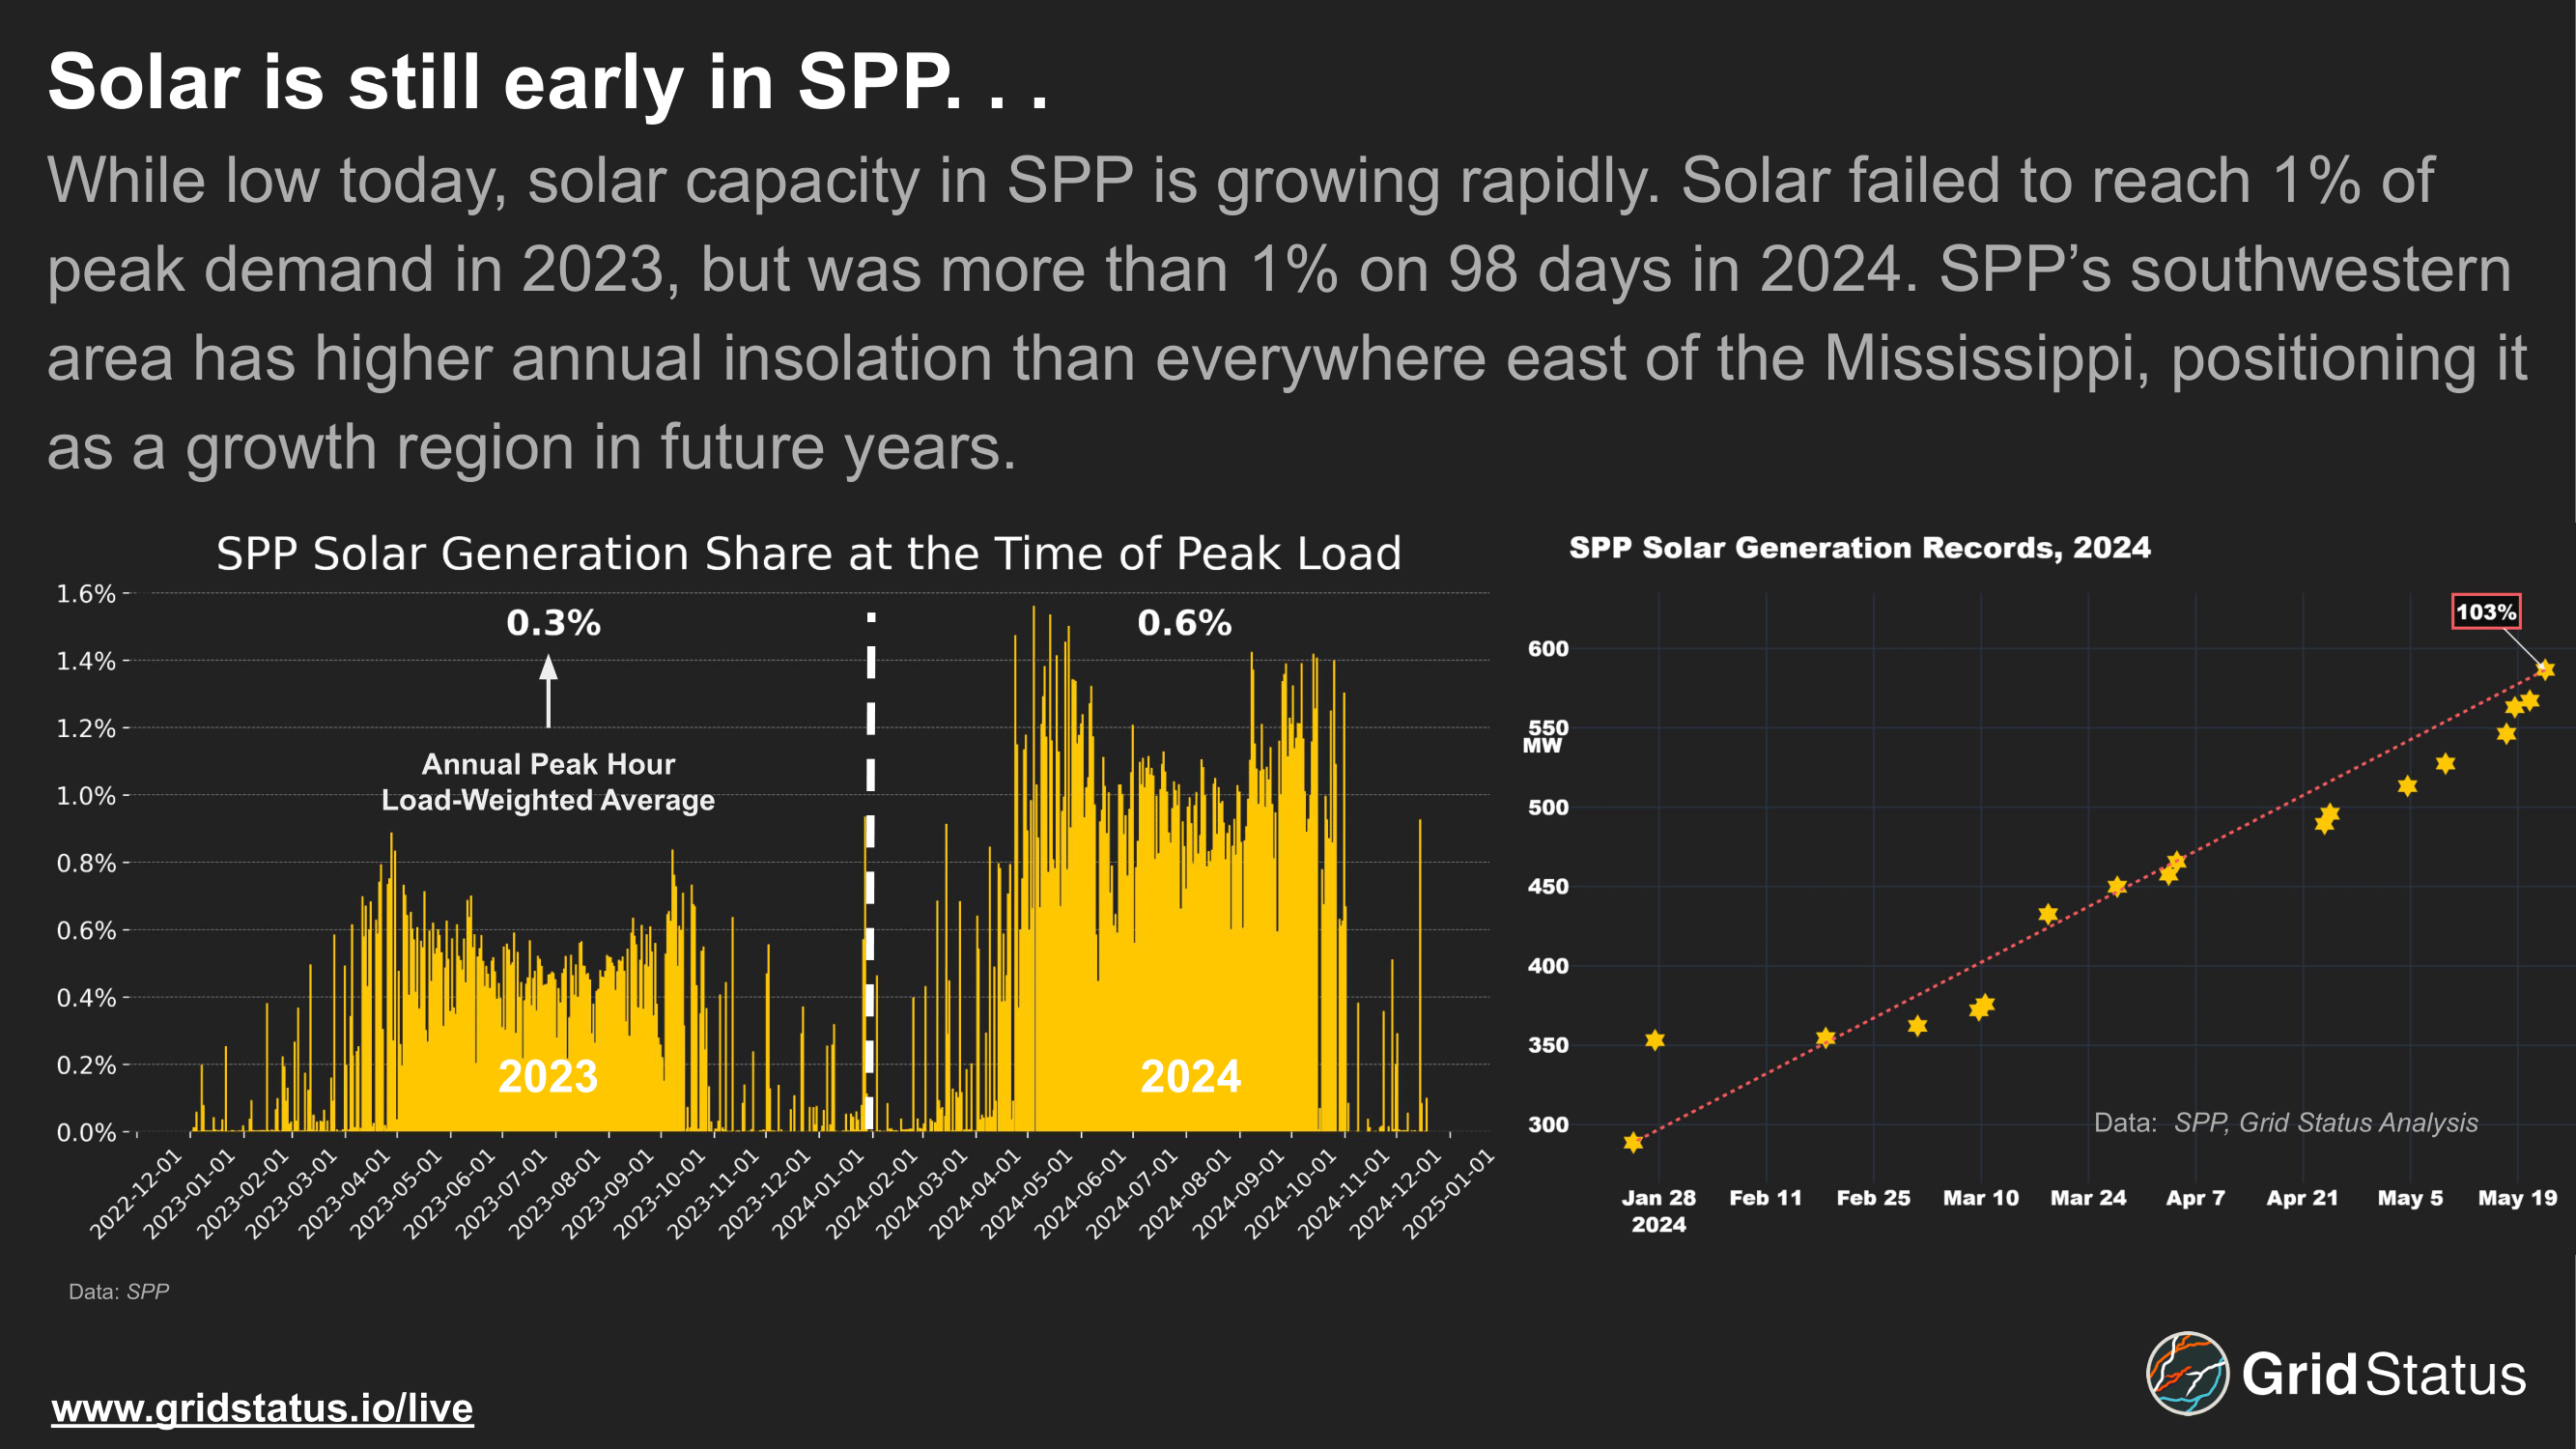
While solar in SPP is small today, some of the market's footprint sits in prime territory. Unfortunately, the highest isolation areas are even further from load, past the wind-heavy portion of the plains. As more solar is deployed in that region, deliverability will be a key metric to track.
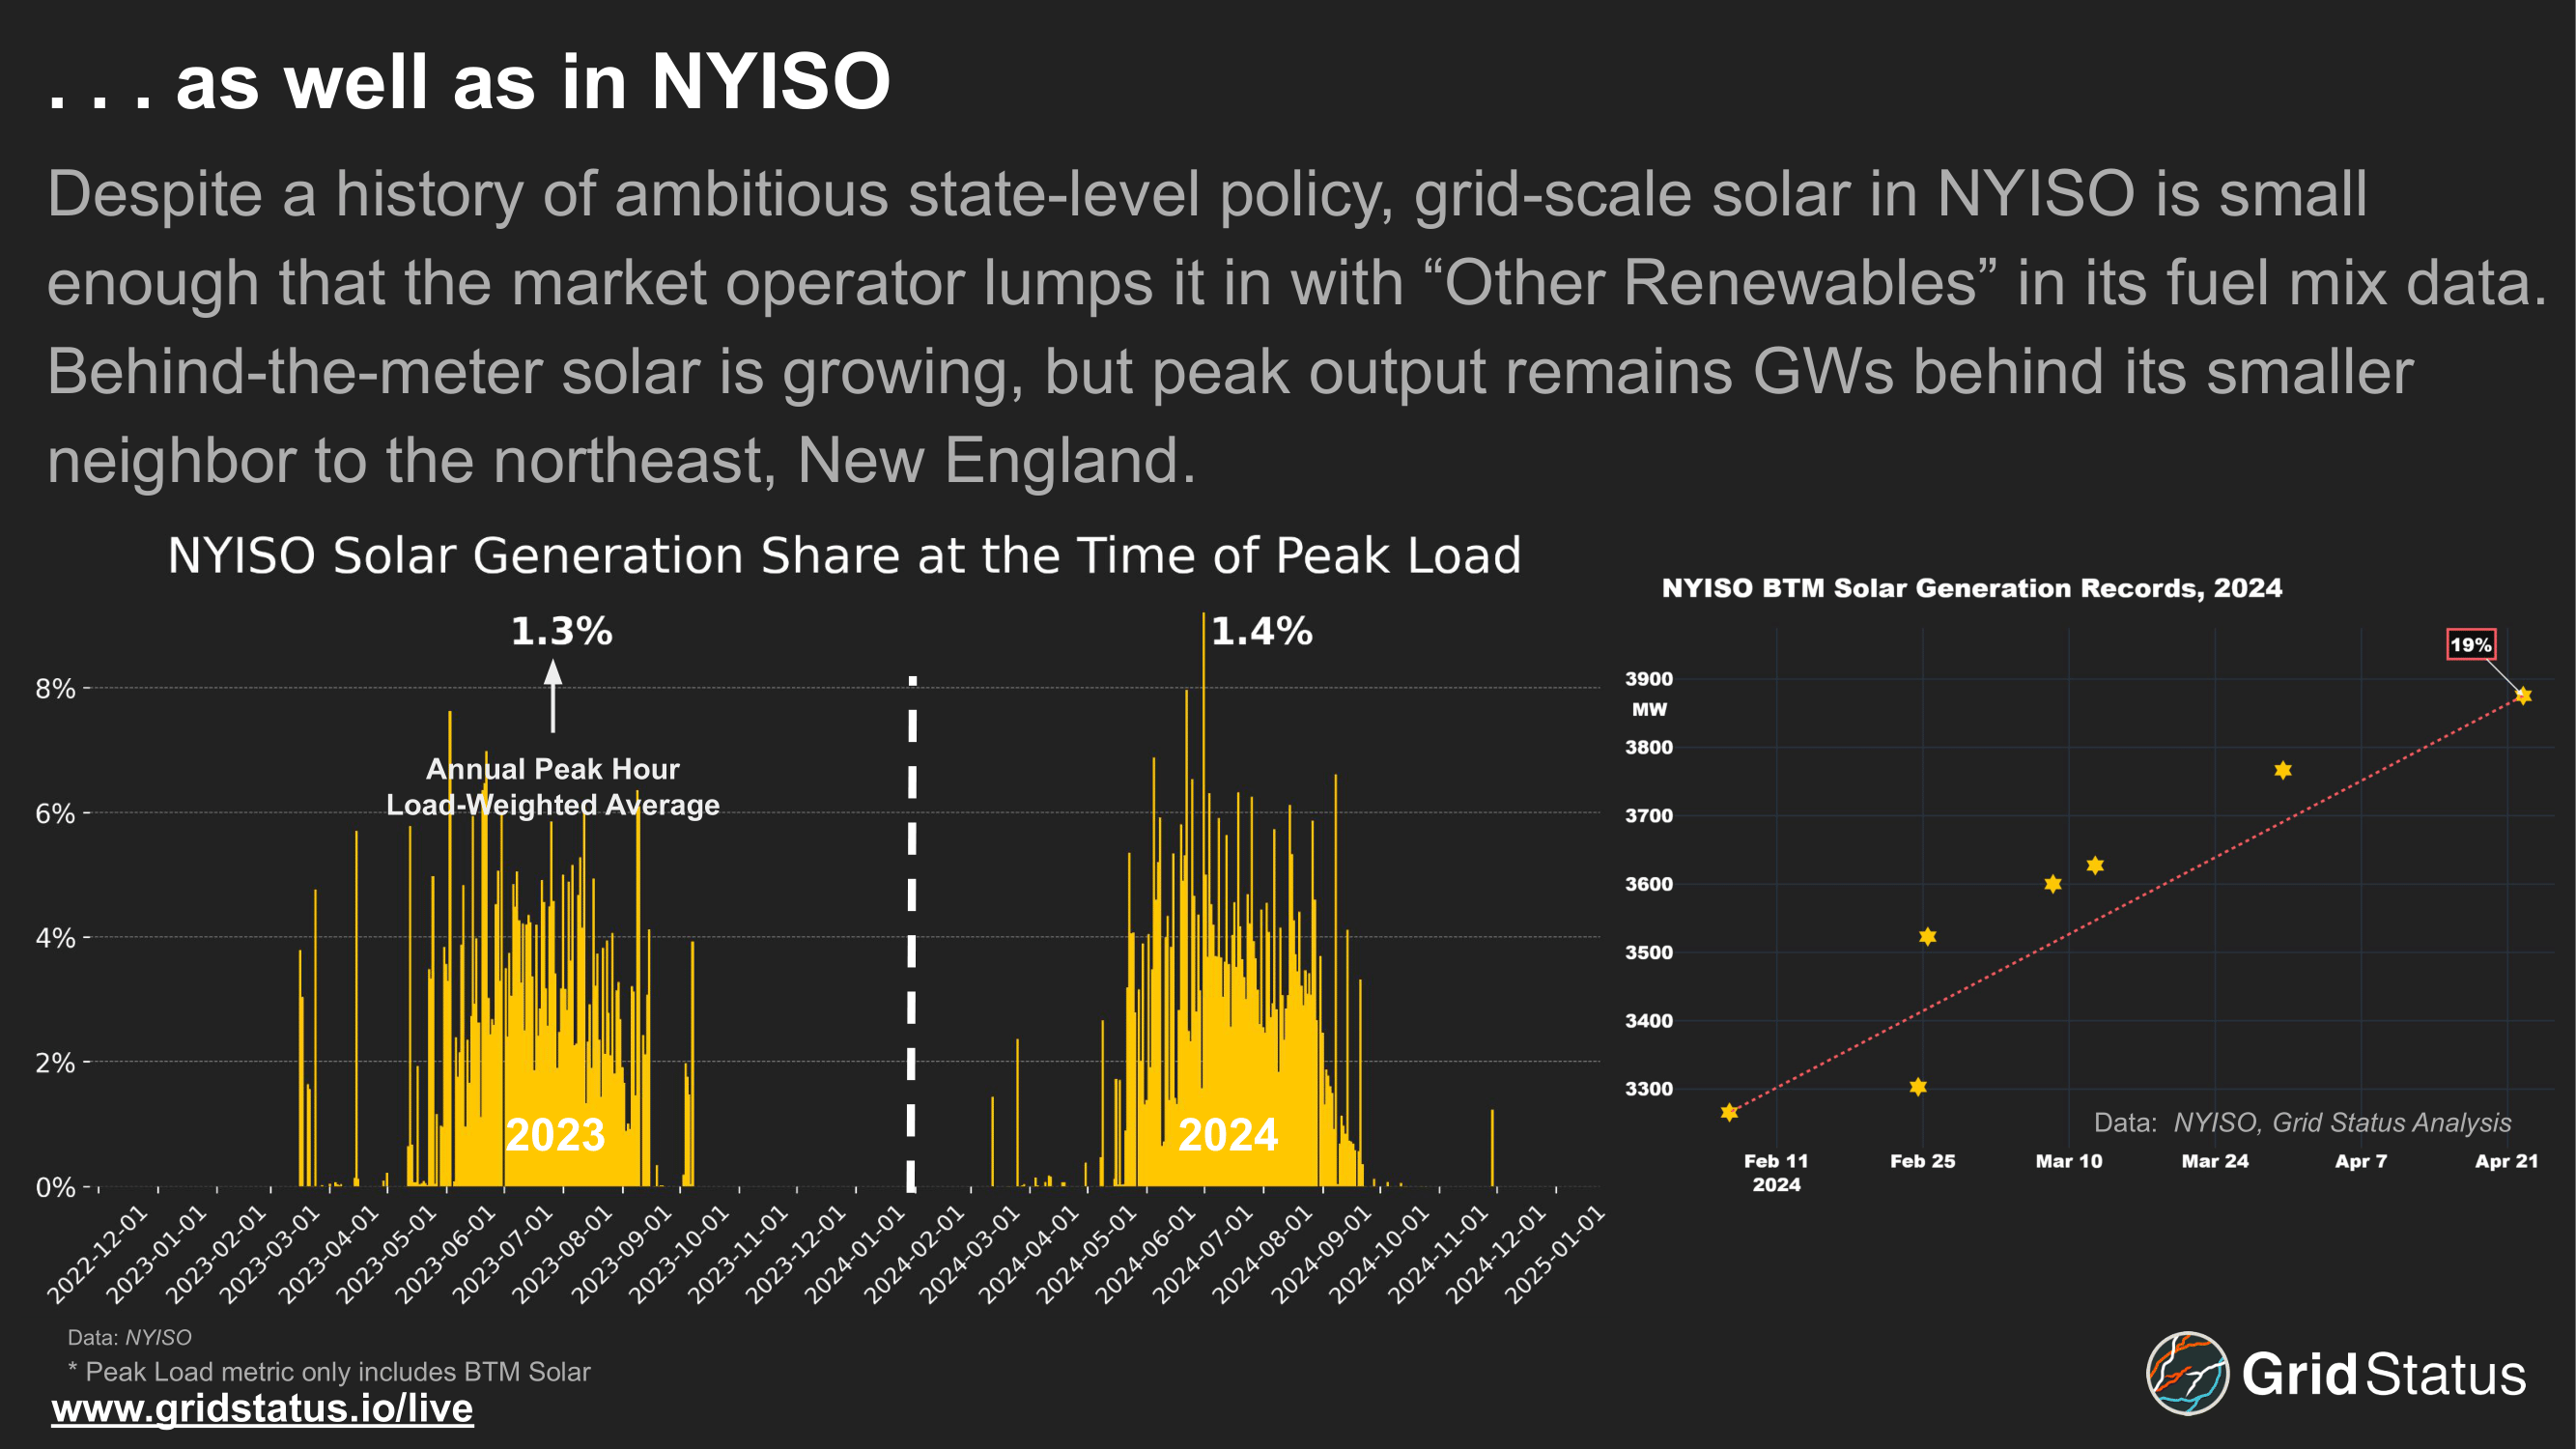
NYISO nearly didn't get a mention here at all, and what is here is purely behind-the-meter. Despite substantial work from NYSERDA over the years on developing policy to incentivize the deployment of additional renewables in New York, it remains far behind other markets in terms of grid-scale solar, and is outpaced in terms of behind-the-meter deployments by its neighbor to the east, ISO-NE.
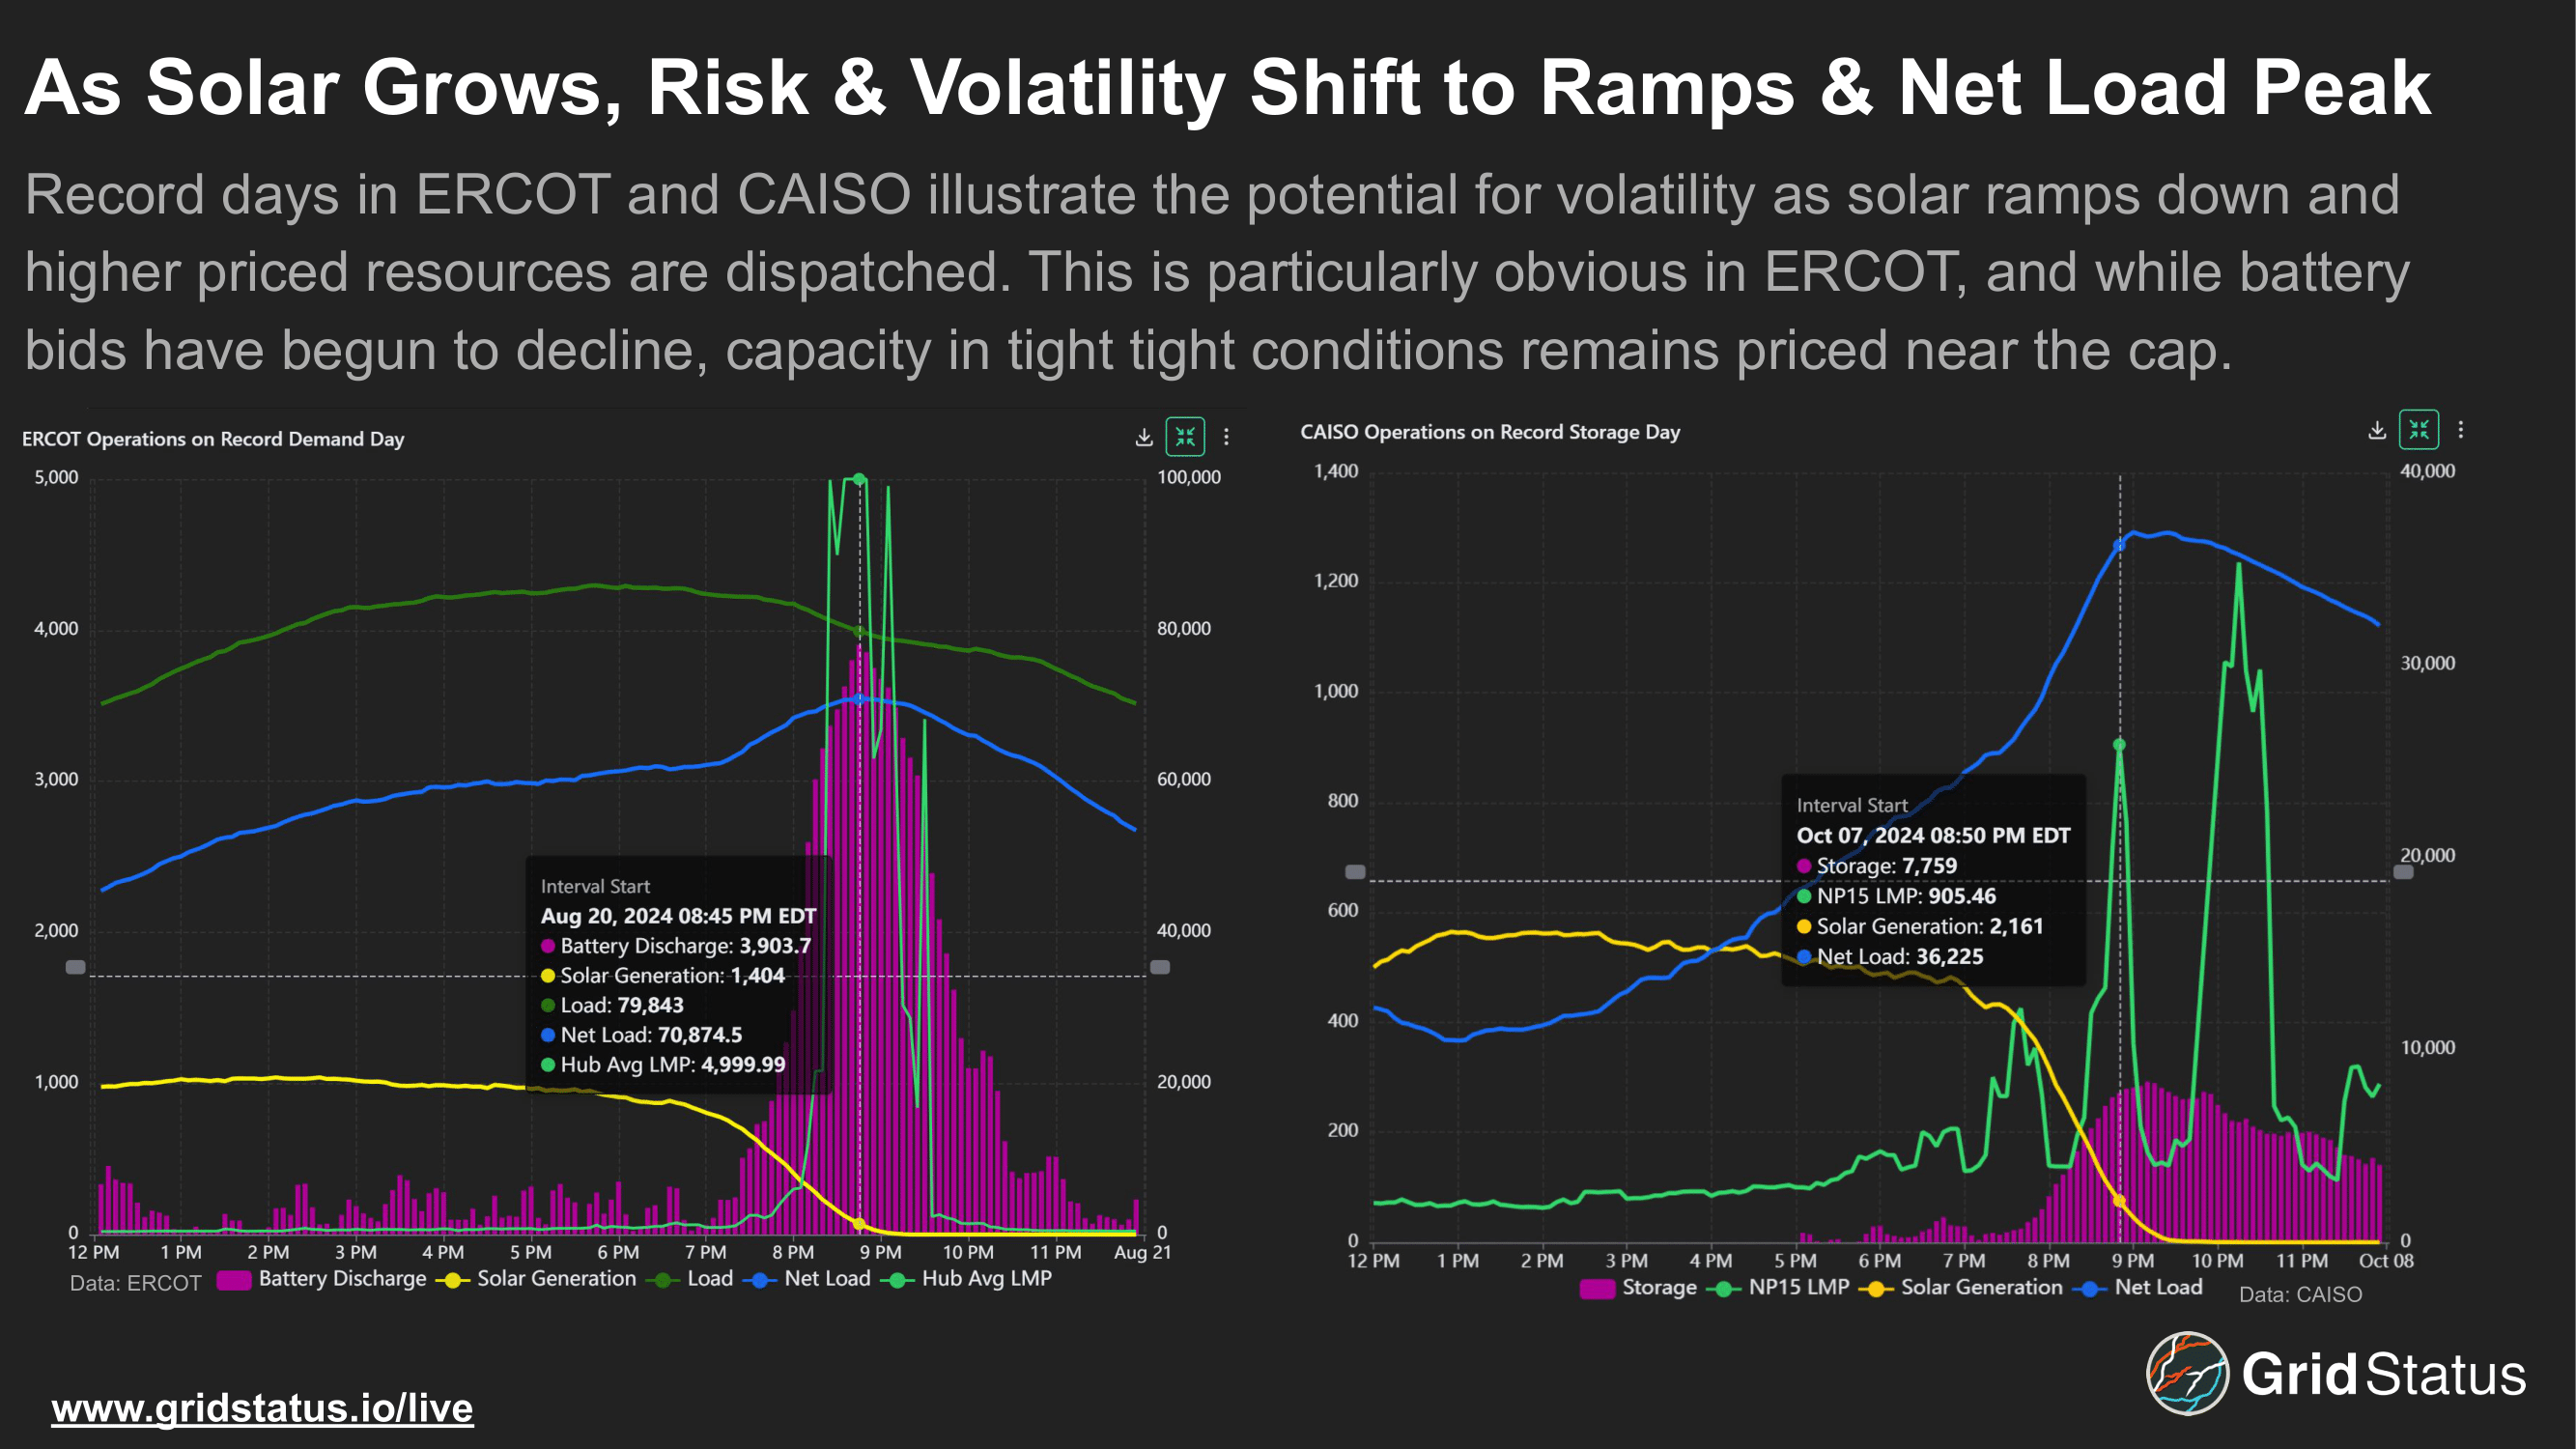
Large solar deployments create new risks and opportunities. Looking at a load record day in ERCOT and storage discharge record in CAISO, prices are much lower while solar is generating, but as it ramps down prices escalate along with net load.
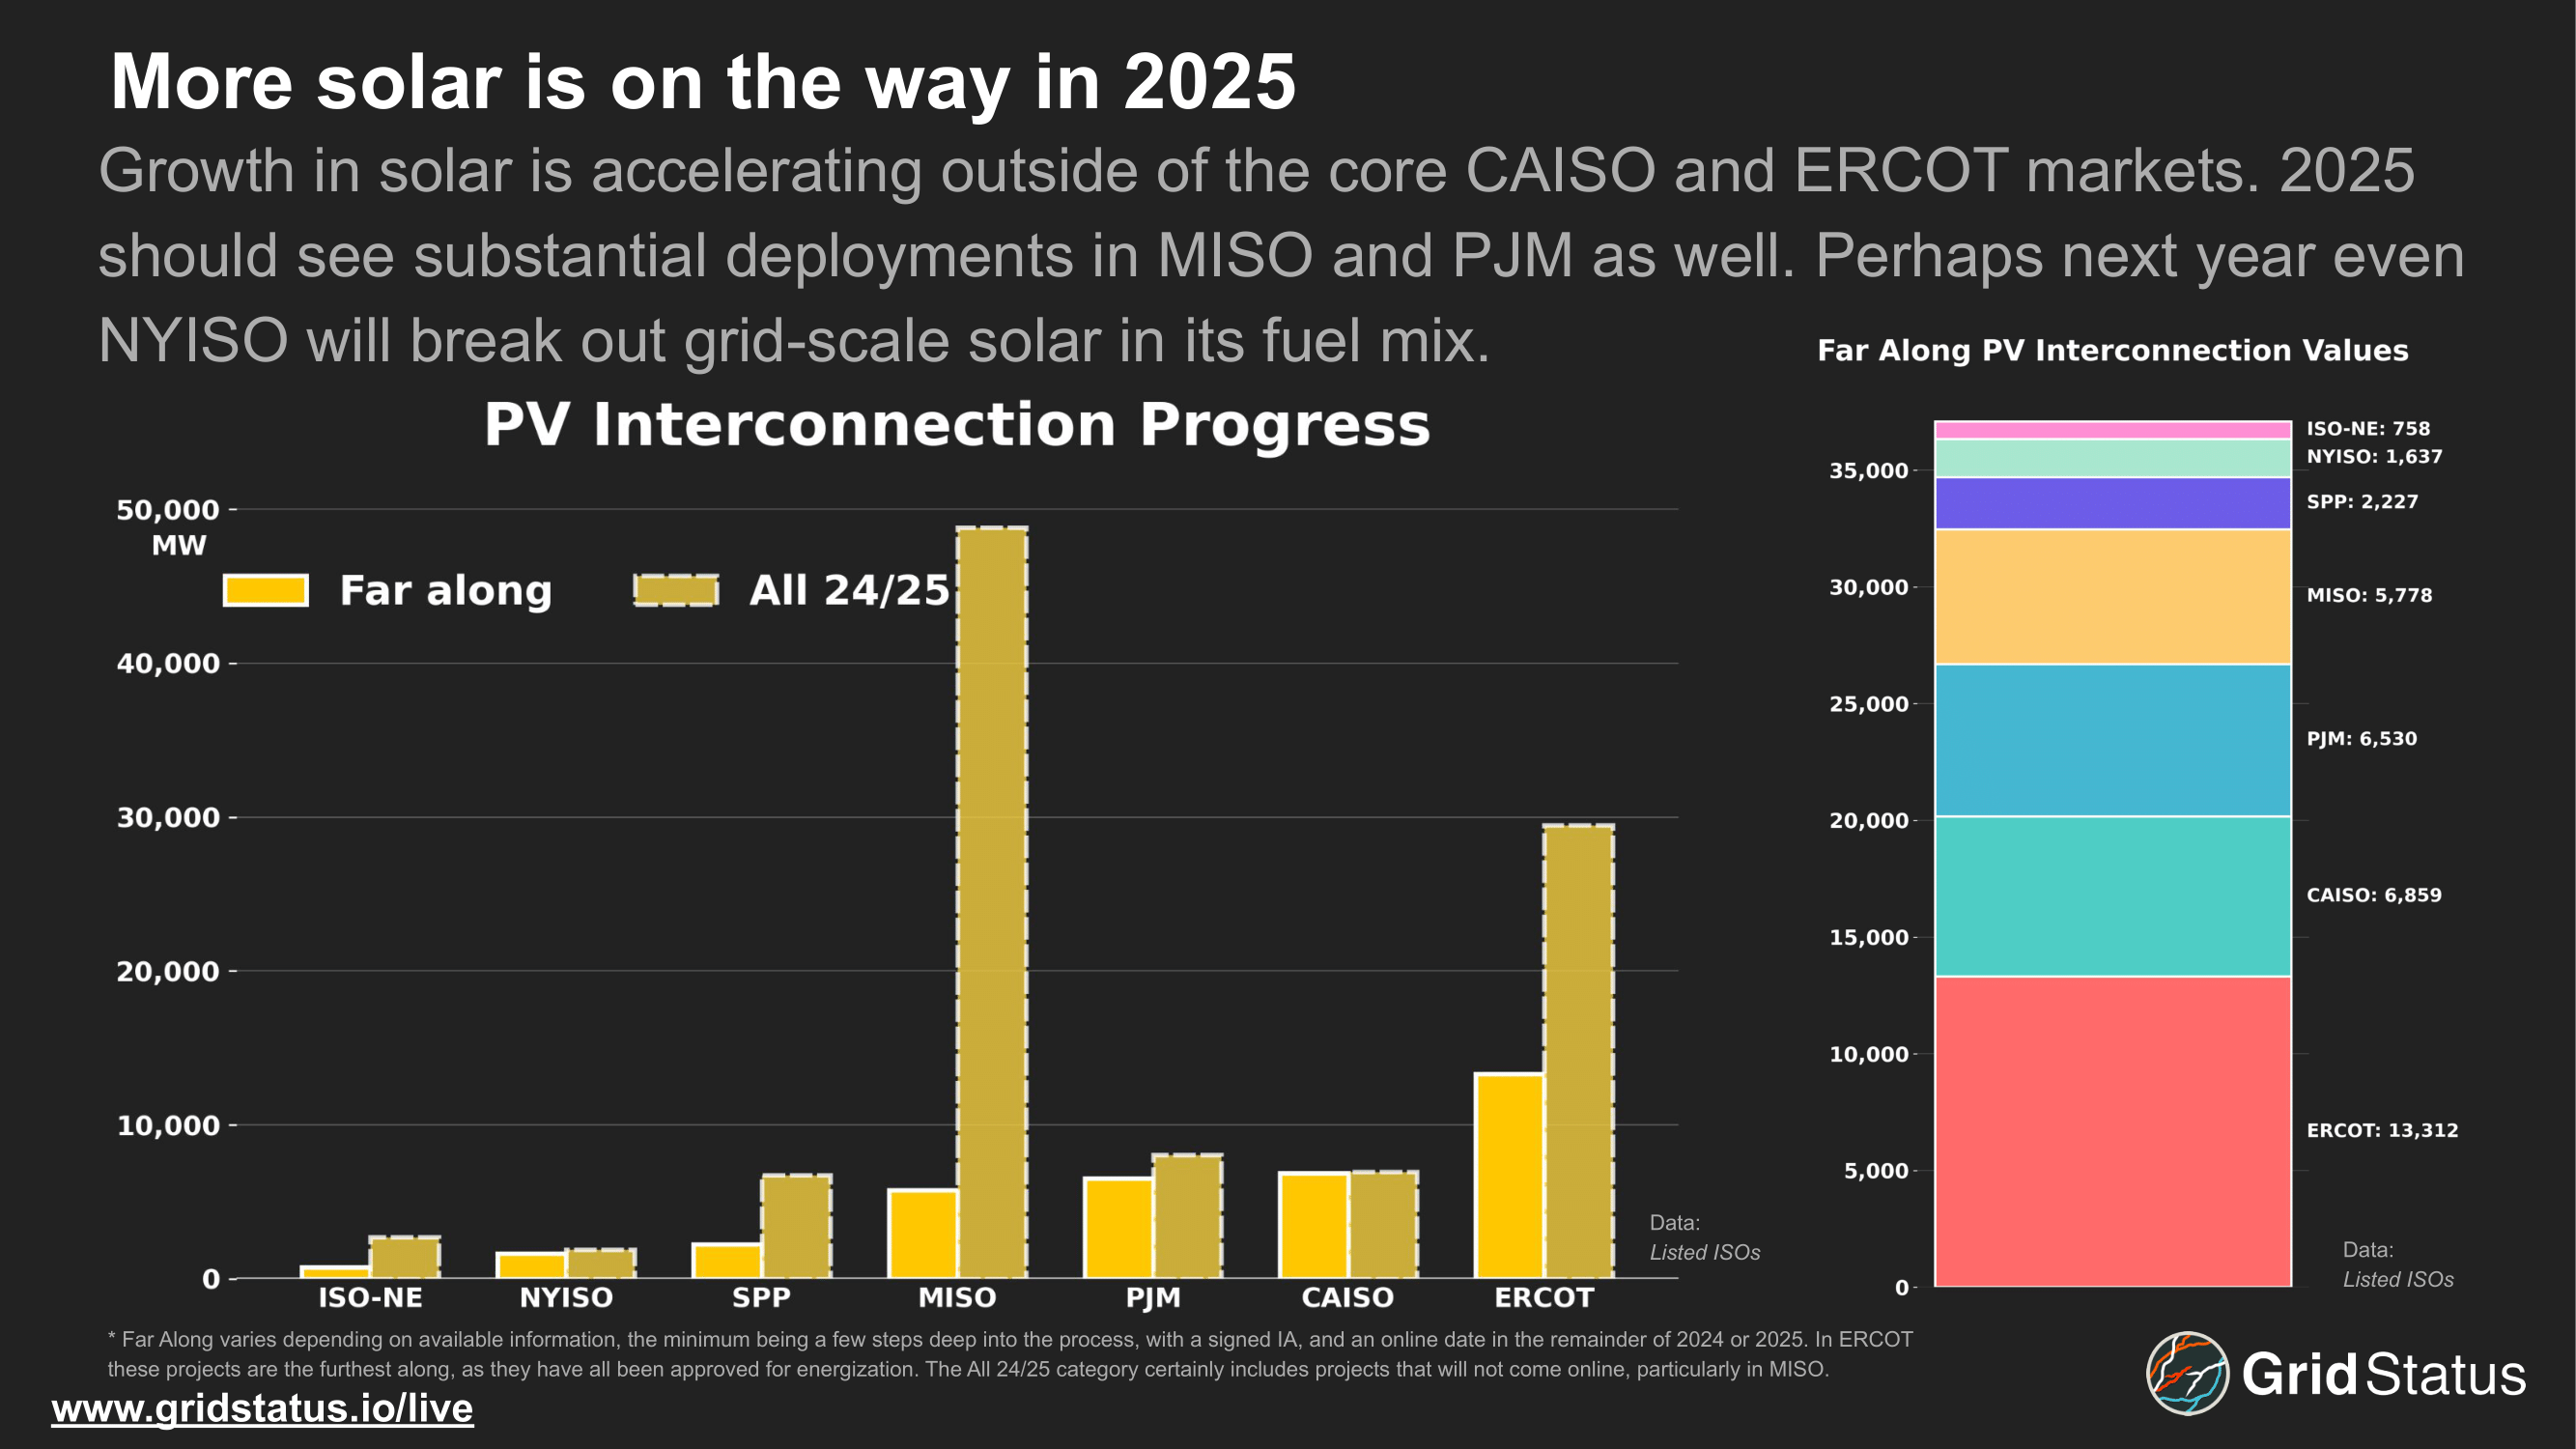
2024 isn't the end. Solar will continue to make inroads in CAISO and ERCOT while deployments grow in MISO and PJM. What actually comes online in 2025 is an open question. Never trust a COD until approval to energize has been reached (just check MISO's second bar for evidence of that), but the volume of projects is high enough that progress is likely to continue.

