Net Load Ramps: How Texas and California Incorporate Renewables
The era of renewables marks a substantial shift in the dynamics of power grids. Today’s dispatchable generation isn’t just operating to meet the relatively predictable slope of demand, but to seamlessly match the ever-shifting puzzle edge of net load.
The nature of the power grid is that as the load fluctuates, generation must correspondingly adjust. Managing short-term changes in generation, or load following, is a familiar task for operators of the bulk power grid to ensure reliability.
The addition of more renewable resources like wind and solar power to the generation mix makes the process of balancing supply and demand more complex. Wind and solar resources, being non-dispatchable and preferential to be utilized to avoid curtailment, introduce a new dynamic to grid operations. Now, grid operators have to react not just to load changes but also to fluctuations in renewable generation in order to maintain a balance between supply and demand.
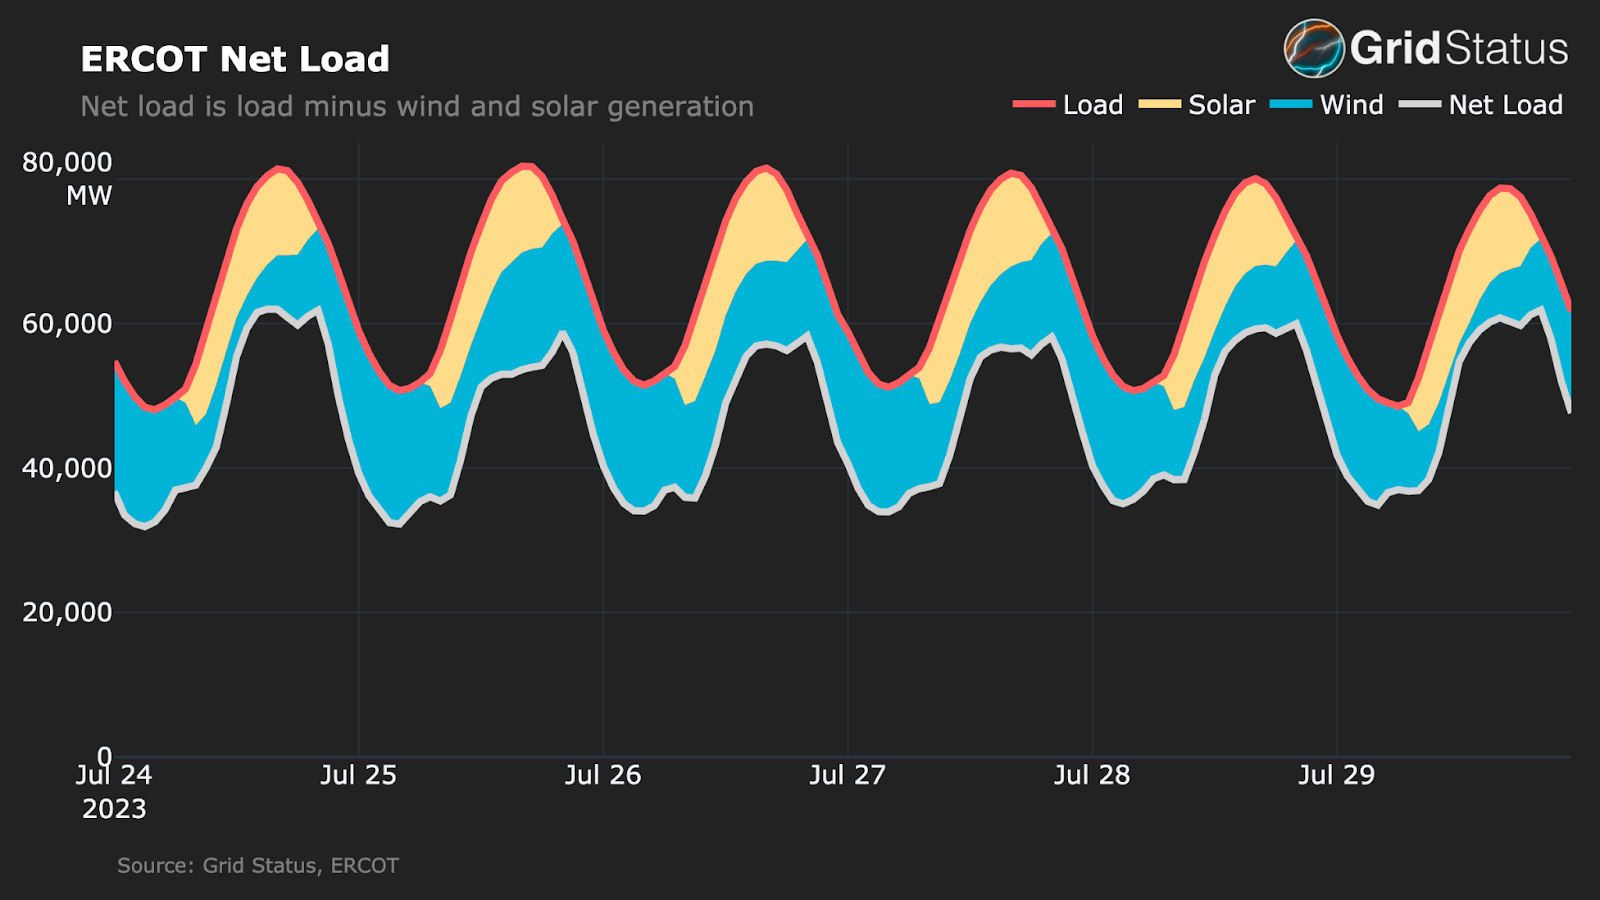
That's why we look at net load, which is load minus wind and solar generation. Net load represents the demand that other power sources, primarily fossil fuel plants, must meet in order to balance supply and demand on the grid.
Provided the grid has enough generation capacity to meet demand, the key factor for reliability isn't the net load itself but its fluctuations over time, referred to as net load ramping.
As we will show by looking at data in this post, net load ramping leads to demands on thermal plants that are not only more erratic, but increasing in magnitude.
Net Load Ramping is one of the defining metrics to understand the integration of renewables into the grid.
Importance of Net Load Ramping
As renewable generation breaks new records and is projected to continue growing, understanding net load ramping is more crucial than ever.
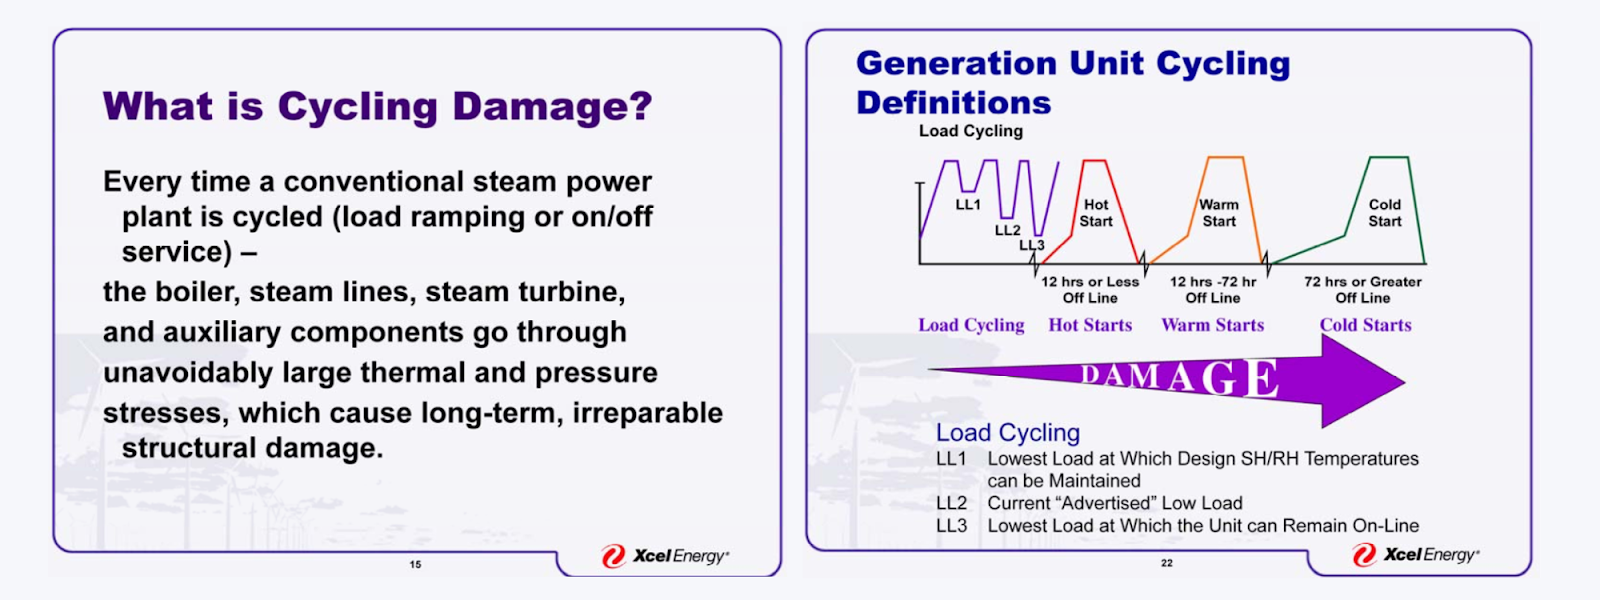
That is because even when sufficient generation capacity exists it has to turn on, ramp up, ramp down, and turn off to meet the swings in net load. This is known as “cycling” and causes increased stress on the thermal fleet. Over time, cycling can cause damage that results in a less reliable dispatchable thermal fleet.
Before we dive into the data, Xcel Energy provides a nice illustration of the impacts on thermal generators as cycling increases. Although these slides were made in 2009, they offer a concise explanation of cycling and its impact on fossil plant reliability.
Failing to account for increased cycling stress of the dispatchable thermal fleet is a fundamental flaw in most energy transition models, and must be addressed directly to paint a realistic picture of a resource mix that includes more renewables.
A Tale of Two ISOs
In this post, we'll examine load, net load, and ramping in two different Independent System Operators (ISOs): CAISO and ERCOT. The power markets in California and Texas are noteworthy because they have the most utility-scale solar in the US, which has a substantial impact on net load ramping.
However, the two ISOs are otherwise very different. CAISO remains ahead on standalone batteries and has massively more behind-the-meter solar and import/export capability. Conversely, ERCOT uses far more energy to serve many fewer people, has surprisingly little BTM solar, a much larger fossil fleet, and some serious internal constraints via the Generic Transmission Constraints (GTCs) whose severity can greatly exceed any interfaces in CAISO.
Let’s start by looking at ERCOT
Load vs Net Load Ramping in ERCOT
Earlier, we outlined how net load can meaningfully vary from load. Below, we've plotted the actual load and net load from last week in Texas. To show the ramping dynamics, we shaded the background of each continuous period of ramping in the same direction based on the total MW change from start to end.
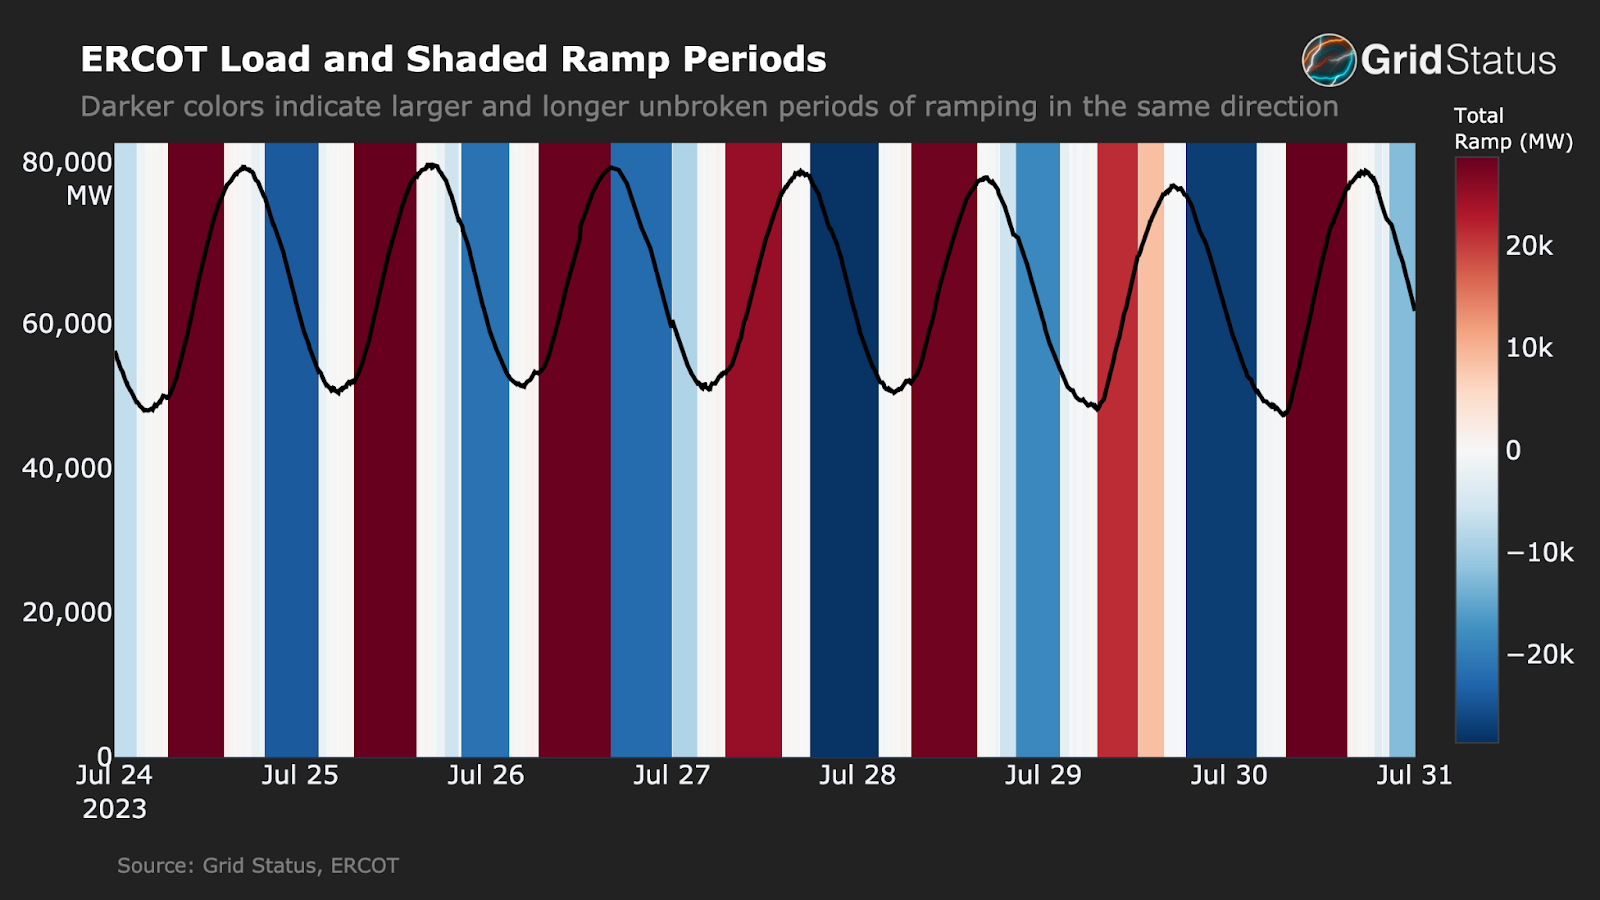
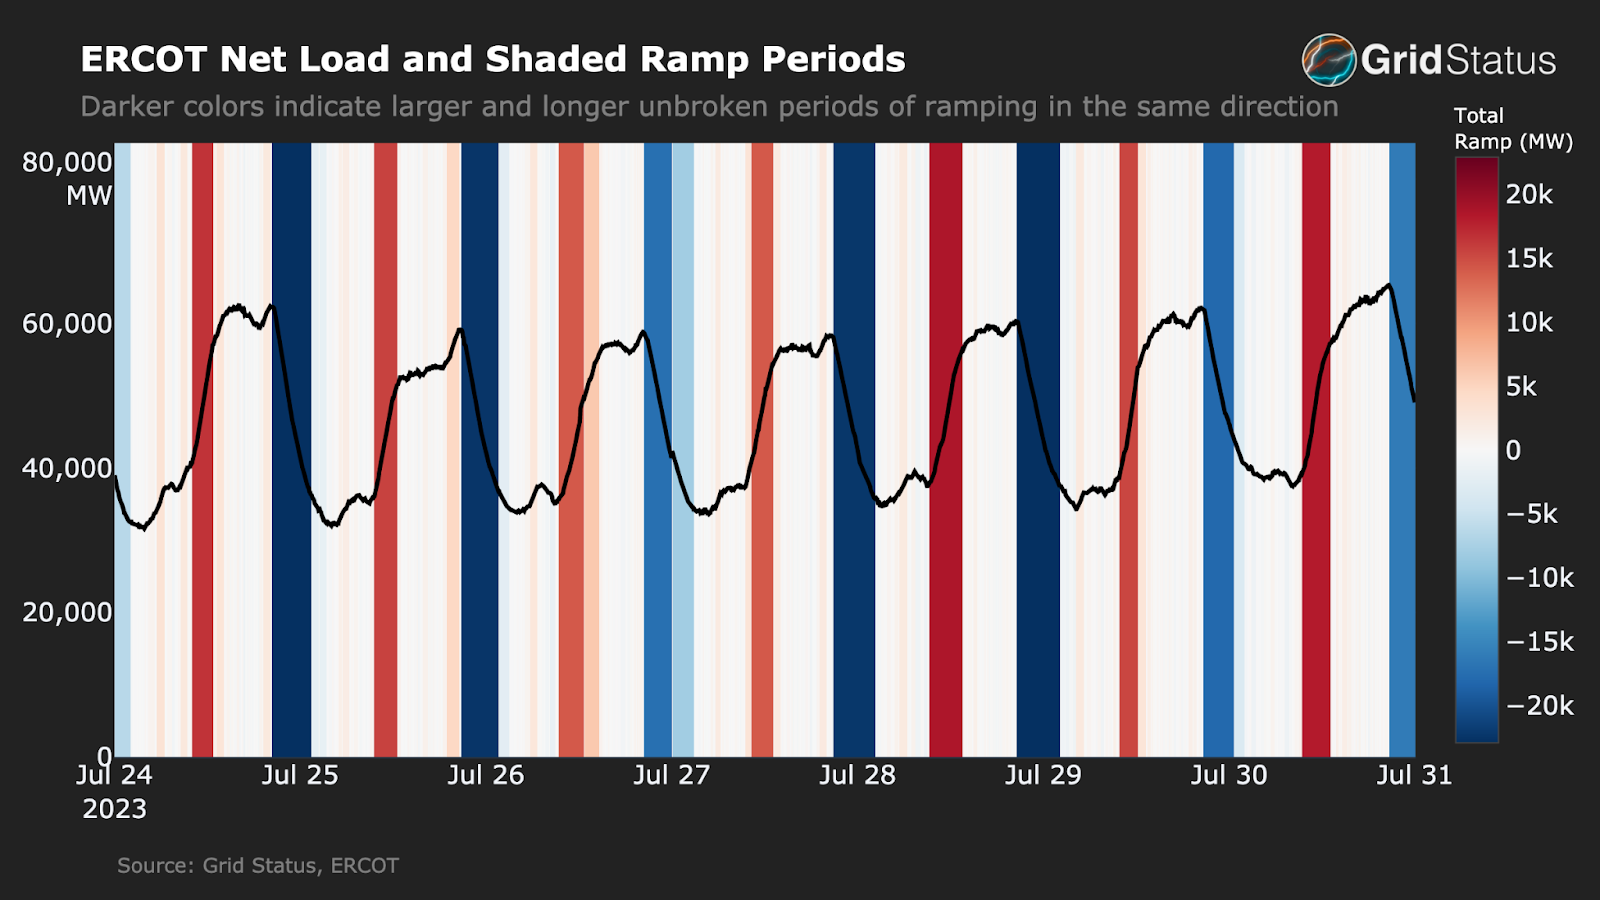
In these figures, the red areas denote an uninterrupted upward ramp, while the blue areas represent a downward ramp. The color intensity of these areas is determined by the total MW of movement during the ramping period.
First, what do we see comparing load vs net load in ERCOT? In Texas, load peaks in the late afternoon and early evenings with long-duration, large-MW ramps on either side. When looking at net load, the predictable pattern of load changes to an erratic sawtooth edge, a shark in serious need of dental work.
It’s important to emphasize we are using 5 minute intervals to determine periods of continuous ramping in the same direction. That means rapid directional changes lose their shading unless the MW amount is quite large.
With that in mind, let’s compare the ramping dynamics of each figure. When we consider net load, the continuous ramp periods become shorter due to increased variability of the net load compared to load. We also see that the uninterrupted net load down ramps tend to be longer than up ramps. This is a flip from load ramps that tend to have longer up ramps.
From midmorning uncertainty to the mountain range peaks, net load is an altogether different beast compared to the relatively tame load curve in ERCOT.
Load vs Net Load Ramping in CAISO
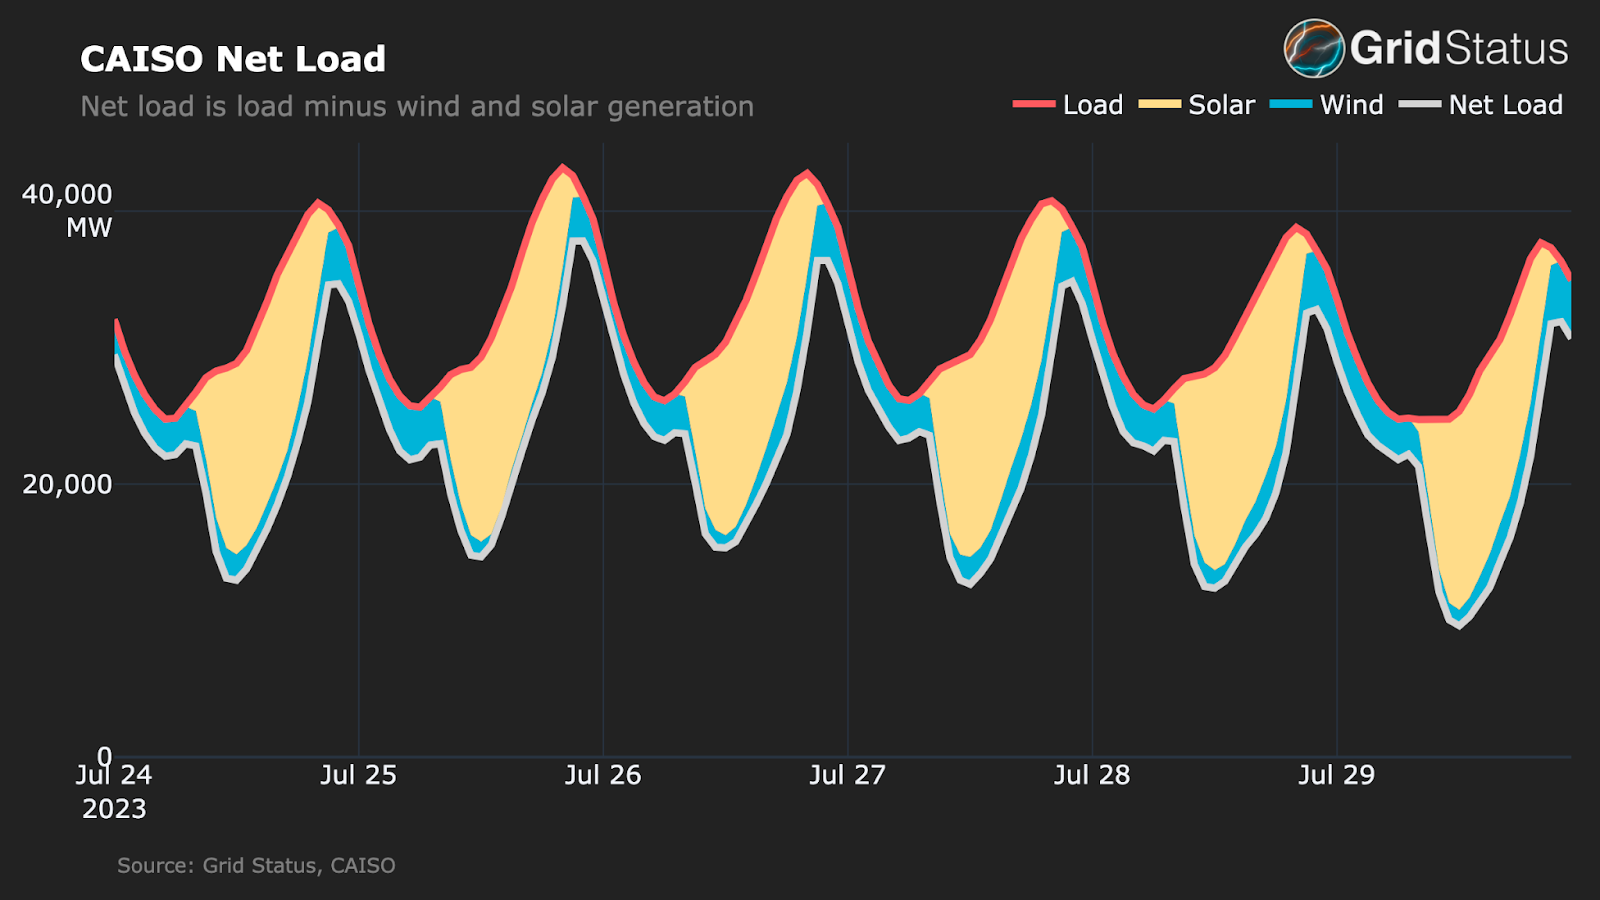
Now, let’s look at the same graphs over the same time period for CAISO. To be clear, this is not an entirely apples-to-apples comparison, as CAISO’s peak load tends to be in September, but is a good demonstration of how even the fundamentals can differ greatly between these markets.
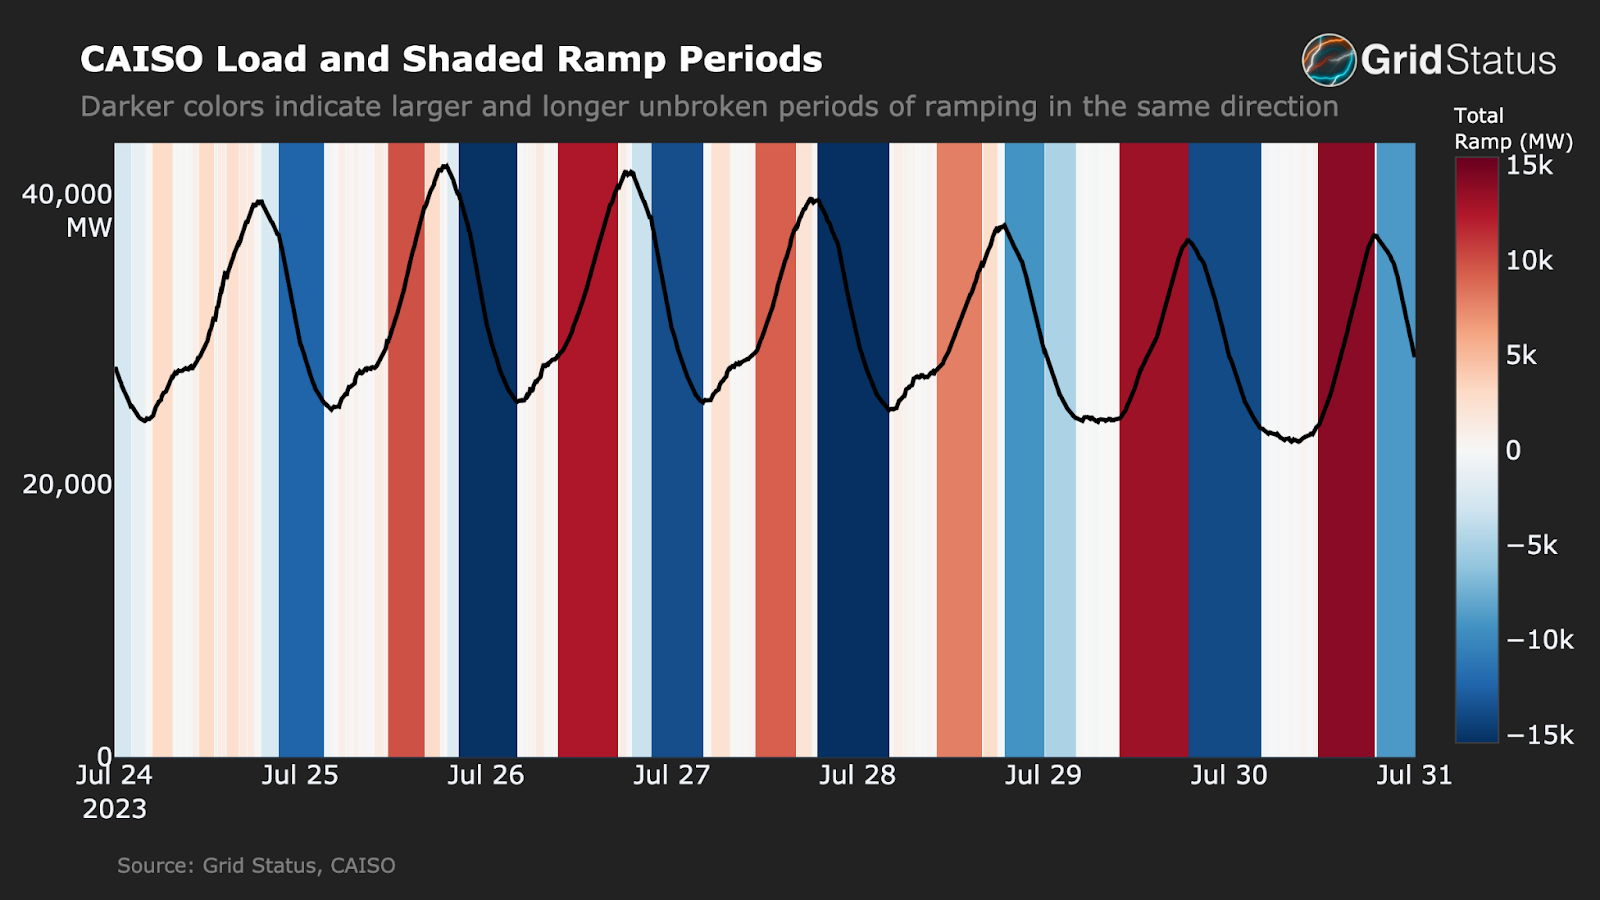
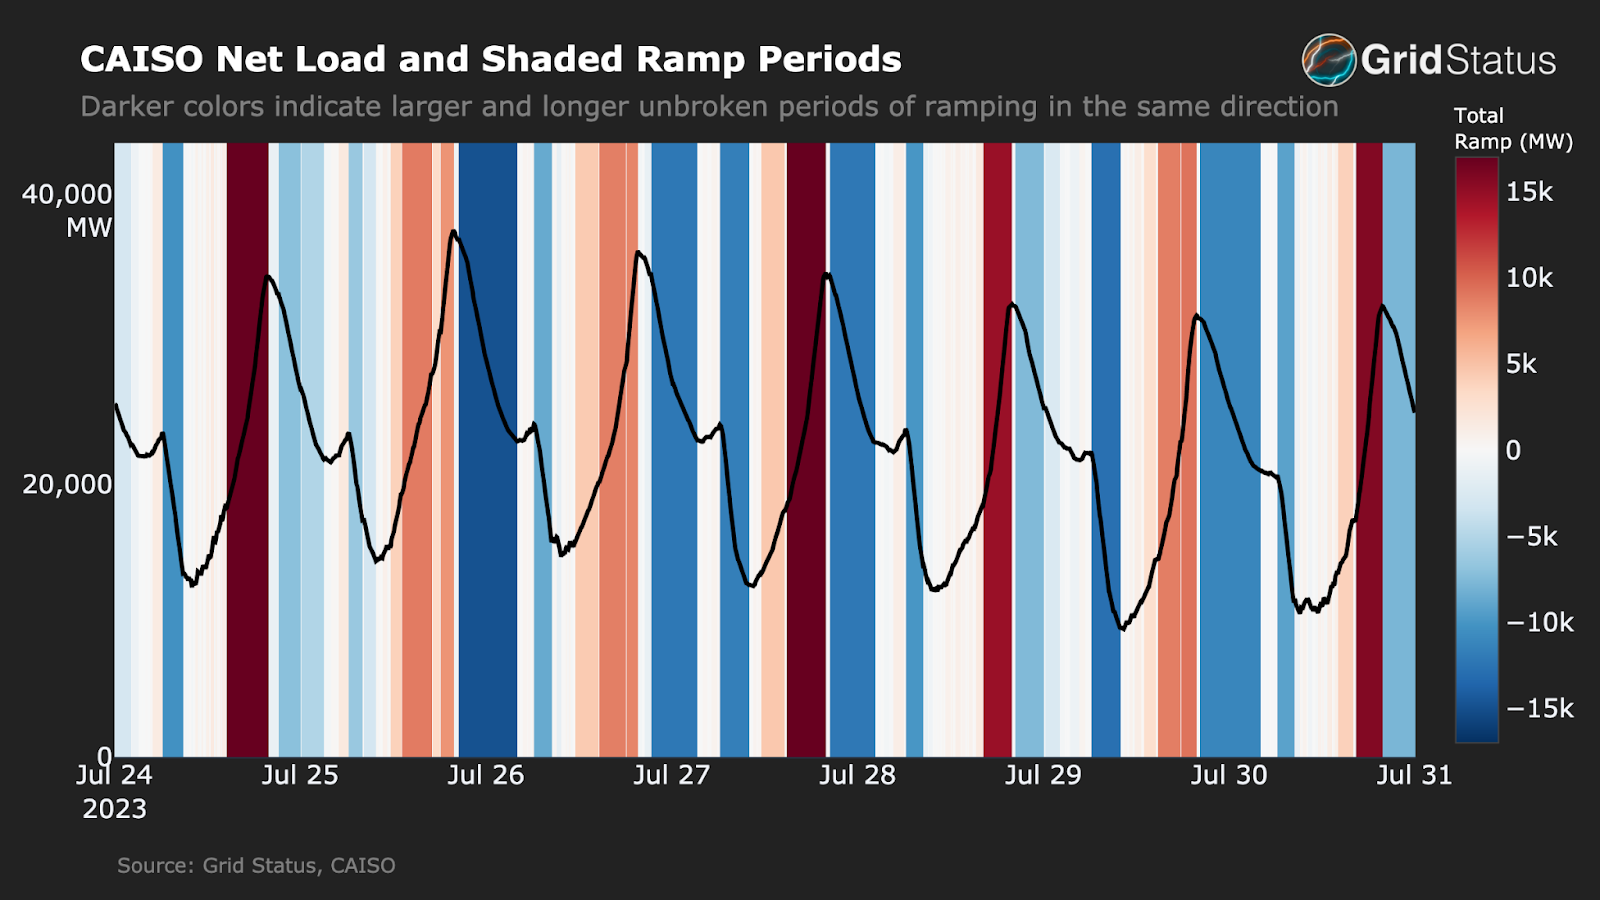
What do we see in CAISO? CAISO’s load graph is less consistent than ERCOT’s, but, the curves remain fairly smooth. The net load shape is also significantly different than load, but we still see peaks rather than the plateau of moment-to-moment variations visible in ERCOT.
A few things are contributing to the dynamics we see in CAISO vs ERCOT
- CAISO doesn’t have the same transmission bottlenecks that can affect operations in ERCOT
- ERCOT doesn’t have the interregional connections to support smoother operations amongst a larger area
- CAISO has substantially more storage in operation - particularly as a percent of their total demand - which smooths things out.
- Overall lower load, which can be managed with fewer coordinating resources.
Ramping Mileage
It’s clear that load ramping and net load ramping had significant differences in ERCOT and CAISO over the previous week, but what do they look like over a longer timeframe?
An hourly line graph over the year gets a bit messy, so instead we’ll introduce another concept, mileage, and organize it by heatmap. Mileage is typically used to refer to the total MWs provided for regulation services, but in this case we’re using it to define the sum of the absolute value of each up and down ramp during a given period.
ERCOT Mileage
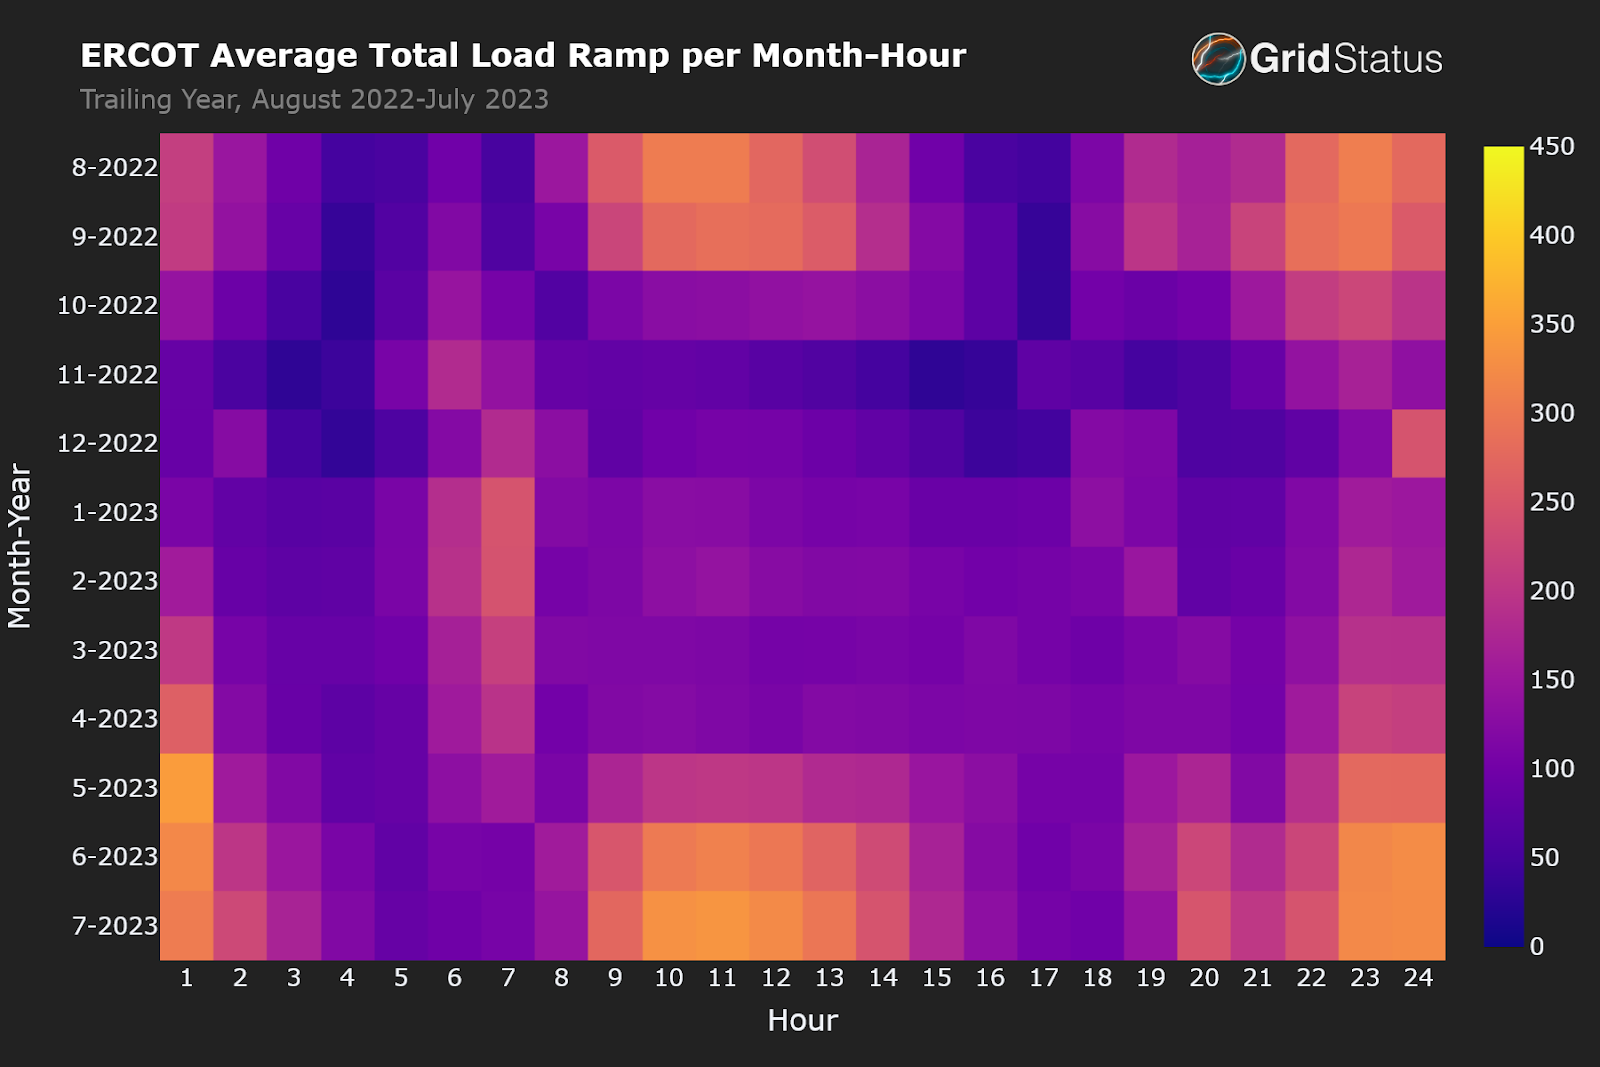
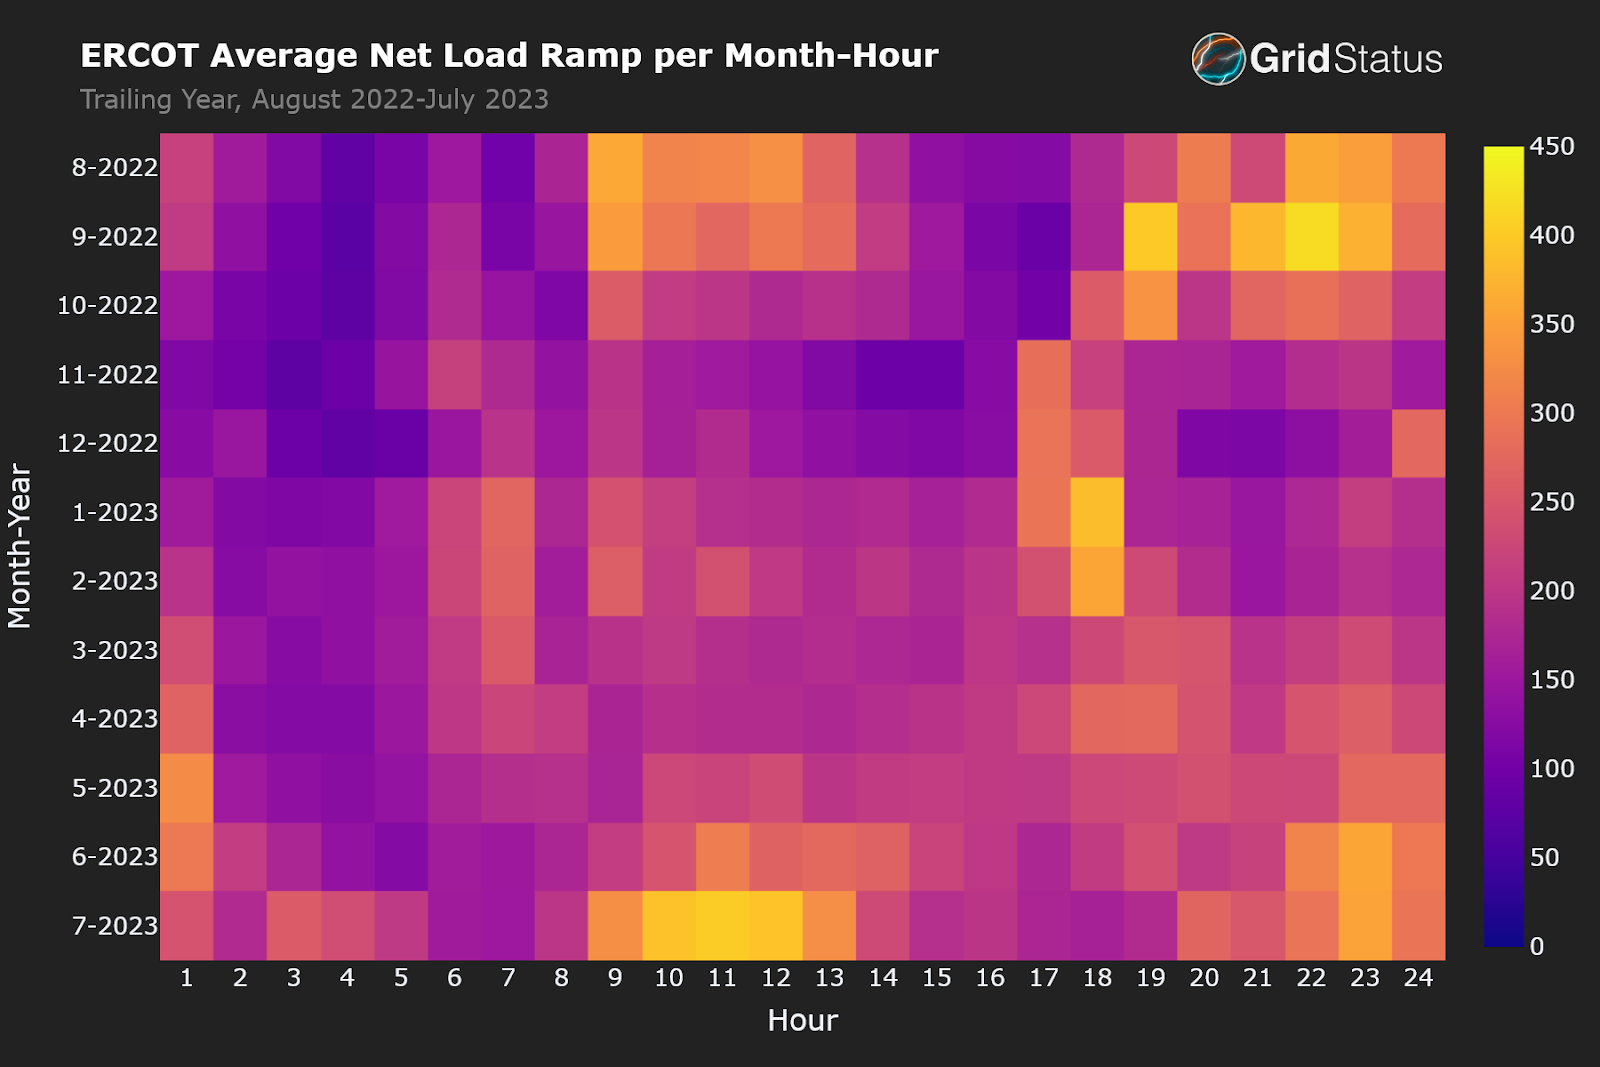
These figures show the average load and net load mileage by hour for each month over the past year in ERCOT. The first one, load, displays the same well-defined ramping periods seen in the first ERCOT figure, while also showing a clear seasonality, with higher ramping suggesting a larger range for load during the summer months. Conversely, the mid-morning and late evening hours have relatively little ramping year round, while the winter months are a daily average nadir.
The net load variant not only shows the total MW required increases in almost every hour, but narrows the difference between peak-hour-summer ramp and winter doldrums. This is also clearly seen in the net load ramp shadings and the rollercoaster peak hours in the previous section, but here it manifests across the board. Additionally, as many commentators have noted, this is the year where solar has really taken off in ERCOT, and indeed, this can be seen in the July morning hours for 2023.
While load requirements seem manageable, the actual perturbations in net load over the course of a day have only placed more stress on dispatchable units.
CAISO Mileage
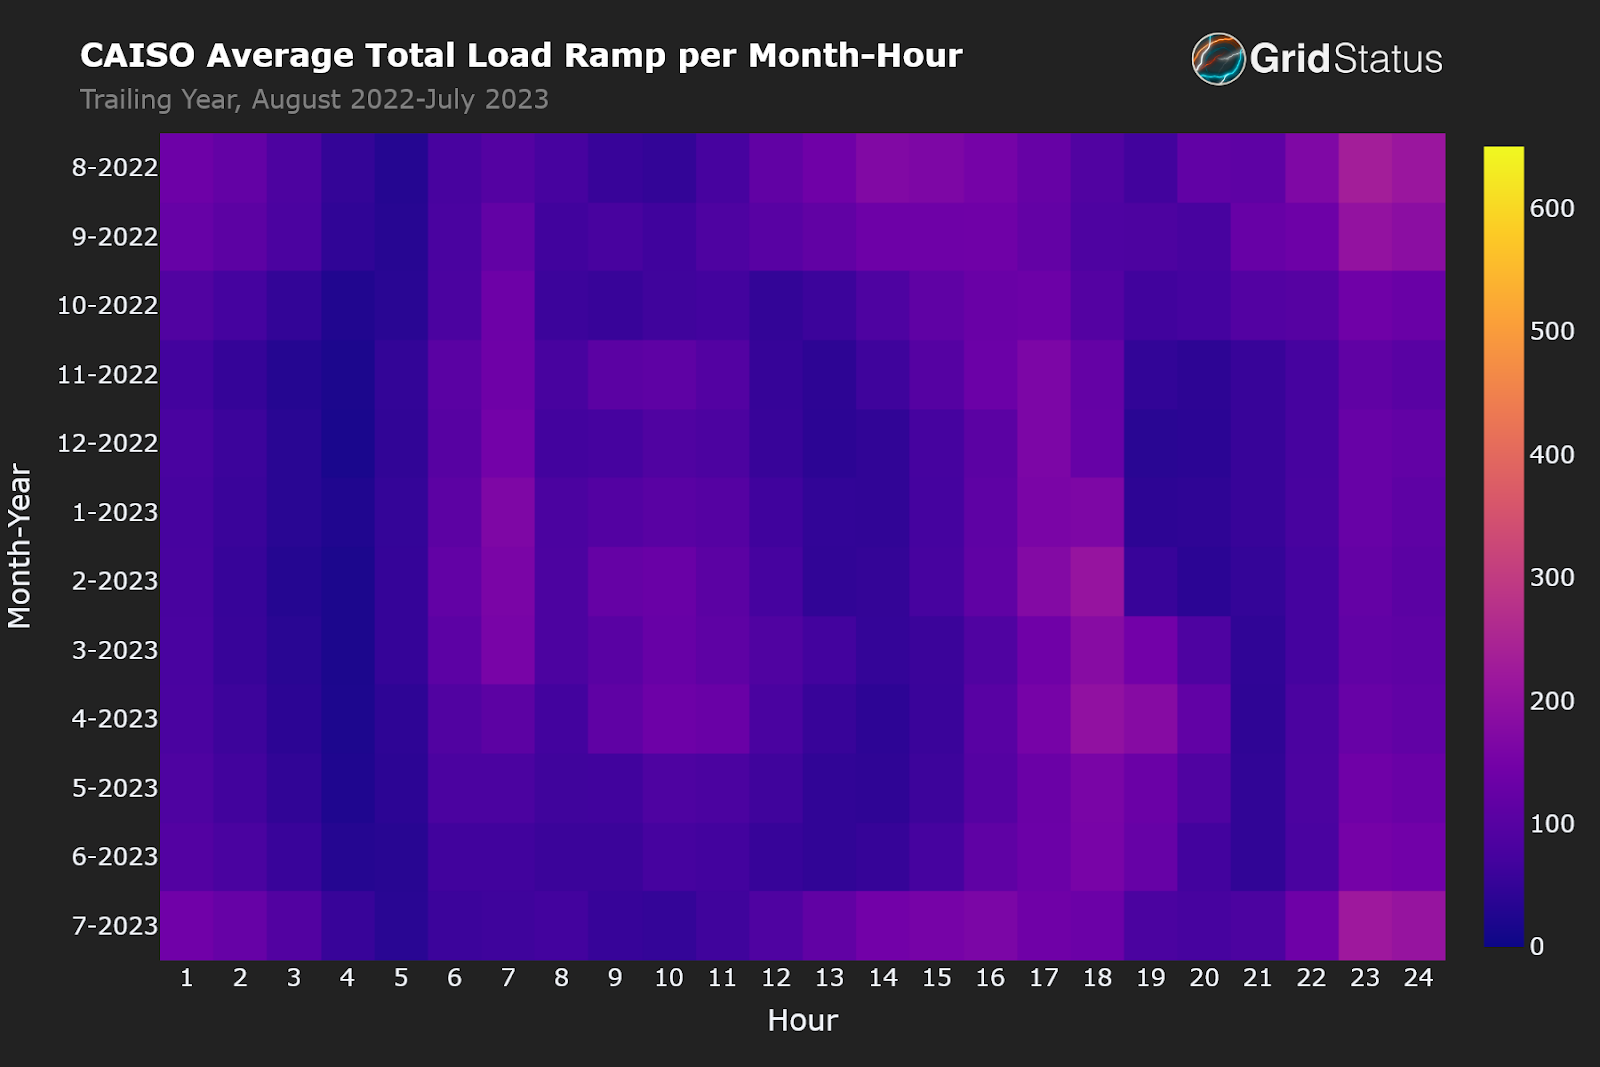
For California’s load ramp you can see that it doesn’t exhibit the same seasonality as ERCOT and actually has late evening peaks during the hotter months while winter-to-spring afternoons into early evenings also stand out.
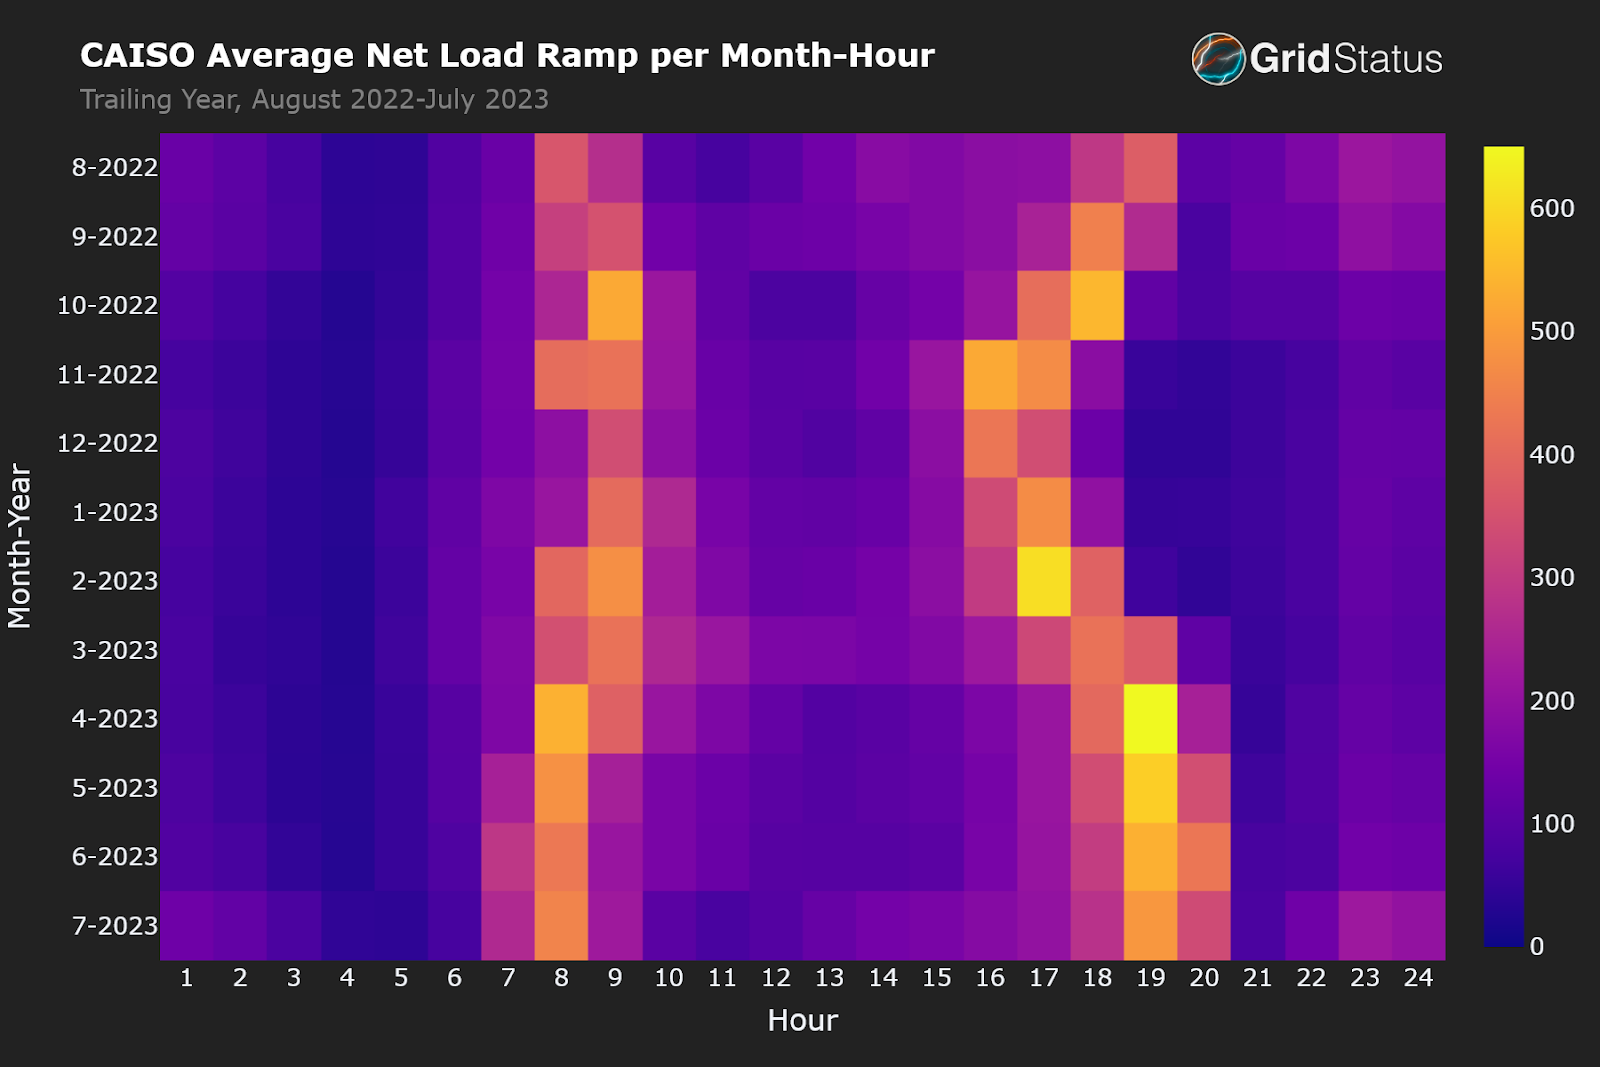
In CAISO’s net load heatmap the impact of solar is clearly evident. While ERCOT’s entire time frame saw increases in ramping, CAISO’s net load variant has two distinct periods of high demand for ramp which shift throughout the year depending on sunrise and sunset. The strong synchronicity of solar in CAISO compared to ERCOT also has a geographic reason - California is oriented north-to-south, while Texas solar is spread across a larger east-to-west spectrum.
While mid-morning hours have very low net load ramping across the year, late afternoon into early evening and late nights require substantially more ramping capability than seen in ERCOT. It’s also worth noting here that the colorbar max here - 650 MW - is 33% greater than the limit on the ERCOT charts.
CAISO may have fewer hours with stress from net load ramping, but the most demanding hours go beyond ERCOT’s current peaks.
Quantifying Load vs Net Load Ramping Divergence
Now, let’s take a look at similar graphs that further demonstrate the necessity of considering net load ramping over load ramping.
In these graphs, we plot both the absolute sum of the daily 5-Minute Load Ramp vs the Net Load Ramp needs. We then calculate the cumulative sum of the difference between them across the entire year in order to represent the additional cycling stress put on the dispatchable fleet in each ISO that isn’t described by just the load.
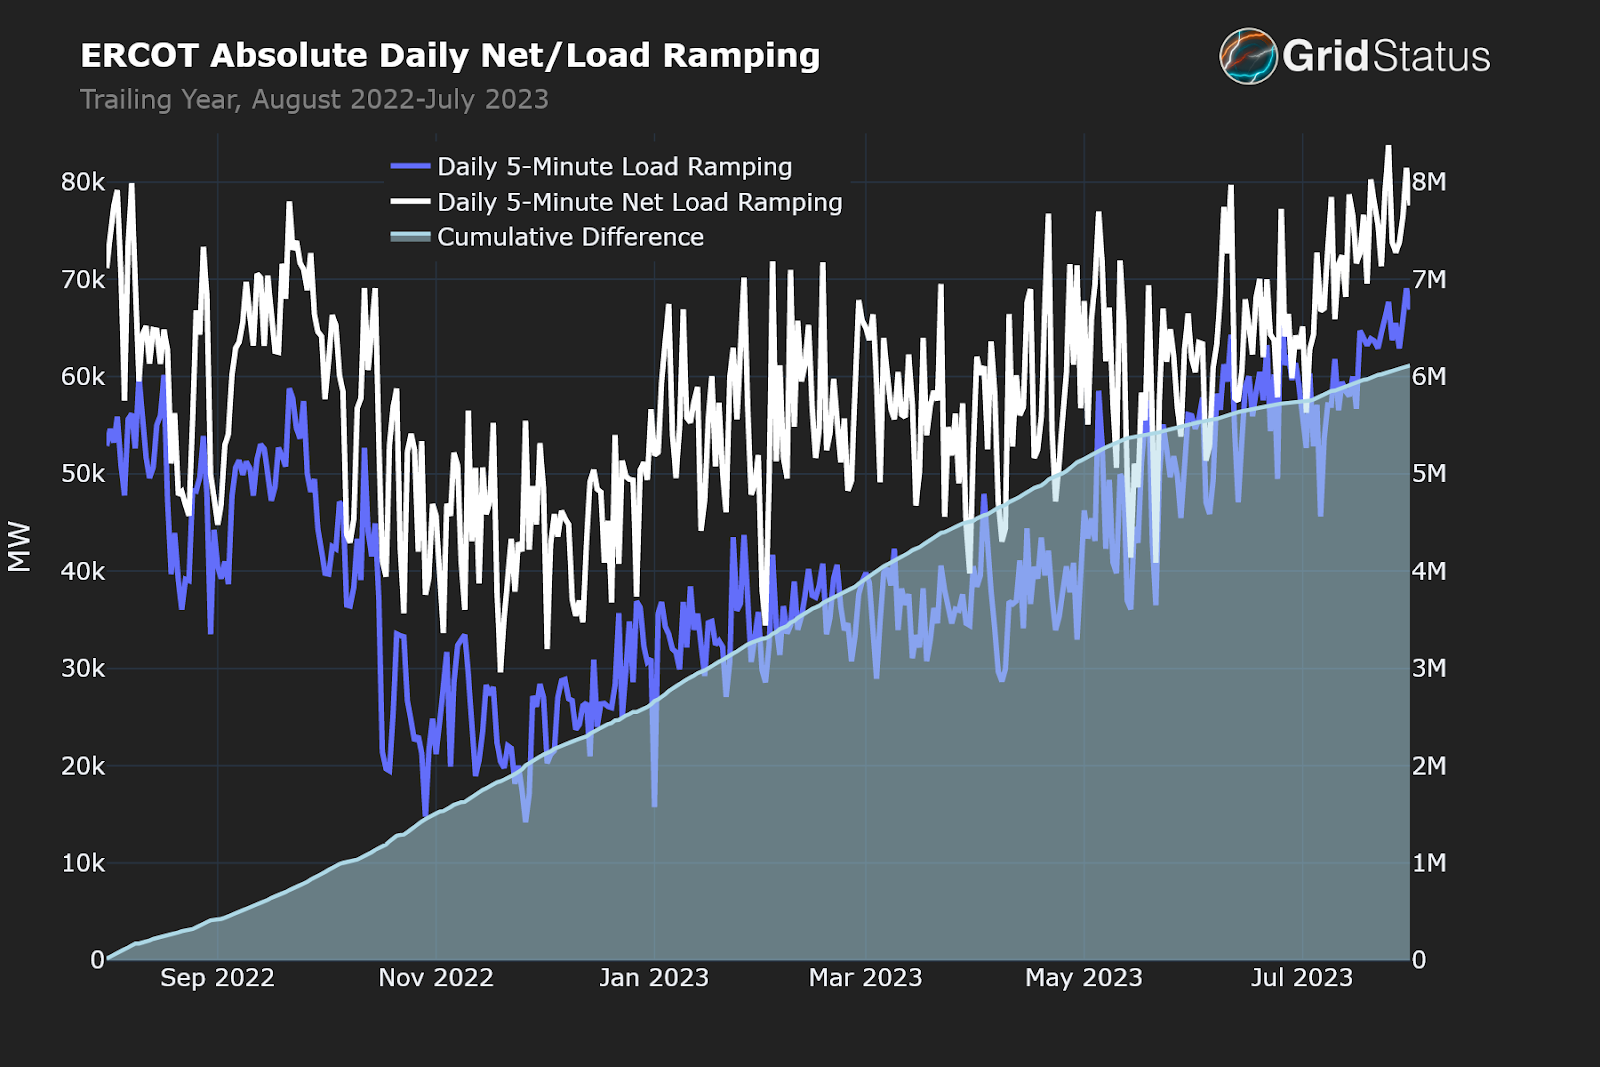
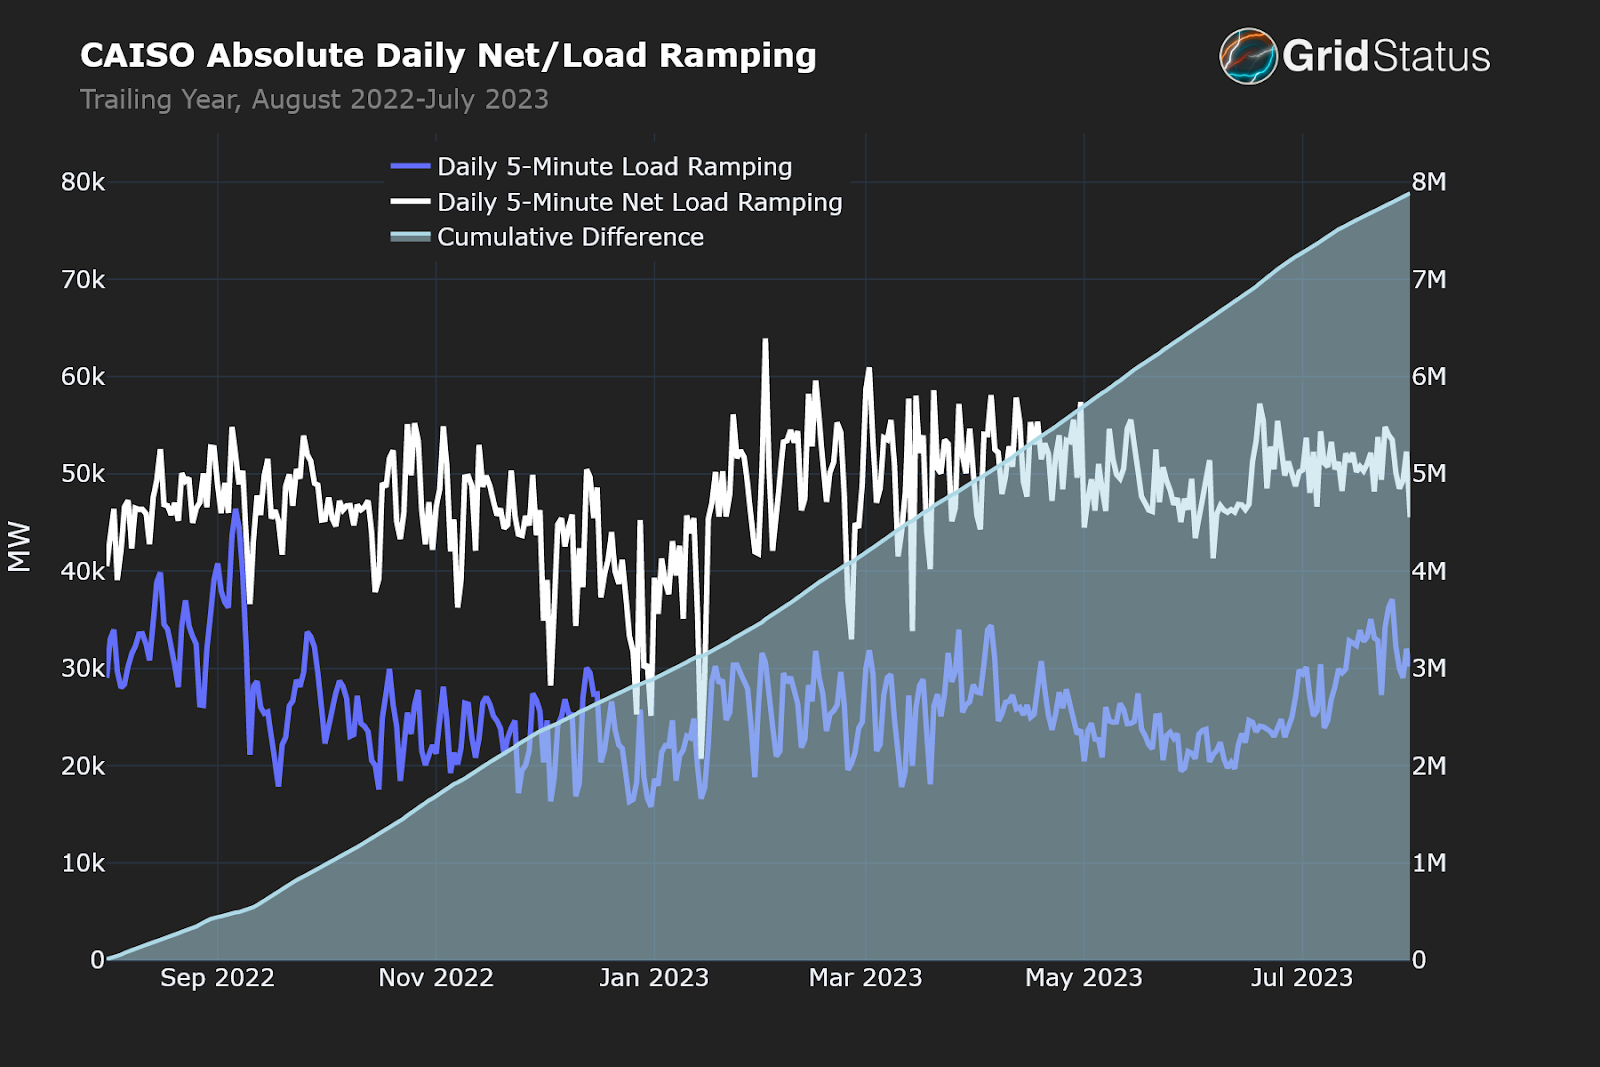
When it’s really hot, the load is so high that the difference between load and net load levels out. We see this near the end of the graph for ERCOT as Texas was (and still is) experiencing a dramatic heat wave. Conversely, we don’t really see that in CAISO outside of a brief September kink in the line because the load is so much more consistent and overall milder than in ERCOT.
On a day-to-day and season-to-season basis the ERCOT daily net load ramping requirement is more volatile, while CAISO’s is a smaller band most of the time and is steadier annually. Naturally, this may lead one to conclude that ERCOT’s dispatchable fleet is more stressed, but there are two important caveats. First, ERCOT has more dispatchable capacity than CAISO relative to load. Over the previous trailing year from July 2022 through June 2023, the median online dispatchable capacity was 75% of peak load in ERCOT (67% in CAISO) and 61% of median load (51% in CAISO). Second, CAISO’s dispatchable fleet has a much higher portion of duration-limited resources. This is true both on a daily basis (batteries) as well as a seasonal basis (hydropower).
One potentially surprising tidbit is that if you compare only natural gas resources in each control area the median daily generation as a percent of median daily load drops to 47% for ERCOT and 43% for CAISO - a slimmer difference than many people realize. Without the remaining coal facilities, ERCOT’s regularly operating dispatchable fleet comprises a surprisingly small portion of served load. While the total installed capacity in the market is higher (57/51 GW installed/summer) plants which run more and more infrequently are always a question mark in tight situations.
Ramping Needs are Changing
To tie it all together, let’s pull some values from the previous charts and take a look at how much they have changed since the same timeframe from 2018 to 2019.
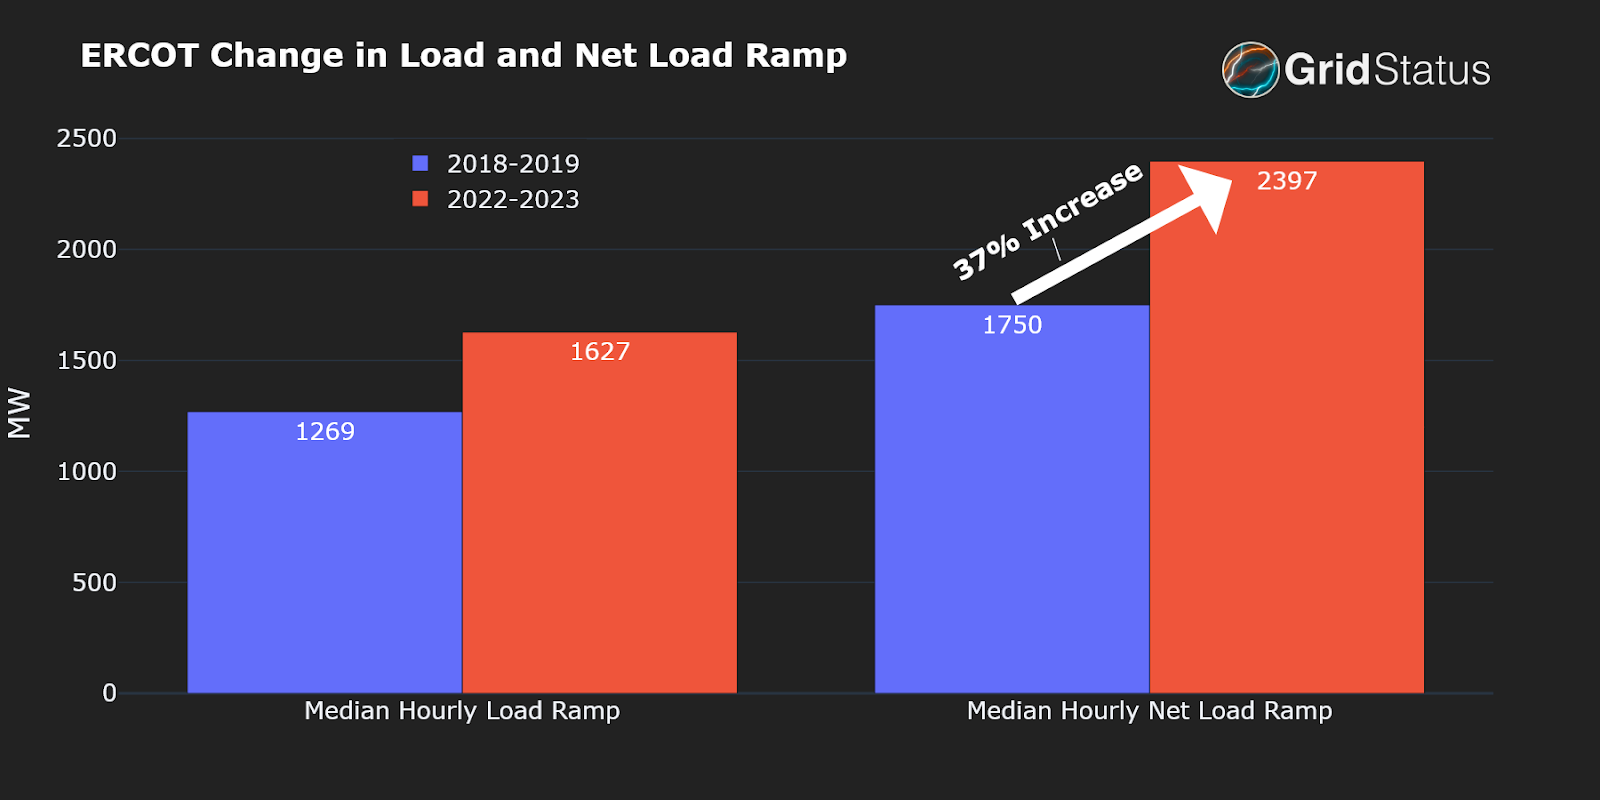
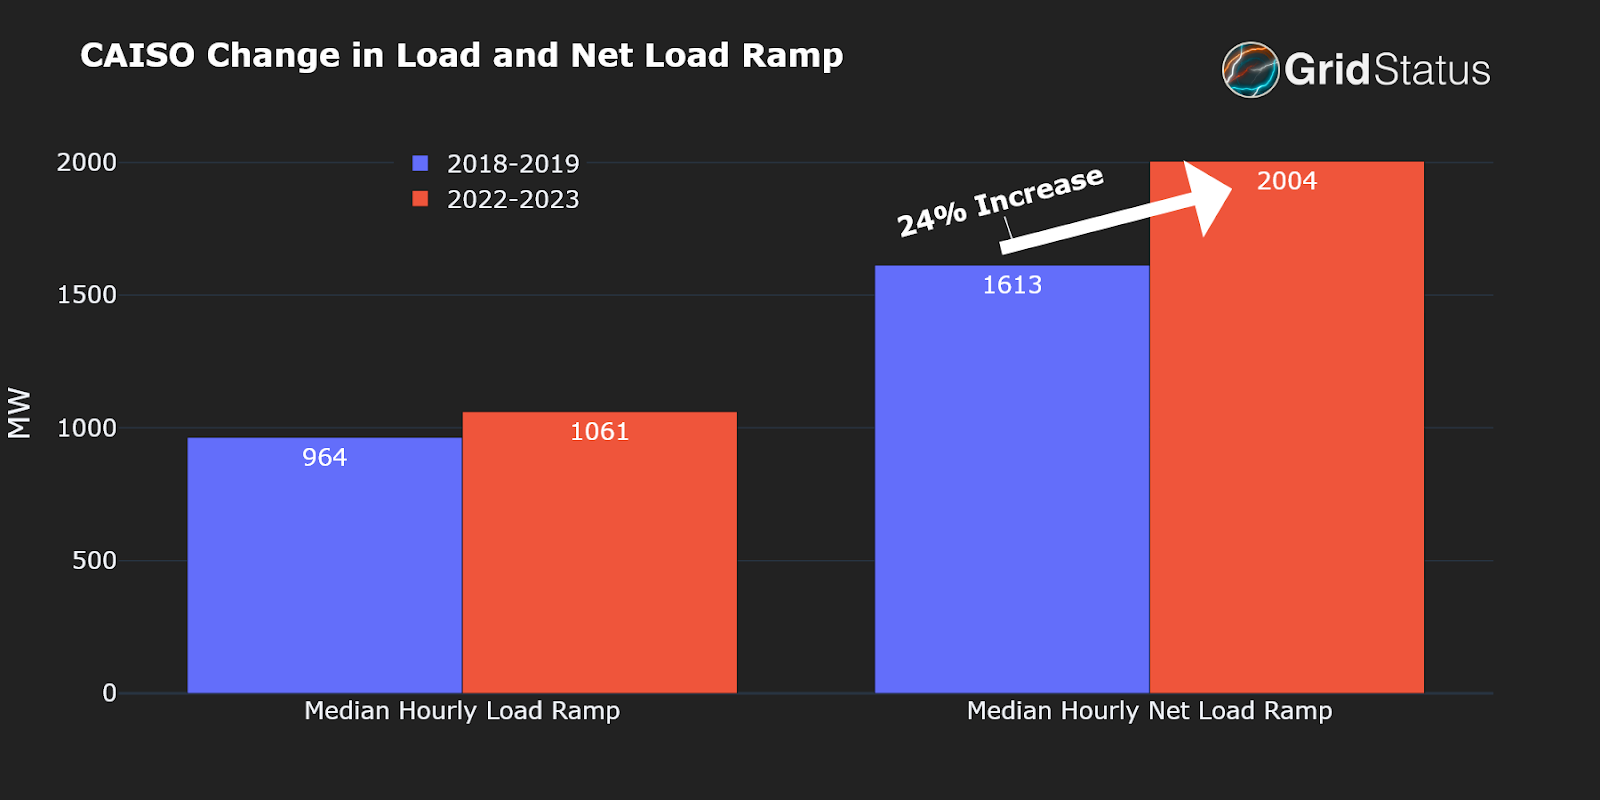
In the most recent year, the median hourly net load ramping exceeded the load ramping by 47% and 89% in ERCOT and CAISO respectively.
We also see that this difference has been growing over time. In CAISO, the median hourly net load ramp increased by 24% since 2018-2019, while load increased by only 10%. In ERCOT, both values are also larger with net load ramp increasing by 37% and load ramp increasing by 28%.
Metrics like these lay bare the tremendous difference in operating a grid around load versus net load.
Conclusion
Today’s dispatchable generation isn’t just operating to meet the relatively predictable slope of demand, but to seamlessly match the ever-shifting puzzle edge of net load. The new reality for the electric grid is that simply focusing on the load doesn't fully capture the impact of fluctuating renewable generation.
In this post, we looked at how renewables are already having a profound impact on the dispatchable thermal fleet via the increasingly erratic and strenuous demands of net load ramping.
The era of renewables marks a substantial shift in the dynamics of power grids. Ignoring or failing to adapt to this transformation could lead to an underestimation of the actual operational challenges that our power systems will confront while integrating renewables.
This post is supported by funding from GridLab.