When Thunder Roars- Breaking Down NYISO’s Thunderstorm Alerts
NYISO's Thunderstorm Alerts have a grim origin, but also represent a unique trading opportunity. We dig into the history, impacts, and changes of this weather-induced market mechanism.


The grid is no stranger to the chaotic threats of nature. From rodents to vegetation, managing the largest machine on earth is a never-ending battle. But managing a colossus comes with additional challenges when its limbs attract the stochastic strikes of lightning. Transmission towers, standing 100 feet or more above cleared corridors, effectively act as lightning rods, giving bolts a clear path as they seek the closest way to ground. While infrastructure exists to minimize risks, the impact of lightning on the grid remains an issue to this day.
Storms occur everywhere, but the grid varies, and with it so do measures to mitigate the impact of lightning. Here, we’re taking a look at NYISO’s unique operating posture to mitigate these risks, Thunderstorm Alerts (TSAs). TSAs are rooted in one of the state’s worst blackouts and continue to this day. Despite the grim history, TSAs in the era of NYISO can be an opportunity.
We’ll get into the history behind this mechanism, its market impact, and how it’s changed over time.
Take a Bite of the Big Apple
When lightning strikes, the resultant surge in voltage can wreak havoc on the grid, melting components and damaging equipment designed to enable the steady flow of power. In order to prevent harm, many towers employ a piece of equipment known as a lightning strike arrestor. This relatively simple piece of infrastructure helps to disperse the voltage that would otherwise trigger catastrophic events, though they are not infallible.
Recently, a lightning strike arrestor on a transmission tower failed in Northern Virginia, which triggered a surge in voltage. As mentioned in our Byte Blackout blog, this failure initiated voltage fluctuations near one of the largest concentrations of data centers in the world. Over 1 GW of compute demand switched to internal power supplies, triggering a spike in frequency as demand dropped off, nearly triggering local blackouts as PJM attempted to reduce frequency, albeit with limited tools at their disposal.
While this event is high-profile in recent memory, New York was host to a far more dramatic example. On a hot summer evening during the summer of 1977, a thunderstorm pushed into New York City, resulting in a cavalcade of direct strikes on parts of the ConEd-managed grid.
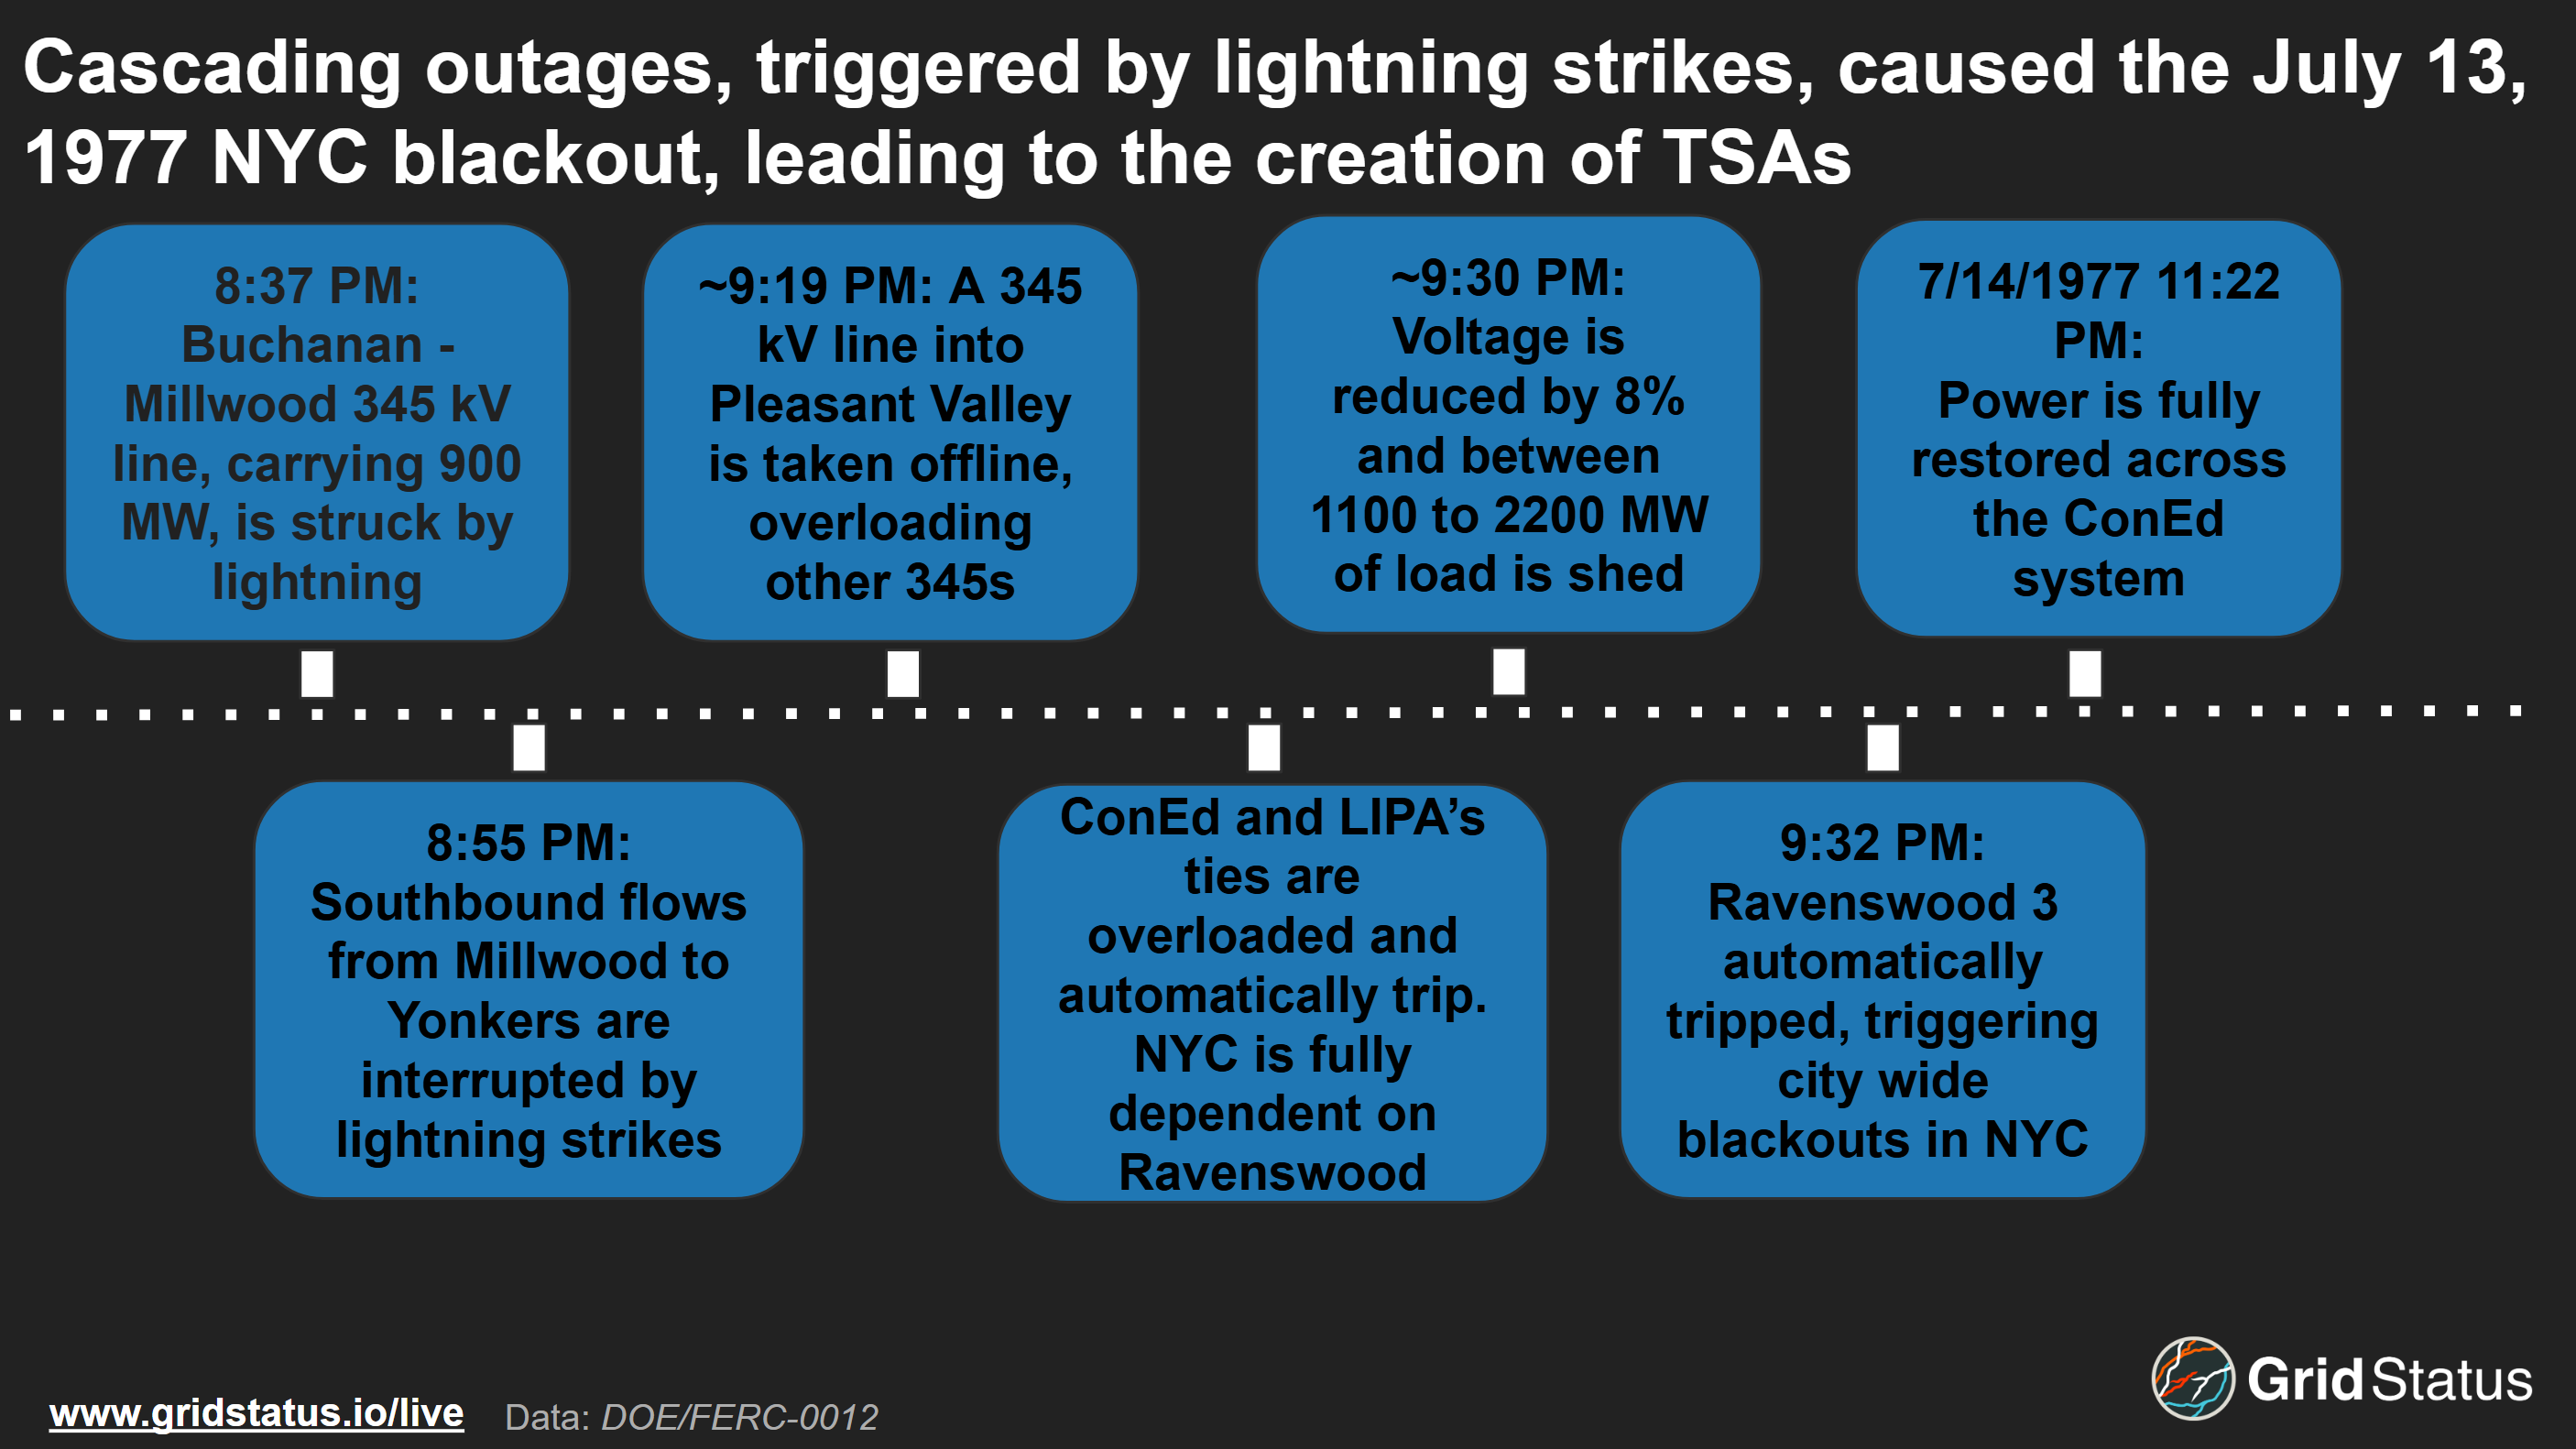
Strikes knocked out transmission lines flowing into New York City, forcing grid operators to reduce voltage and scramble, in vain, to dispatch additional generation. Ultimately, low voltage, driven by a combination of limited location generation and transmission on forced outage, pushed Ravenswood offline and triggered citywide blackouts.
While the eventual loss of Ravenswood on the night of July 13th sealed NYC’s fate, other ConEd generators failed to meet their expected ramping capability in the critical minutes following the first lightning strikes and prior to the blackout.
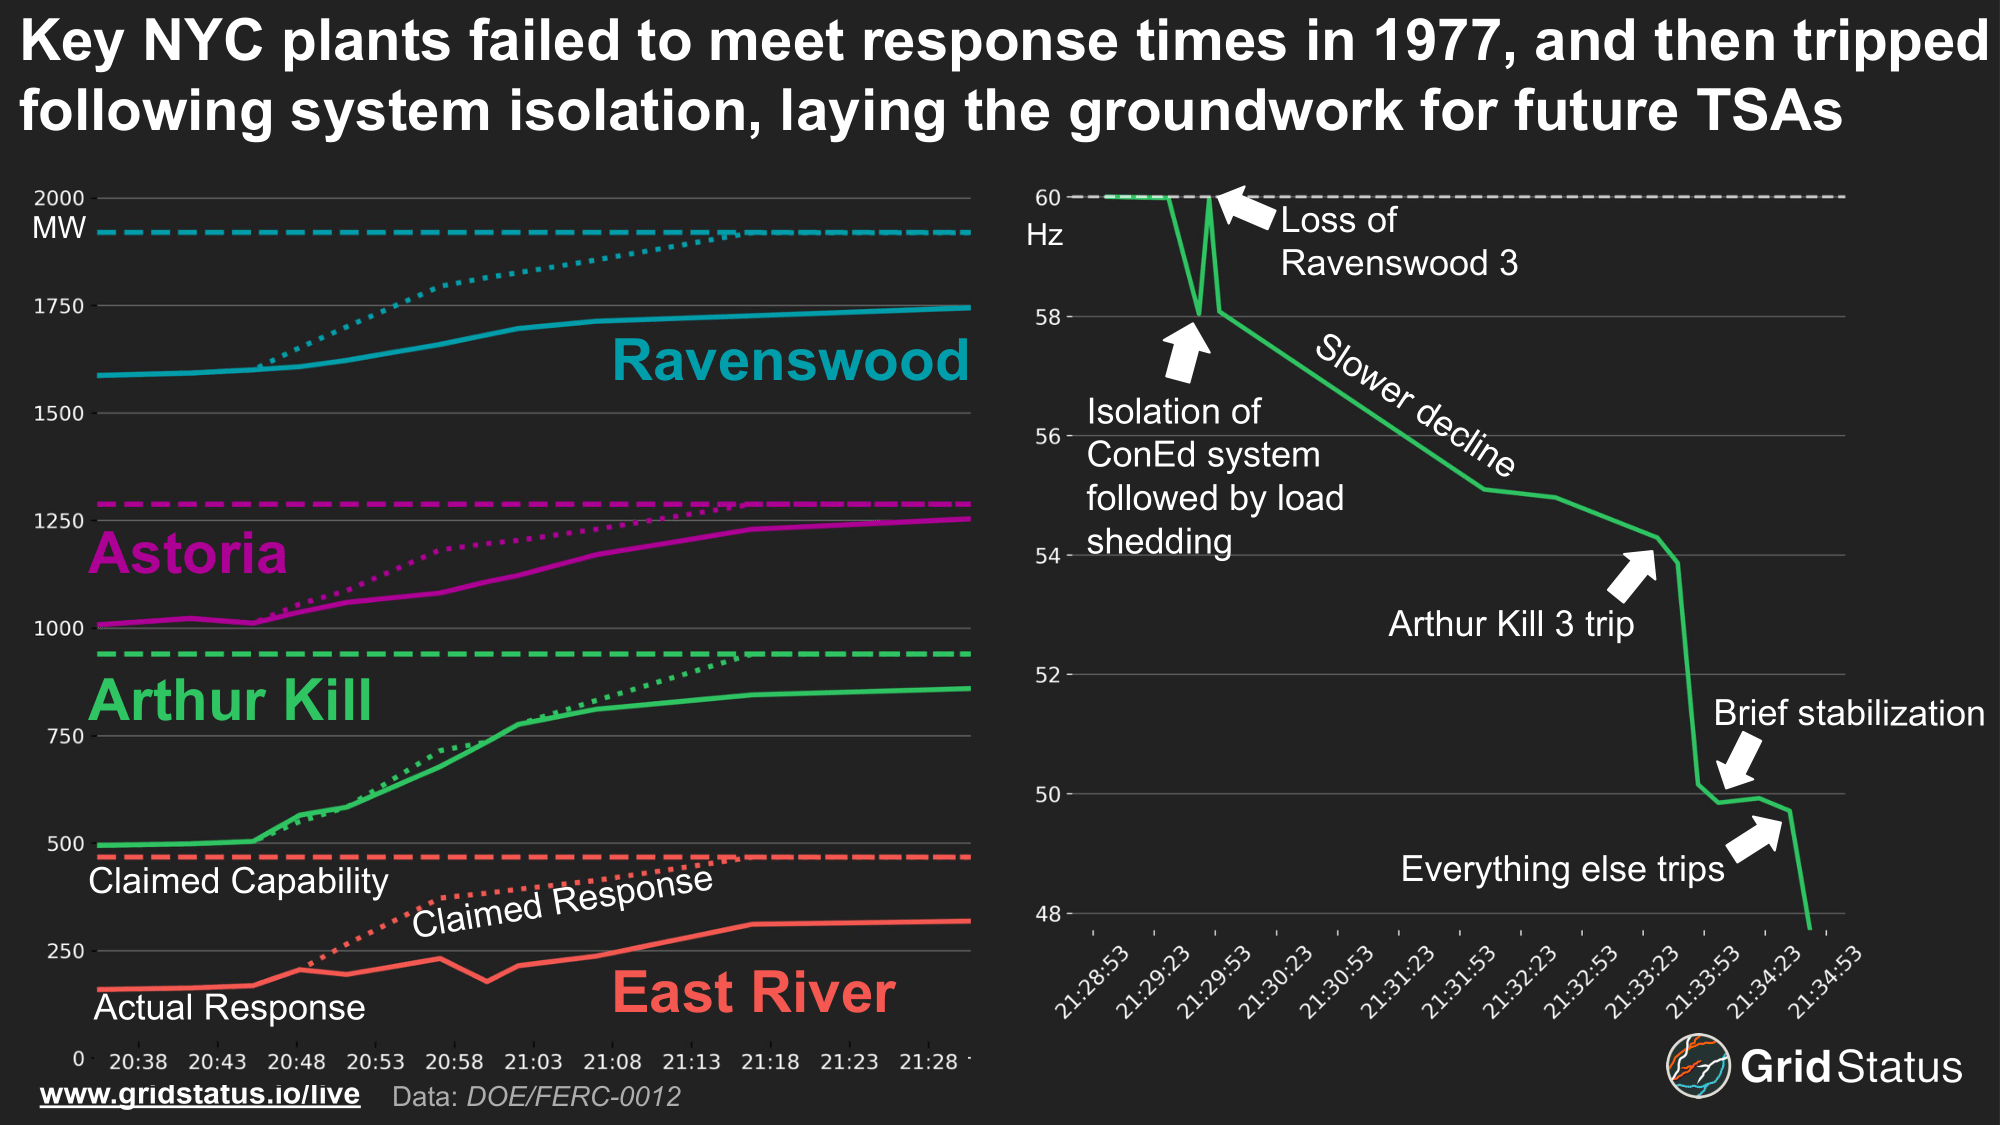
Even Arthur Kill, which ramped in line with its claimed response, failed to meet its claimed capability. The failure to provide needed generation, paired with egregious issues such as Astoria’s CT units being on outage without reporting their inability to respond, complicated operations at a precarious time.
The inadequate generation response and the already overwhelmed transmission system triggered the frequency swings that ultimately spiraled into citywide blackouts.
These blackouts came at a volatile time in New York City history, and the daylong blackout saw arson, multiple deaths, and hundreds of millions of dollars in damage. It’s with this deadly example that the TSA mechanism was established.
Once New Amsterdam
New York City and its surrounding suburbs make up the majority of NYISO’s demand. During a TSA event on July 1st, 2025, Zone J (New York City) and K (Long Island) alone made up close to half of the ISO’s load. Combining these two zones with I (Dunwoodie) and H (Millwood) brings the total downstate load, on the sink side of TSAs, to almost 60% of NYISO’s overall demand.
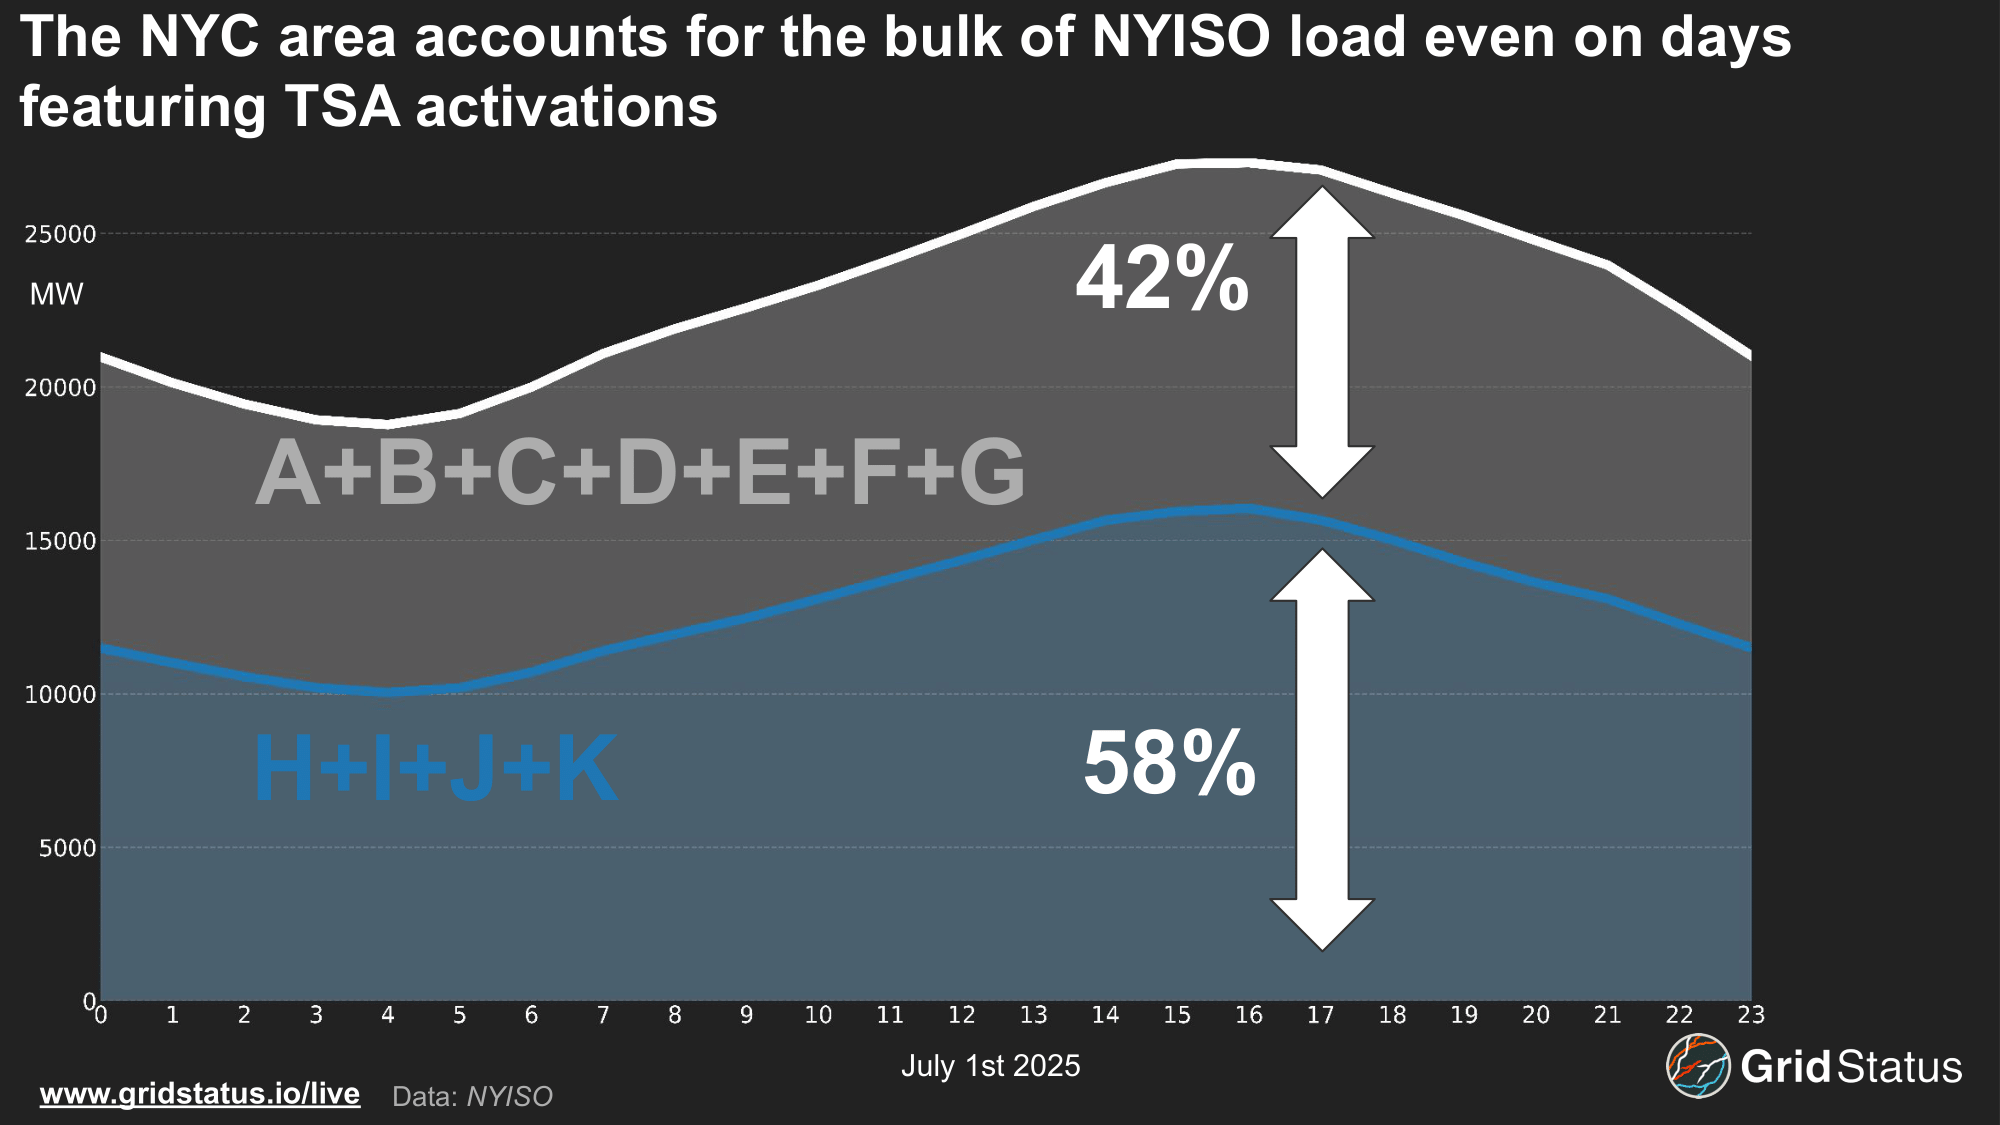
As we’ve documented in prior blogs, and which you can now track via weather radar on our price map, thunderstorms can reduce load as rain cools off buildings and cloud coverage filters the intense summer sun. While storms help to reduce demand on the margin, a few-degree demand difference is de minimis compared to the typical flows into the city area.
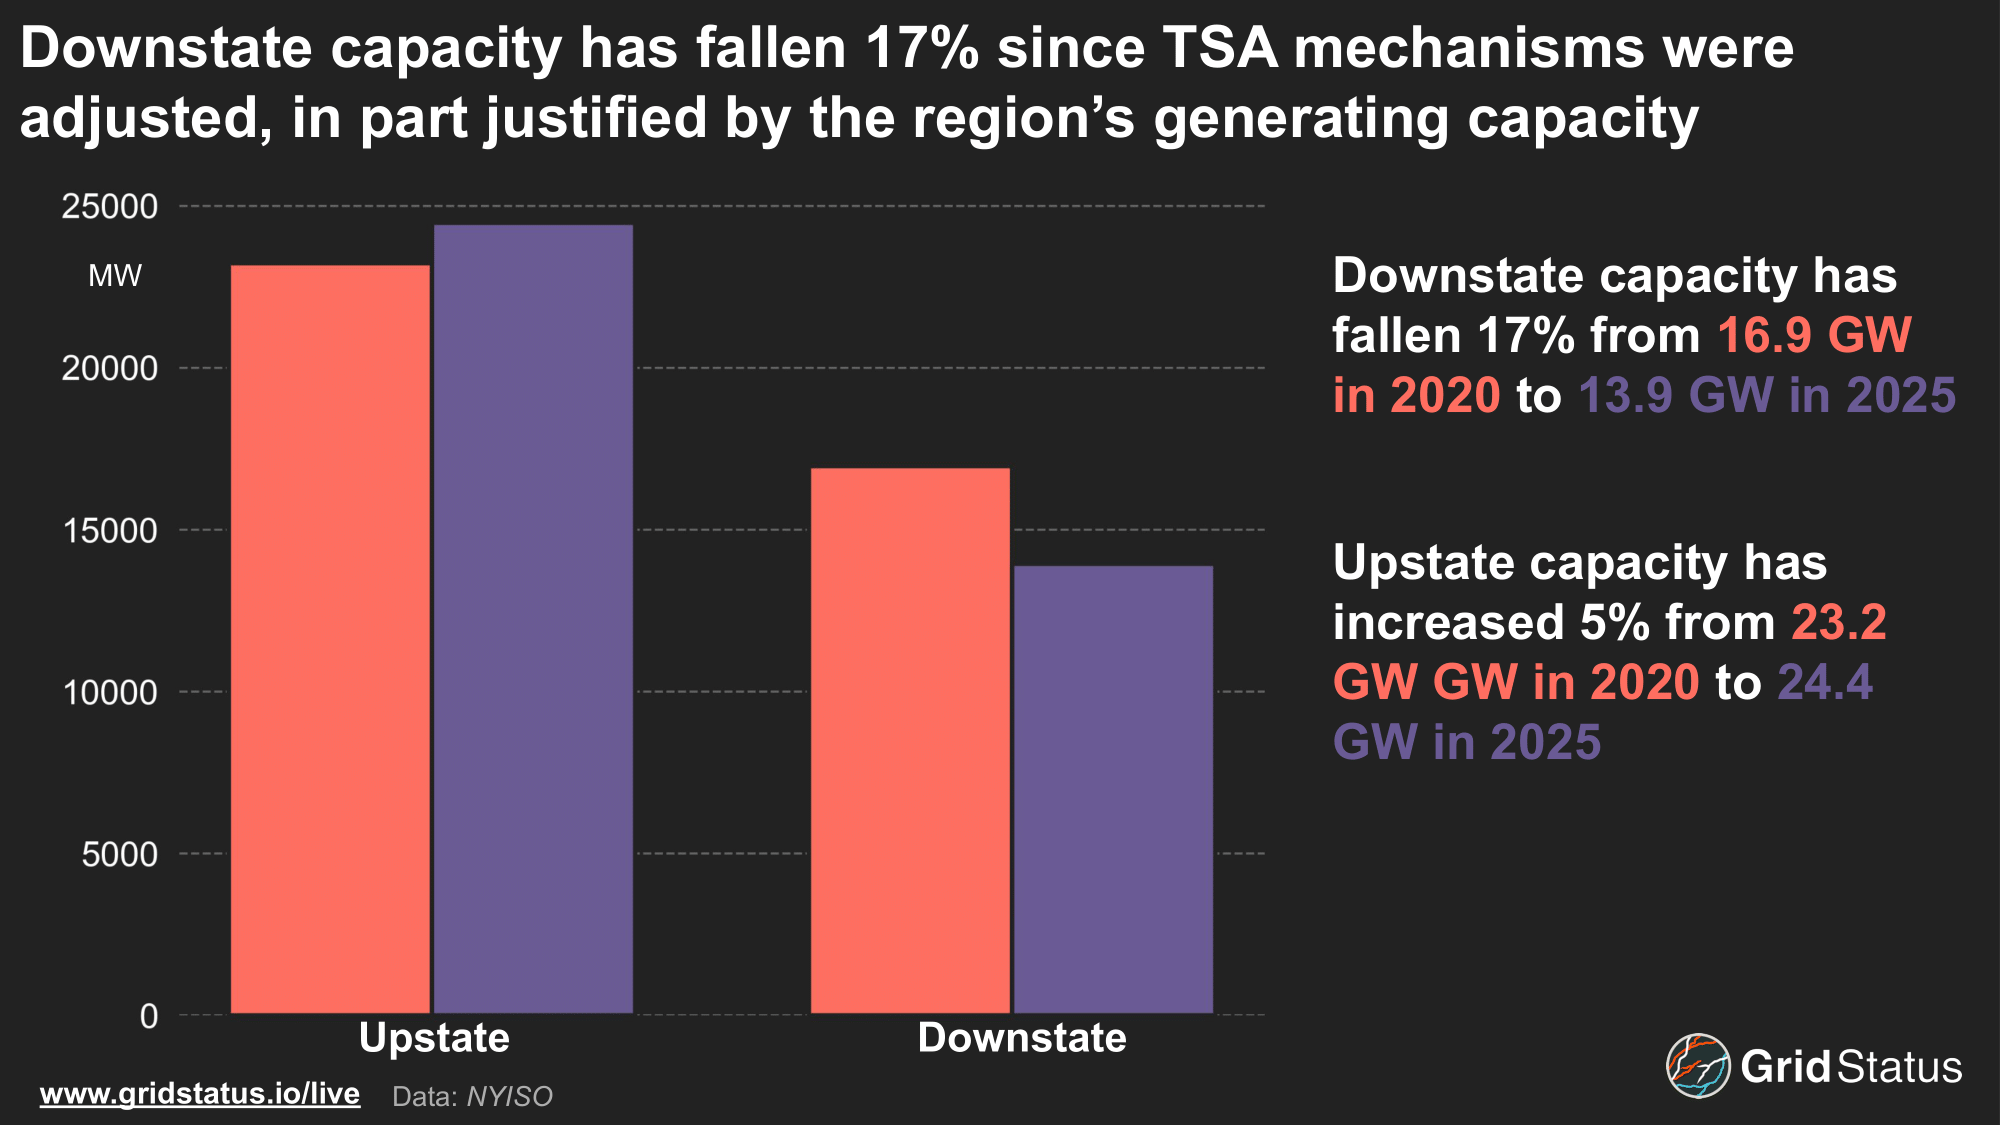
While the bulk of New York’s demand is downstate, most of the state’s generation capacity is located upstate.
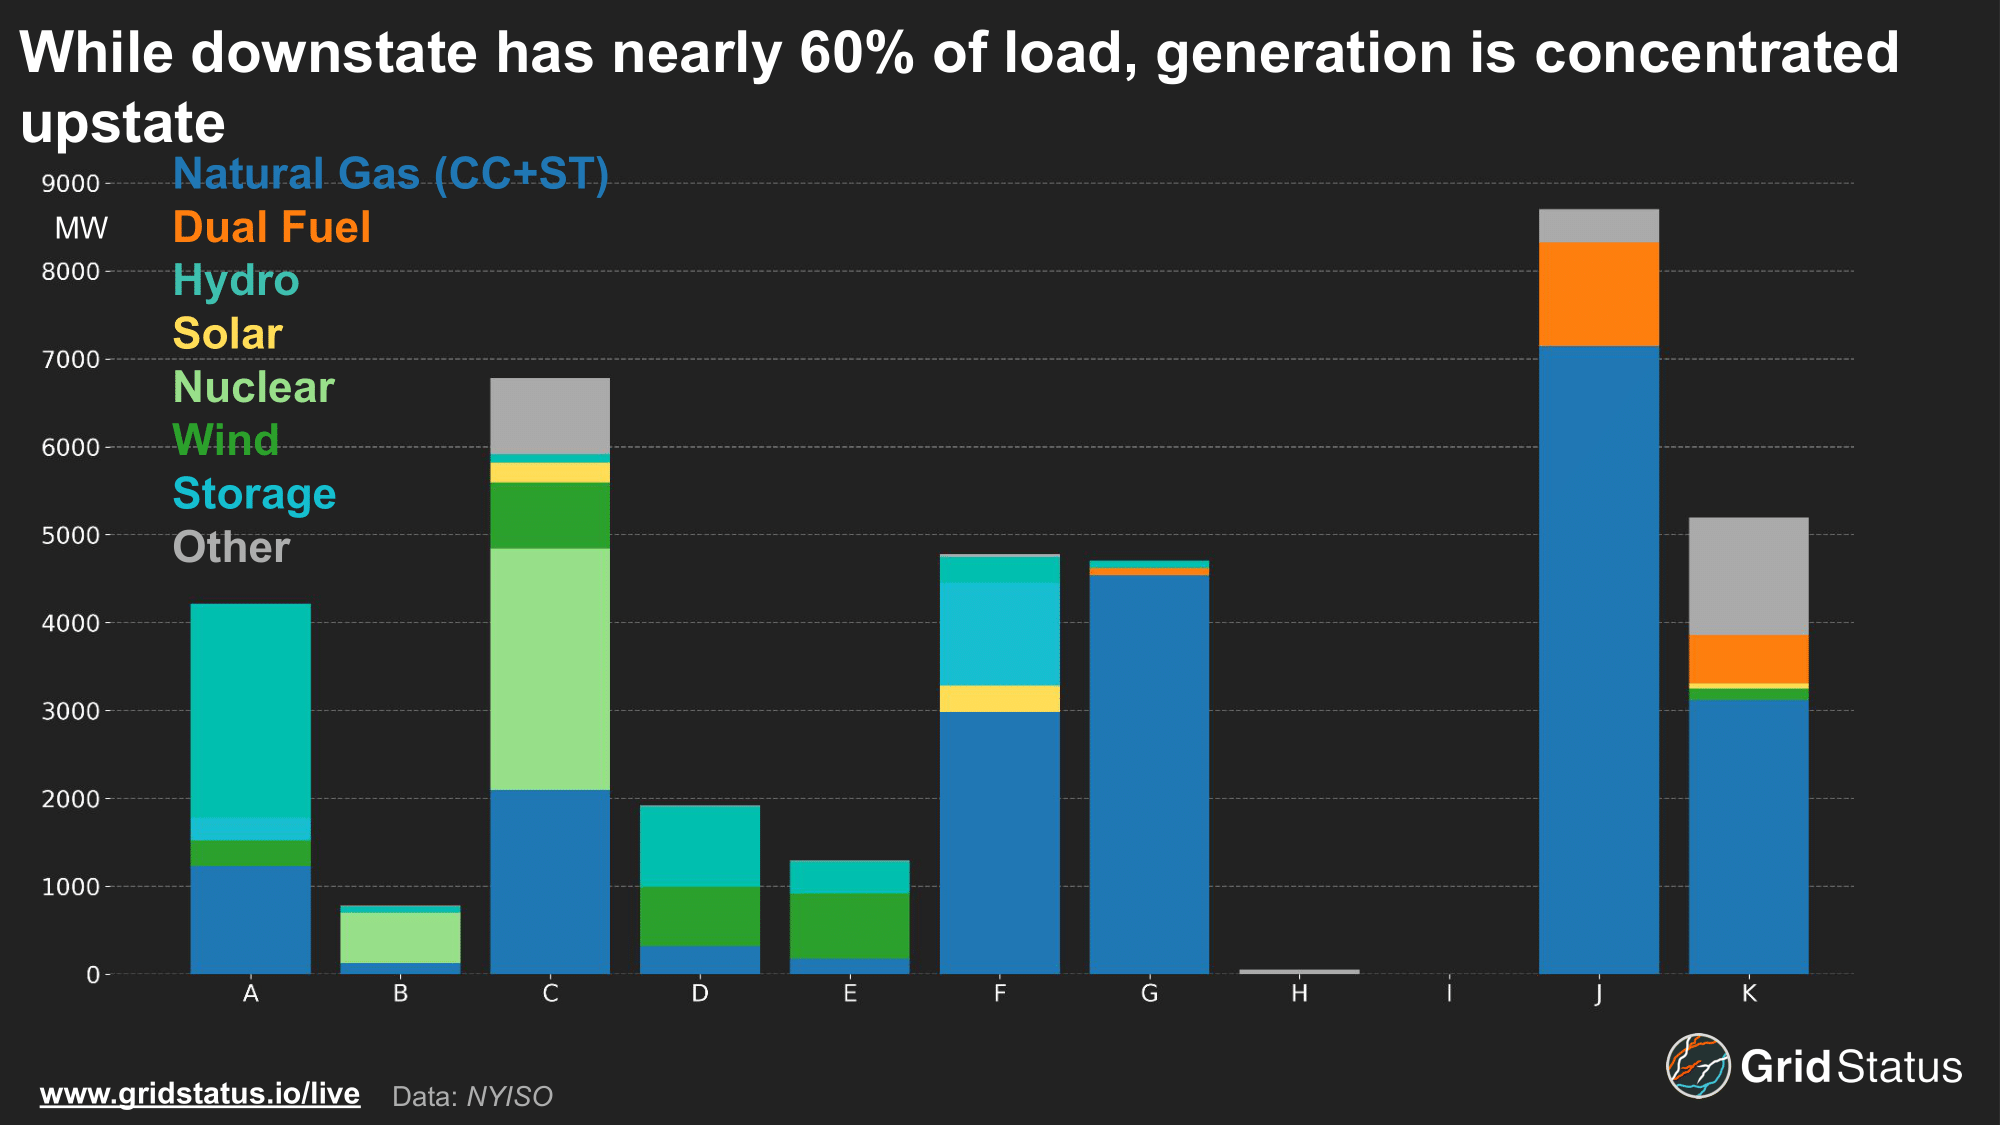
On paper, Zone J has the highest individual share of the state’s installed capacity, but nearly half consists of lower capacity factor steam turbine units, while another 18% are expensive quickstart peakers. Beyond the technologies, these plants are old; ~8 GW of generation in Zones J and K are at least 50 years old. While these generators help to bolster total capacity numbers in the densest city in the US, they rarely run outside of the highest demand days of the year, unless committed for local reliability. Most of the state's higher capacity factor units, such as nuclear plants, combined cycles, and large hydro plants, are located far away from the city and rely on the state’s 345 kV transmission backbone.
When Lightning Strikes, Maybe Once, Maybe Twice
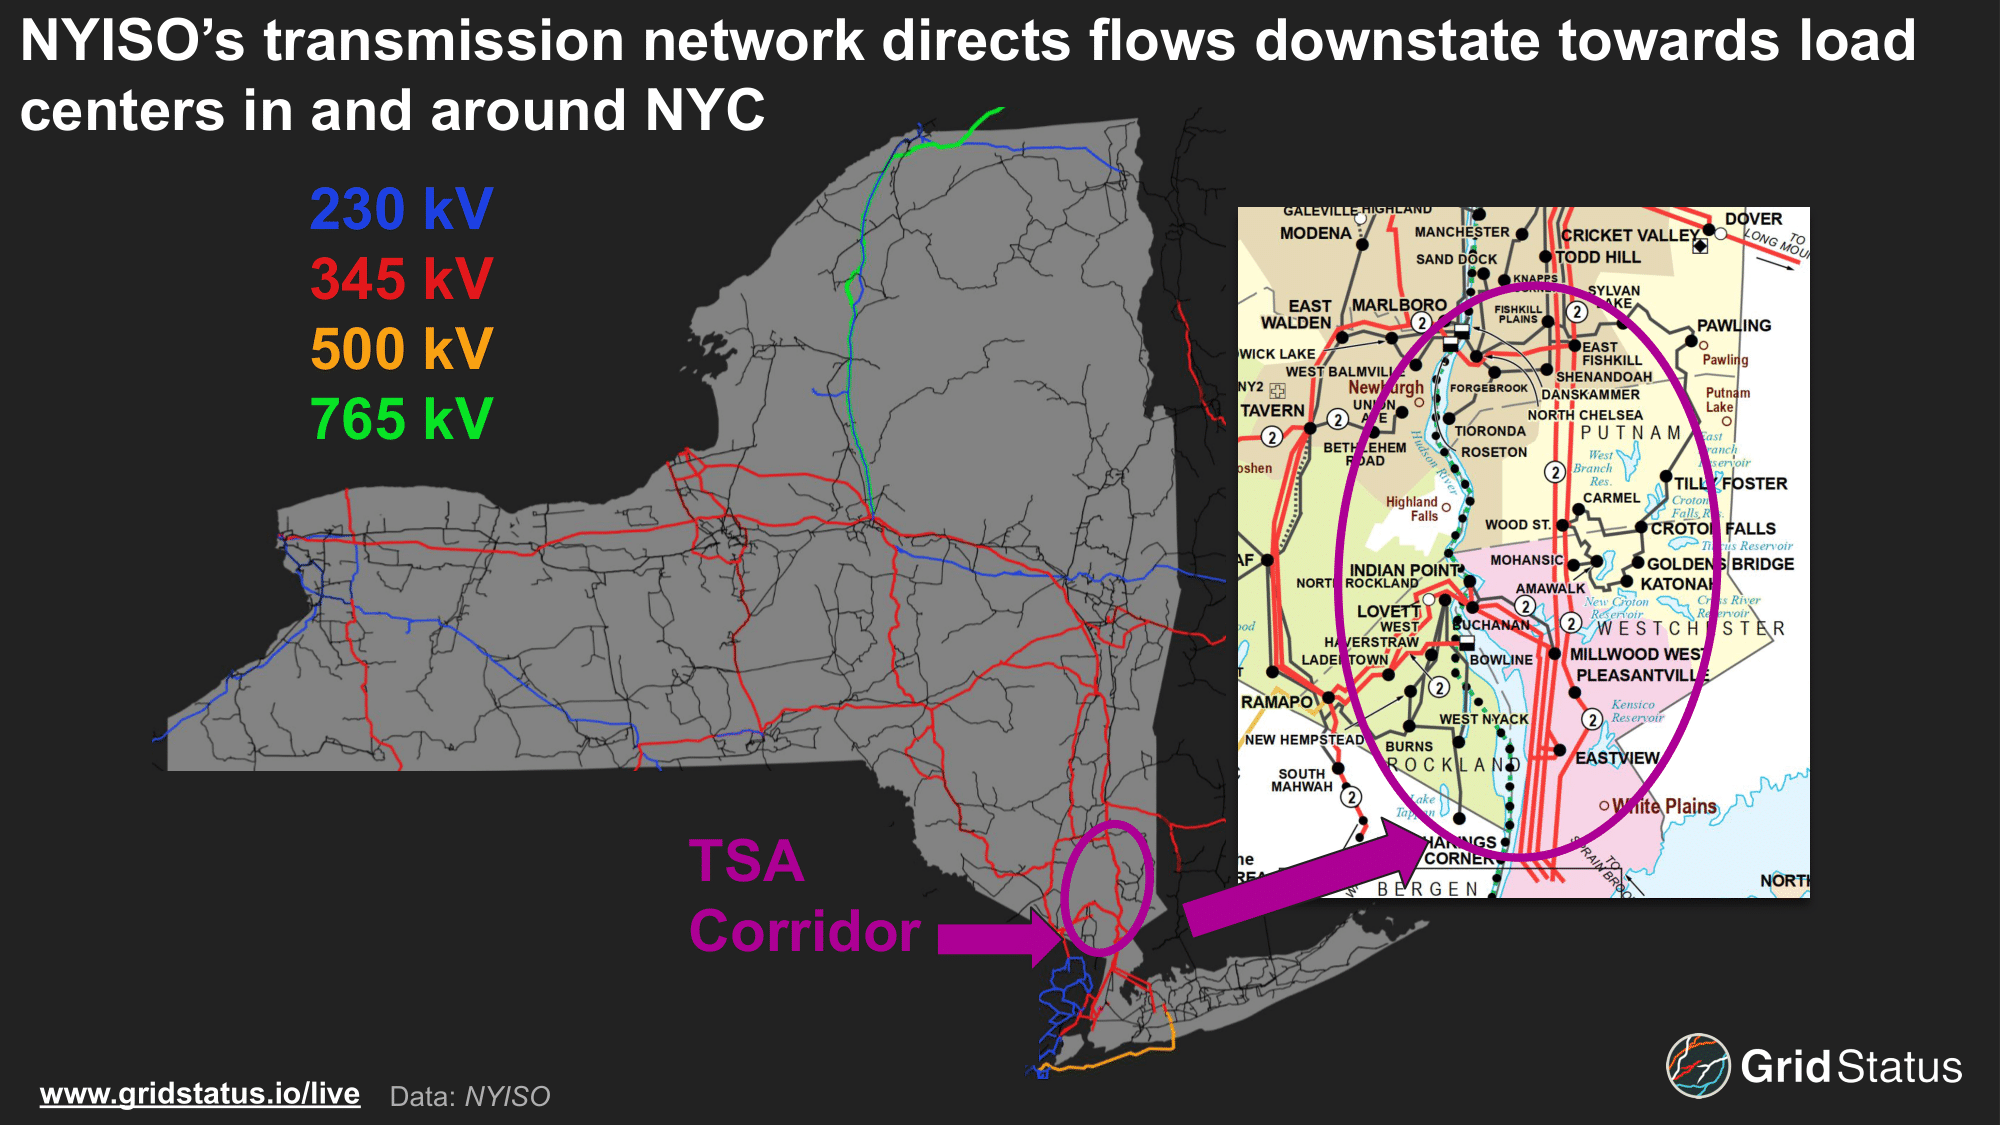
These 345kV transmission lines converge in the Hudson River Valley, stretching parallel to the river as they serve the NYC metropolitan area.
The heavy reliance on transmission through the Hudson bottleneck to serve downstate demand and the vulnerabilities exposed by the 1977 blackout led to the creation of TSAs. While not what many think of when they hear the acronym, these system alerts are activated by NYISO during a flurry of lightning strikes to ensure reliability, primarily in the summertime when thunderstorms are more common. Once the threshold is met, a TSA is issued. Under these conditions, the flow path leading into New York City is operated as if the first contingency conditions have already been met, even if they have not technically been met.
Post-contingency operations on the grid imply a conservative operating posture, a way to mitigate cascading vulnerability, something an uncontrolled electrical grid is prone to. In this case, the ability to flow power through the Hudson Valley corridor into ConEd’s territory is lowered via limits on the lines. This, in turn, necessitates an increase in generation within the load pockets of Zones J and K.
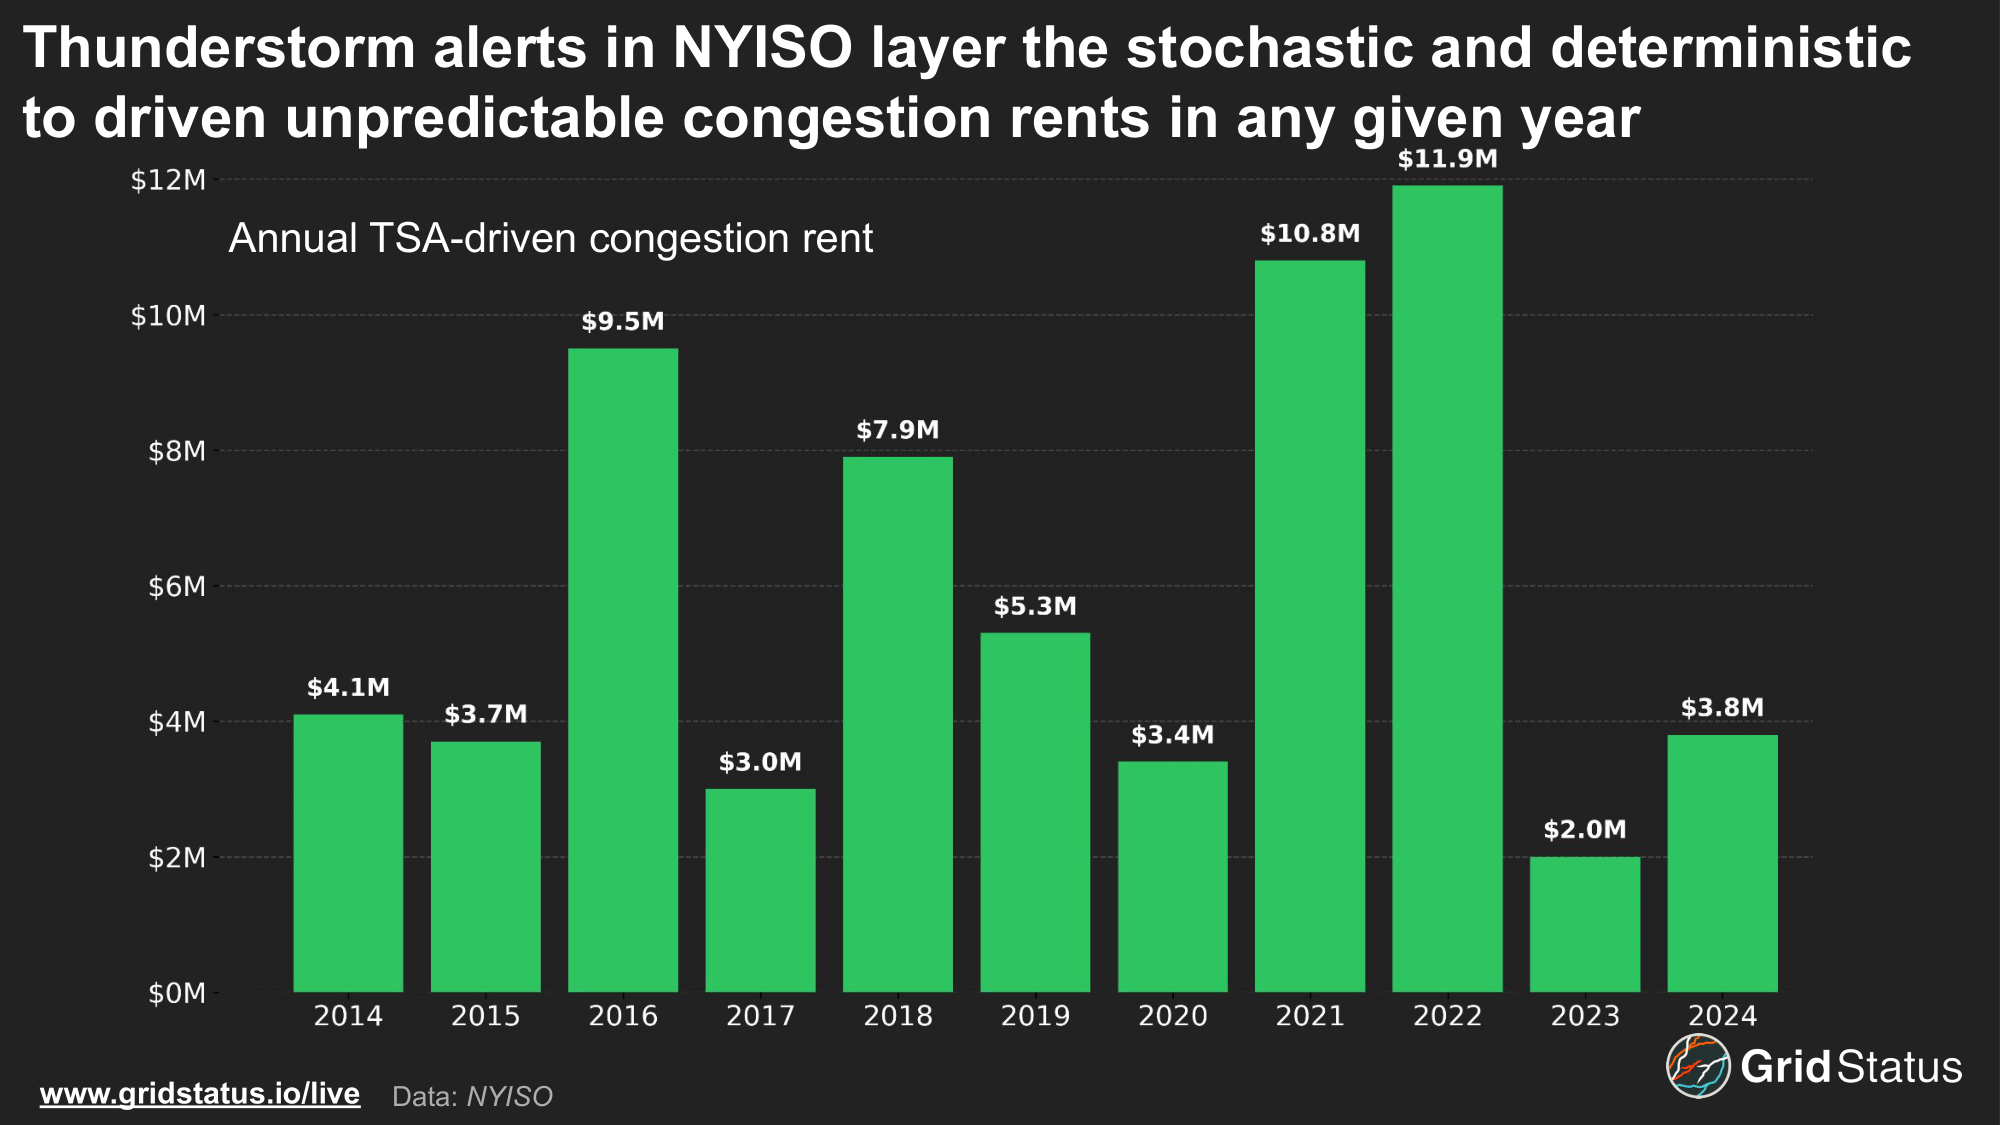
This domino effect is typical of contingency management, but the combination of unpredictable setup conditions and large impact causes TSAs to stand out.
Unsurprisingly, these events are most common during the summer months. Warm, humid air helps feed an increasingly unstable atmosphere, setting the stage for storms. July has been the top month for activations since 2015, with nearly as many TSAs called as August and June combined.
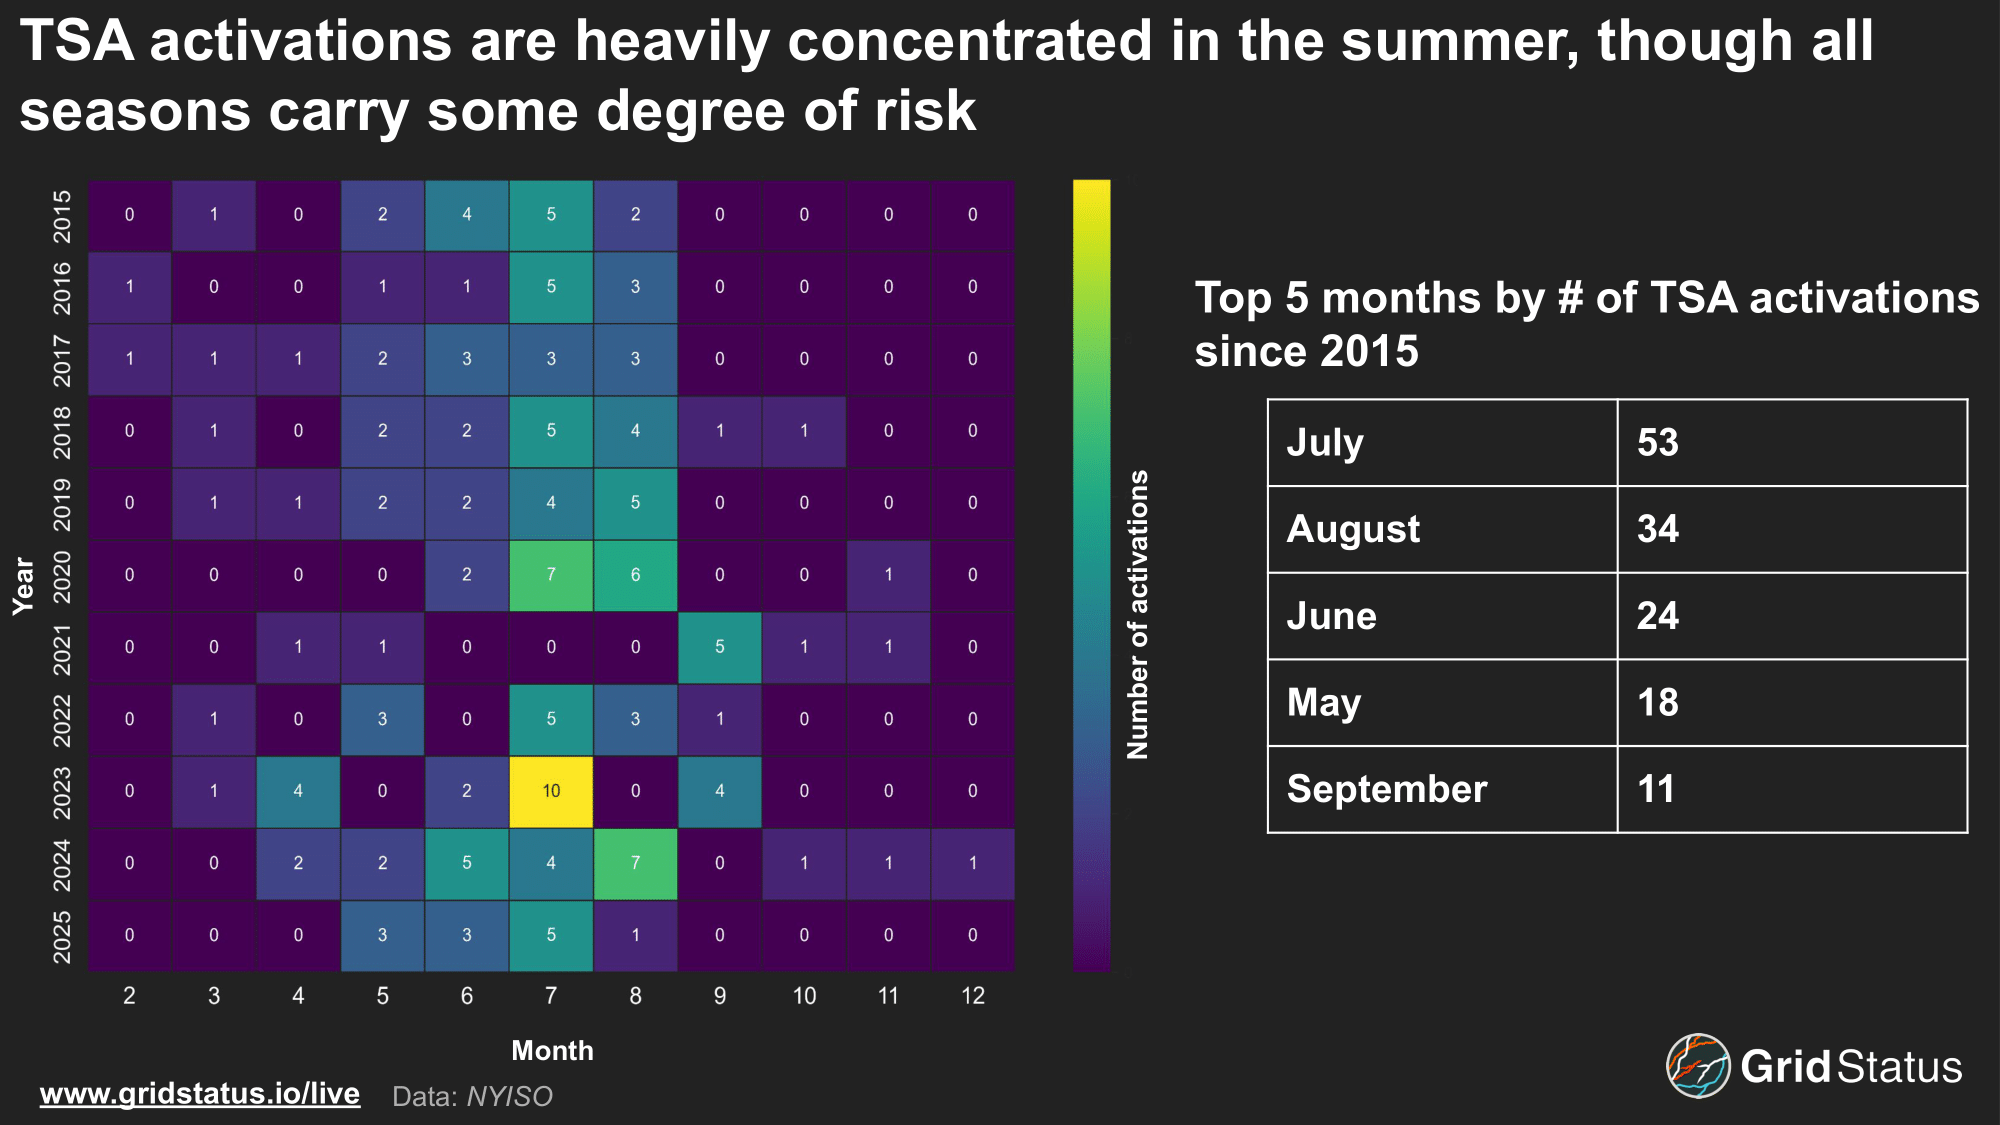
Unlike other market mechanisms that are only able to be activated during a set time window, NYISO can issue a TSA at any time of year. >
Even though summer is more amenable to thunderstorm setups, these events are a year-round risk, with TSAs even being called in the winter.
The basic mechanisms employed in a TSA make sense when applied in the context of the 1977 blackout. During this event, transmission lines were knocked out in succession, and generation was unable to ramp up to meet local demand. TSAs artificially restrict flows into the city, effectively simulating a forced transmission outage, encouraging generators to ramp up in the event of a transmission loss and before emergency conditions potentially arise. This was evident during the July 1st TSA, when 9 of the 11 units that received out-of-merit order instructions for congestion mitigation were located in Zone J&K. For asset owners downstate, this has large pricing implications.
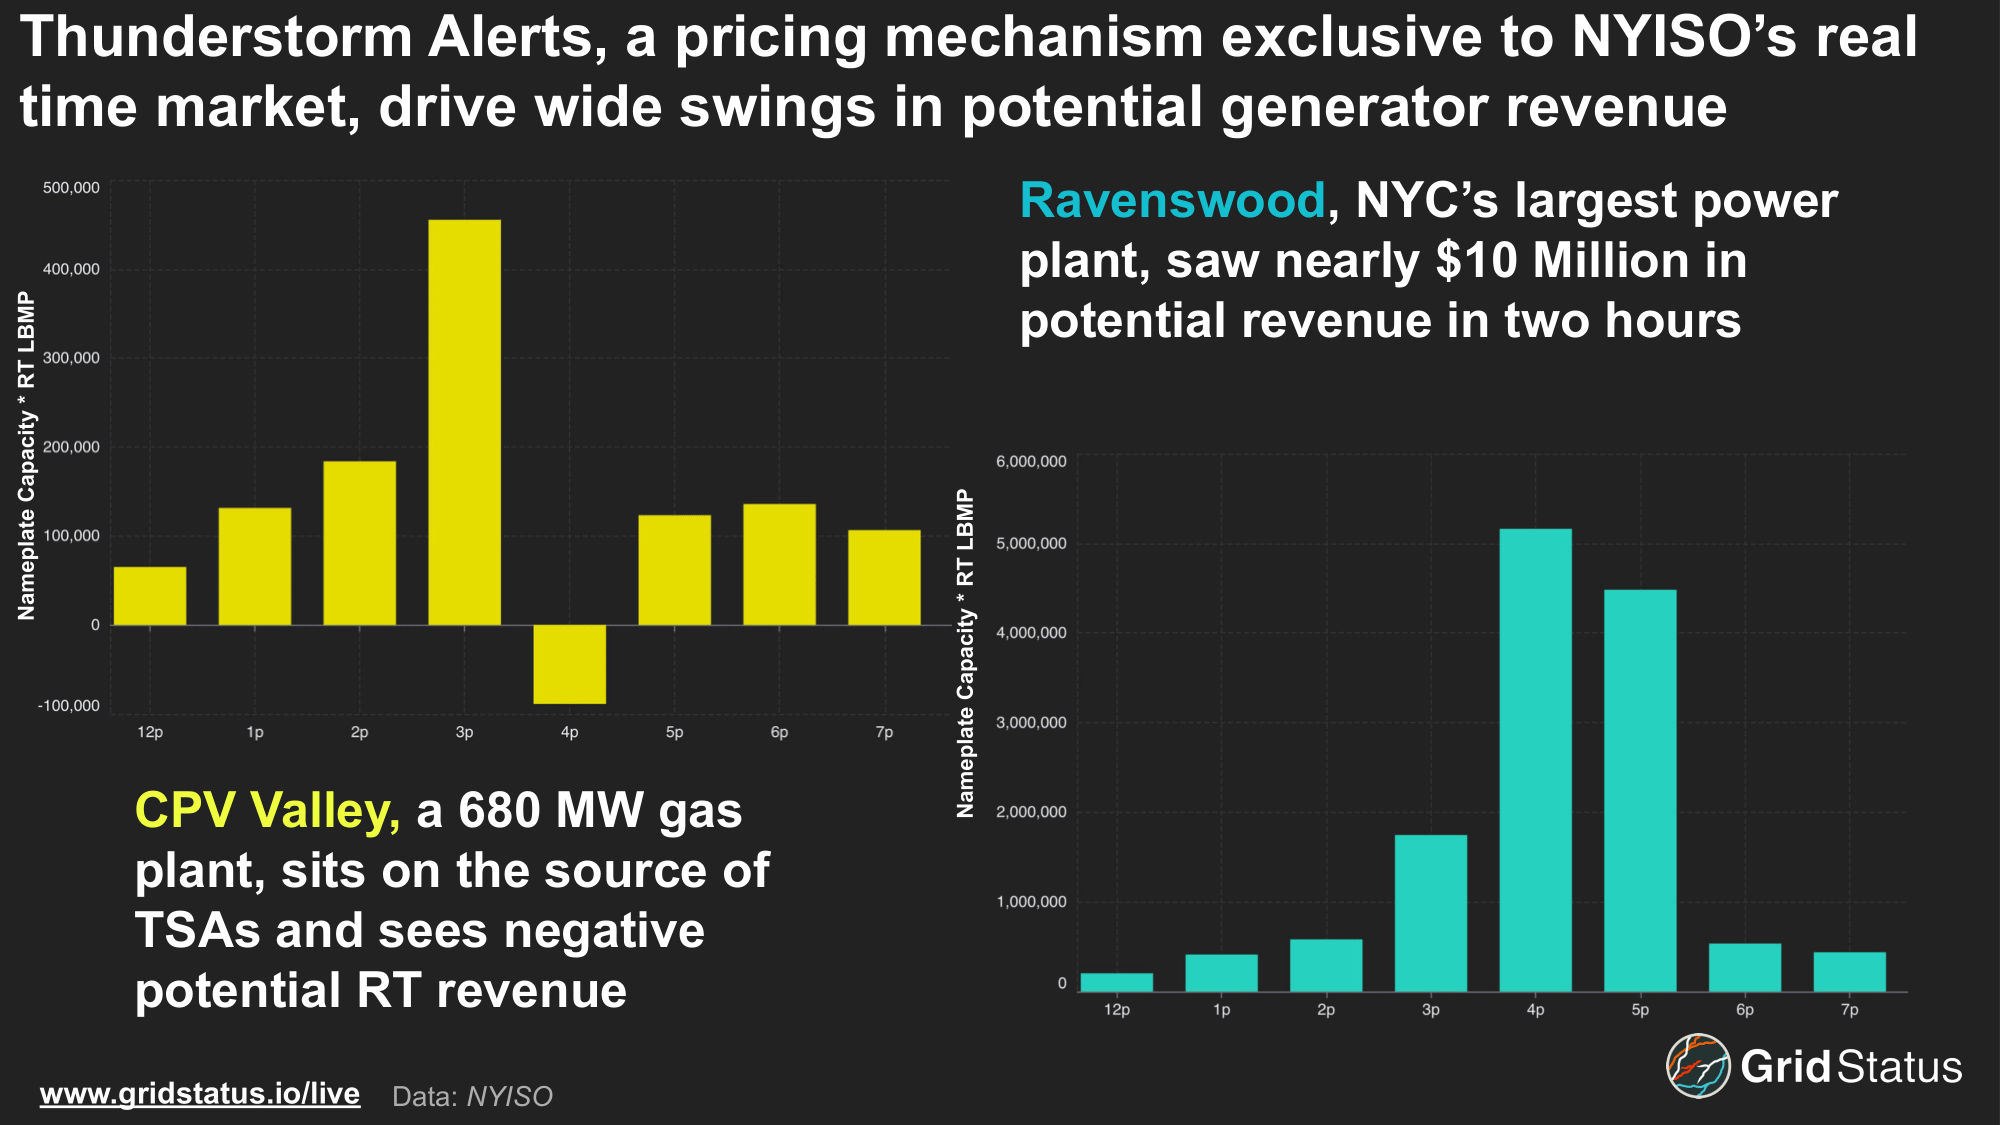
During the TSA activation on July 1st, 2025, Ravenswood, the largest power plant in Zone J, saw real-time congestion prices spike, with one five-minute interval exceeding $5,000/MWh and an hourly congestion DA/RT spread of approximately -$2,800/MWh.
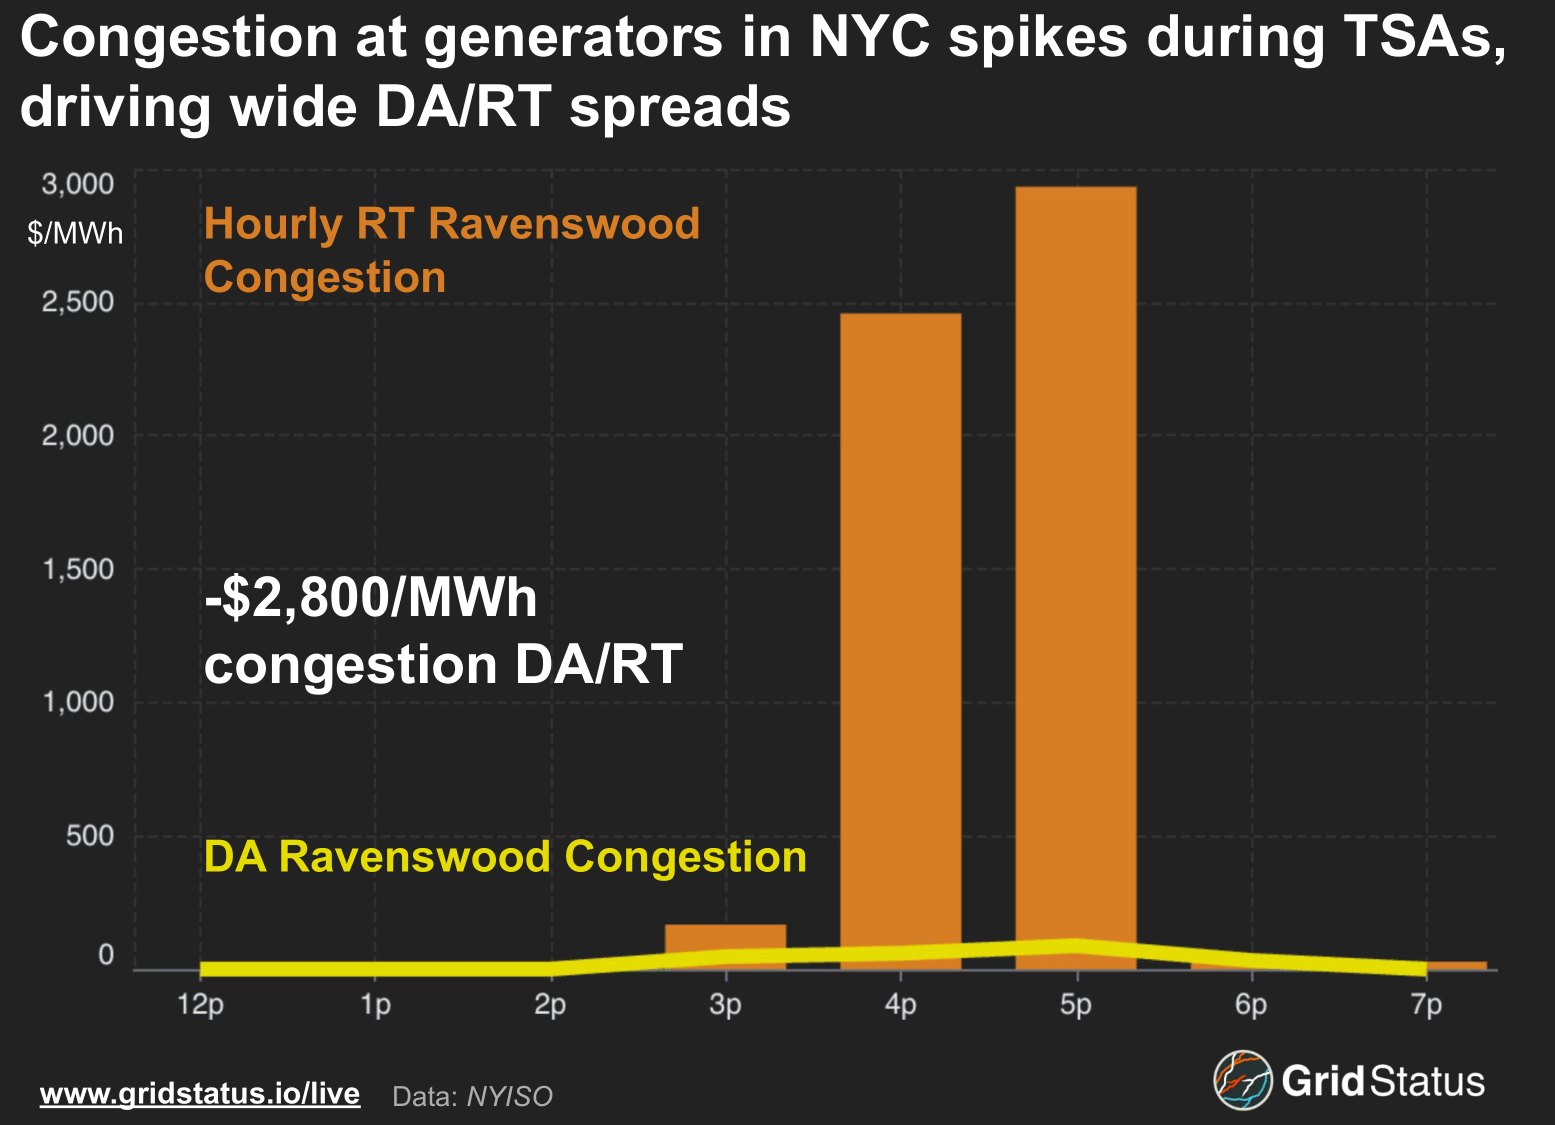
One of the reasons for these extremely wide positive DA/RTs is that by their very nature, the pricing impact of a given TSA is only captured in real time. Market participants may attempt to tailor their day-ahead schedules around TSA risks, but large upside potential is confined to the real-time market.
In NYISO, exposure to nodal prices is generally limited to generators, and the ISO does not price at all buses across the grid. Other market participants, such as virtual traders, are exposed to zonal prices (the structure of NYISO’s virtual market was also used as part of the basis for the recently established IESO market). Even with these restrictions, trading around TSAs proves to be lucrative when successful.
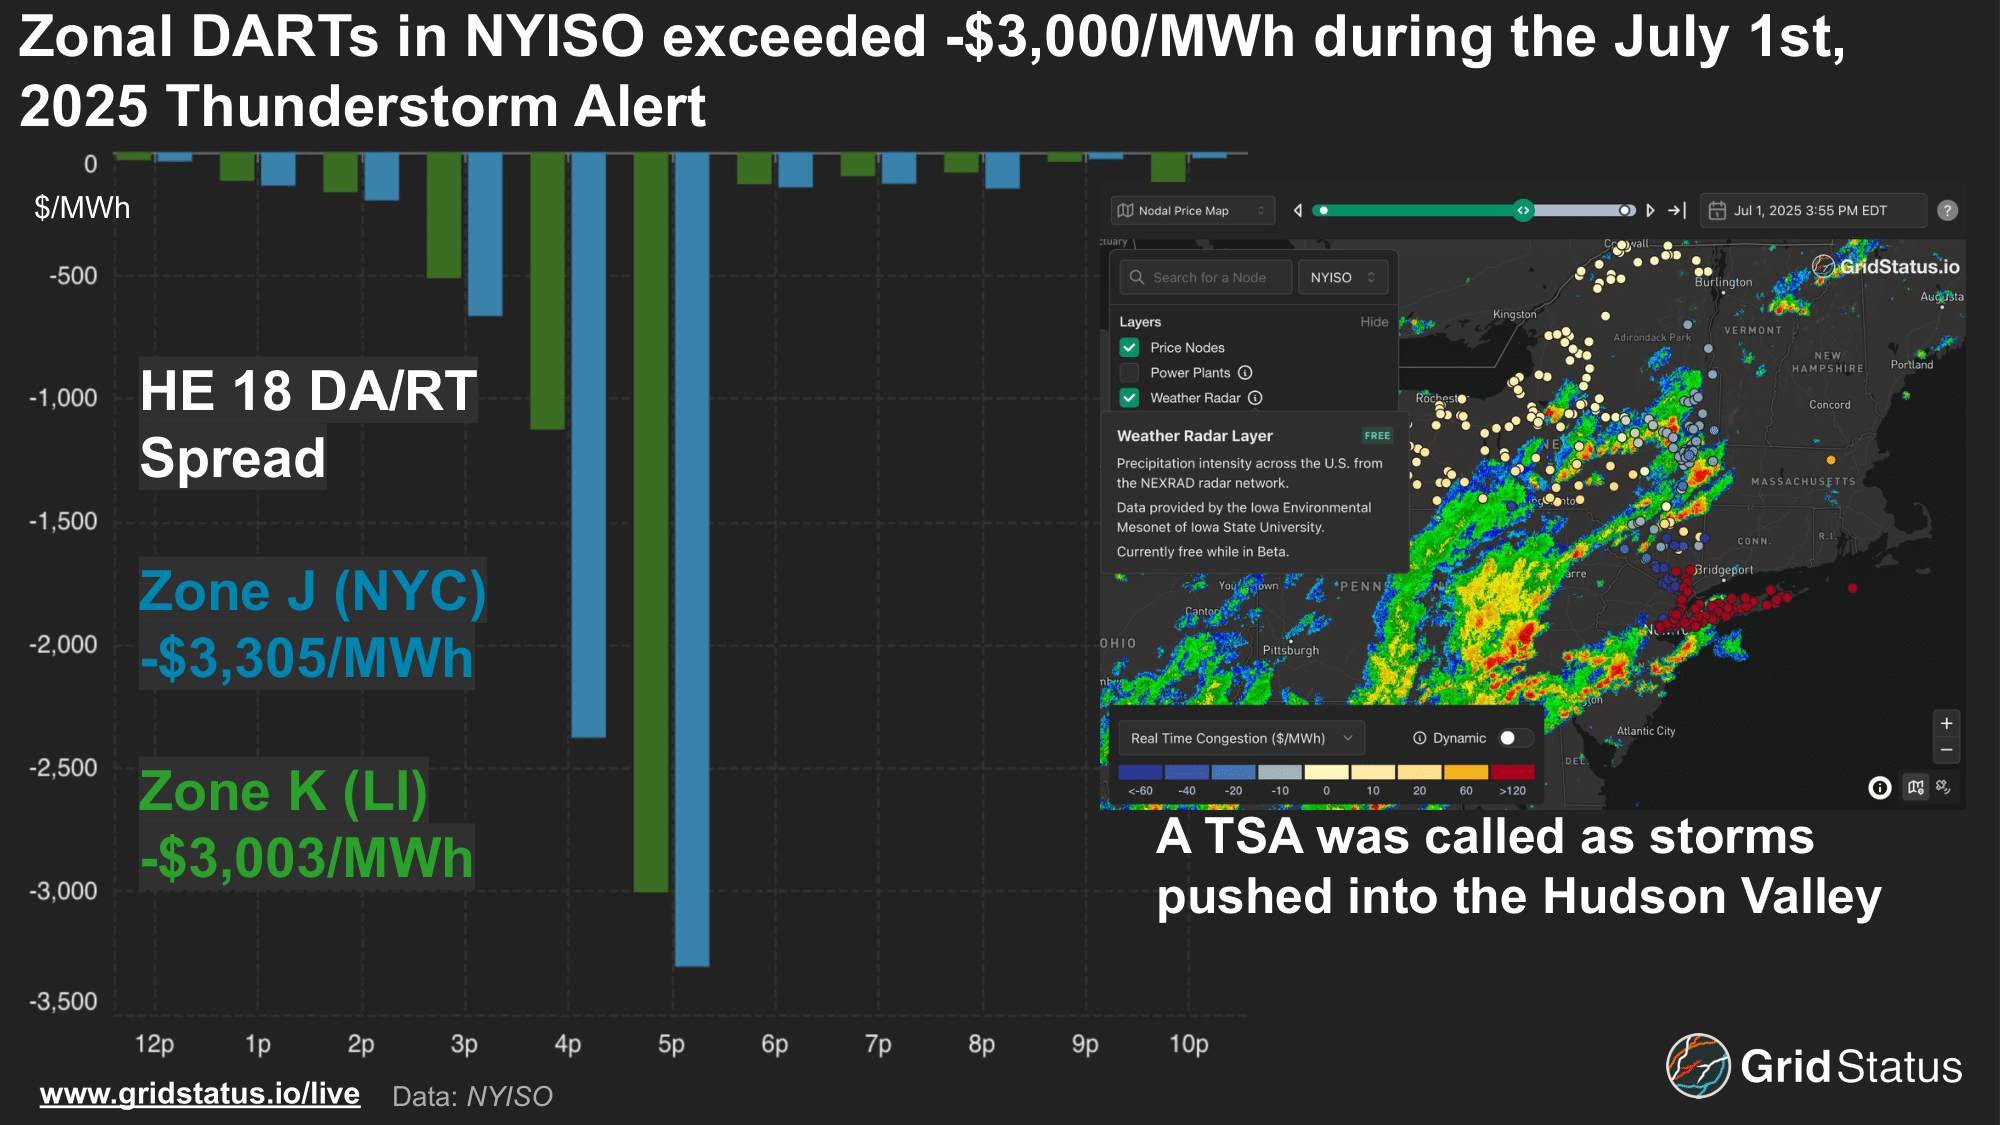
Both Zone J and K, representing NYC and Long Island, saw negative DARTs exceeding -$3,000/MWh over the evening peak, with the prior hour also exceeding -$1,000/MWh and 5-minute prints reaching as high as $8,000/MWh.
Yes, I’m Changing
In the decades following the 1977 blackout, the basic mechanisms of the TSA remained the same, even as the grid evolved. This changed in 2020 when the number of strikes needed to issue a TSA was doubled. In a presentation to the New York State Reliability Council, ConEd explained its reasoning behind increasing the threshold. In sum, ConEd argued that the prior structure, 15 expected strikes in 30 minutes, was too costly and too conservative, particularly as generation has been built out and transmission technology has improved. As part of their analysis, ConEd found no examples of outages triggered by lightning that would have been missed under the new threshold.
Had the new rules been in place from 2010-2020, there would have been 55 fewer TSA activations, and ConEd argued that the new threshold still errs conservatively.
In the meantime, downstate New York has seen major changes to its generation fleet. The last unit of Indian Point, downstate’s sole nuclear power plant, retired in April 2021. While Indian Point was a notable deactivation, the loss of this unit is a part of a wider trend downstate.
Since 2020, the zones that have seen the highest decrease in capacity have been Zone H, which saw capacity fall a staggering 97% (as Indian Point made up the bulk of capacity, and Zone J, which fell nearly 10%.
Zone K capacity has been relatively flat, with the addition of South Fork Wind Farm in 2024 helping to offset smaller retirements.
While offshore wind helped to keep capacity relatively flat thus far, that same industry faces challenges in bringing expected net-positive capacity online going forward.
In April 2025, Equinor, the developer behind the 800 MW Empire Wind project, was issued a stop-work order by the DOI. While the order was eventually lifted, as part of an apparent quid pro quo for New York to reconsider gas pipelines, offshore wind faces major headwinds, so much so that the New York Public Service Commission terminated infrastructure upgrades needed to support offshore wind, citing federal actions. Beyond the state’s offshore wind buildout, new DC ties may help reduce downstate’s growing capacity deficiency.
Once complete, the Champlain Hudson Power Express (CHPE) project is expected to relieve some of downstate’s capacity concerns as the DC tie line between New York, specifically New York City, and Québec. Tying into Québec has often been a fallback for Northeast states touting what has often been a reliable, or as CHPE puts it, “always-on” source of green power. Recent years have upended this mantra as wildfires, drought, and even tariffs have put this assumption to the test.
You’ve Been Thunderstruck
Apart from the direct impact on load, weather plays a central role in today’s grid. The increasing share of weather-dependent renewables, extreme events like this summer’s record-breaking East coast heatwave, and increasing ties with water-cycle-reliant-Québec, are all challenges for New York. Weather is reshaping the grid, and sometimes pushing it to its limits.
While we recently added a radar layer to our live map (solidly in beta while we determine a final source), we’re still aiming to expand to new ways to view and interact with weather data. The next time thunder is in the forecast, track storm progression on our live NYISO page, and let us know what types of weather data you want to see on Grid Status.