High and Dry: Canadian Wildfire Smoke Complicates Northeastern Grid Operations
Wildfire impacts are now a regular, if unwelcome guest during Northeastern summers, with smoke affecting both solar output and load patterns in New York and New England.


Canadian wildfire smoke has become a telltale sign of summer in the Northeast, introducing a Breaking Bad-esque hue to the air and new challenges for grid operators managing the growing role of BTM solar in New York and New England.
Beyond its toll on air quality, wildfire smoke is adding new layers of complexity to grid operations just as U.S. and Canadian markets deepen their integration. We’re breaking down the impact of recent wildfire activity on markets in the Northeast and how generation changes in the Midwest are increasing the region’s exposure to smoke-driven challenges.
When the Sun Hits
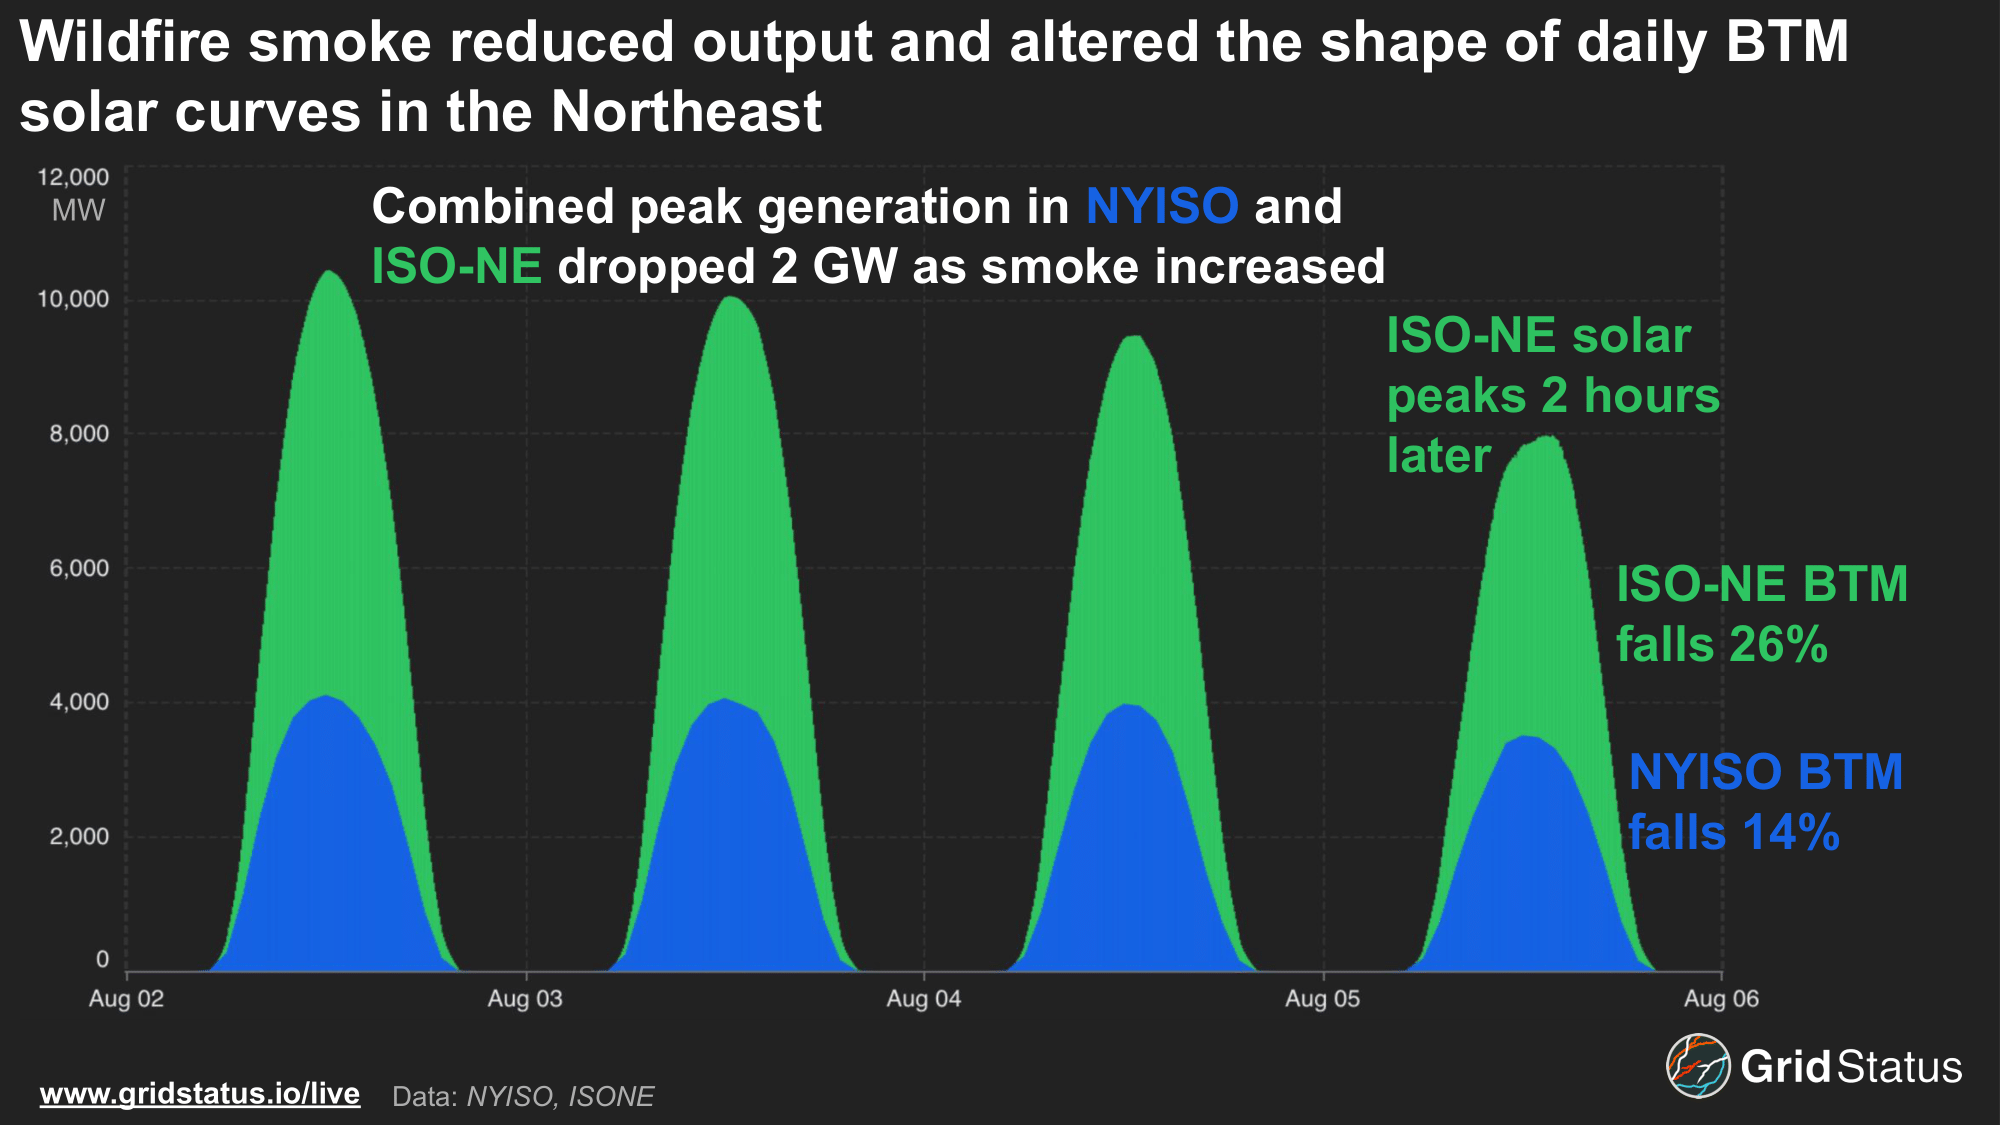
While not traditionally considered a solar resource powerhouse, the Northeast, particularly Massachusetts and New York, is home to some of the highest concentrations of BTM solar in the country, with installed capacity rivaling utility-scale installations in larger, sunnier states. This level of BTM capacity has taken the edge off of peak summer demand in the region, but also exposes the Northeast to new risks from wildfire smoke via reduced generation.
In the days preceding the arrival of smoke in early August, ISO-NE BTM generation was estimated to have exceeded 6 GW during the afternoon. As Canadian haze rolled south, generation dipped below 5 GW on Tuesday, August 5th, and the daily BTM peak shifted nearly 2 hours later than the prior day.
August 5th’s load curve was significantly altered by wildfire smoke. After sunrise, BTM generation began to push demand lower, but by 10 AM, wildfire smoke suppressed solar, causing load to flatten out. This was the opposite of what had occurred just one day earlier, when clearer skies allowed for a more traditional BTM-driven load curve. August 5th illustrates the dual impacts of wildfire smoke in Northeast markets, driving up daytime demand and then helping reduce it by the evening.
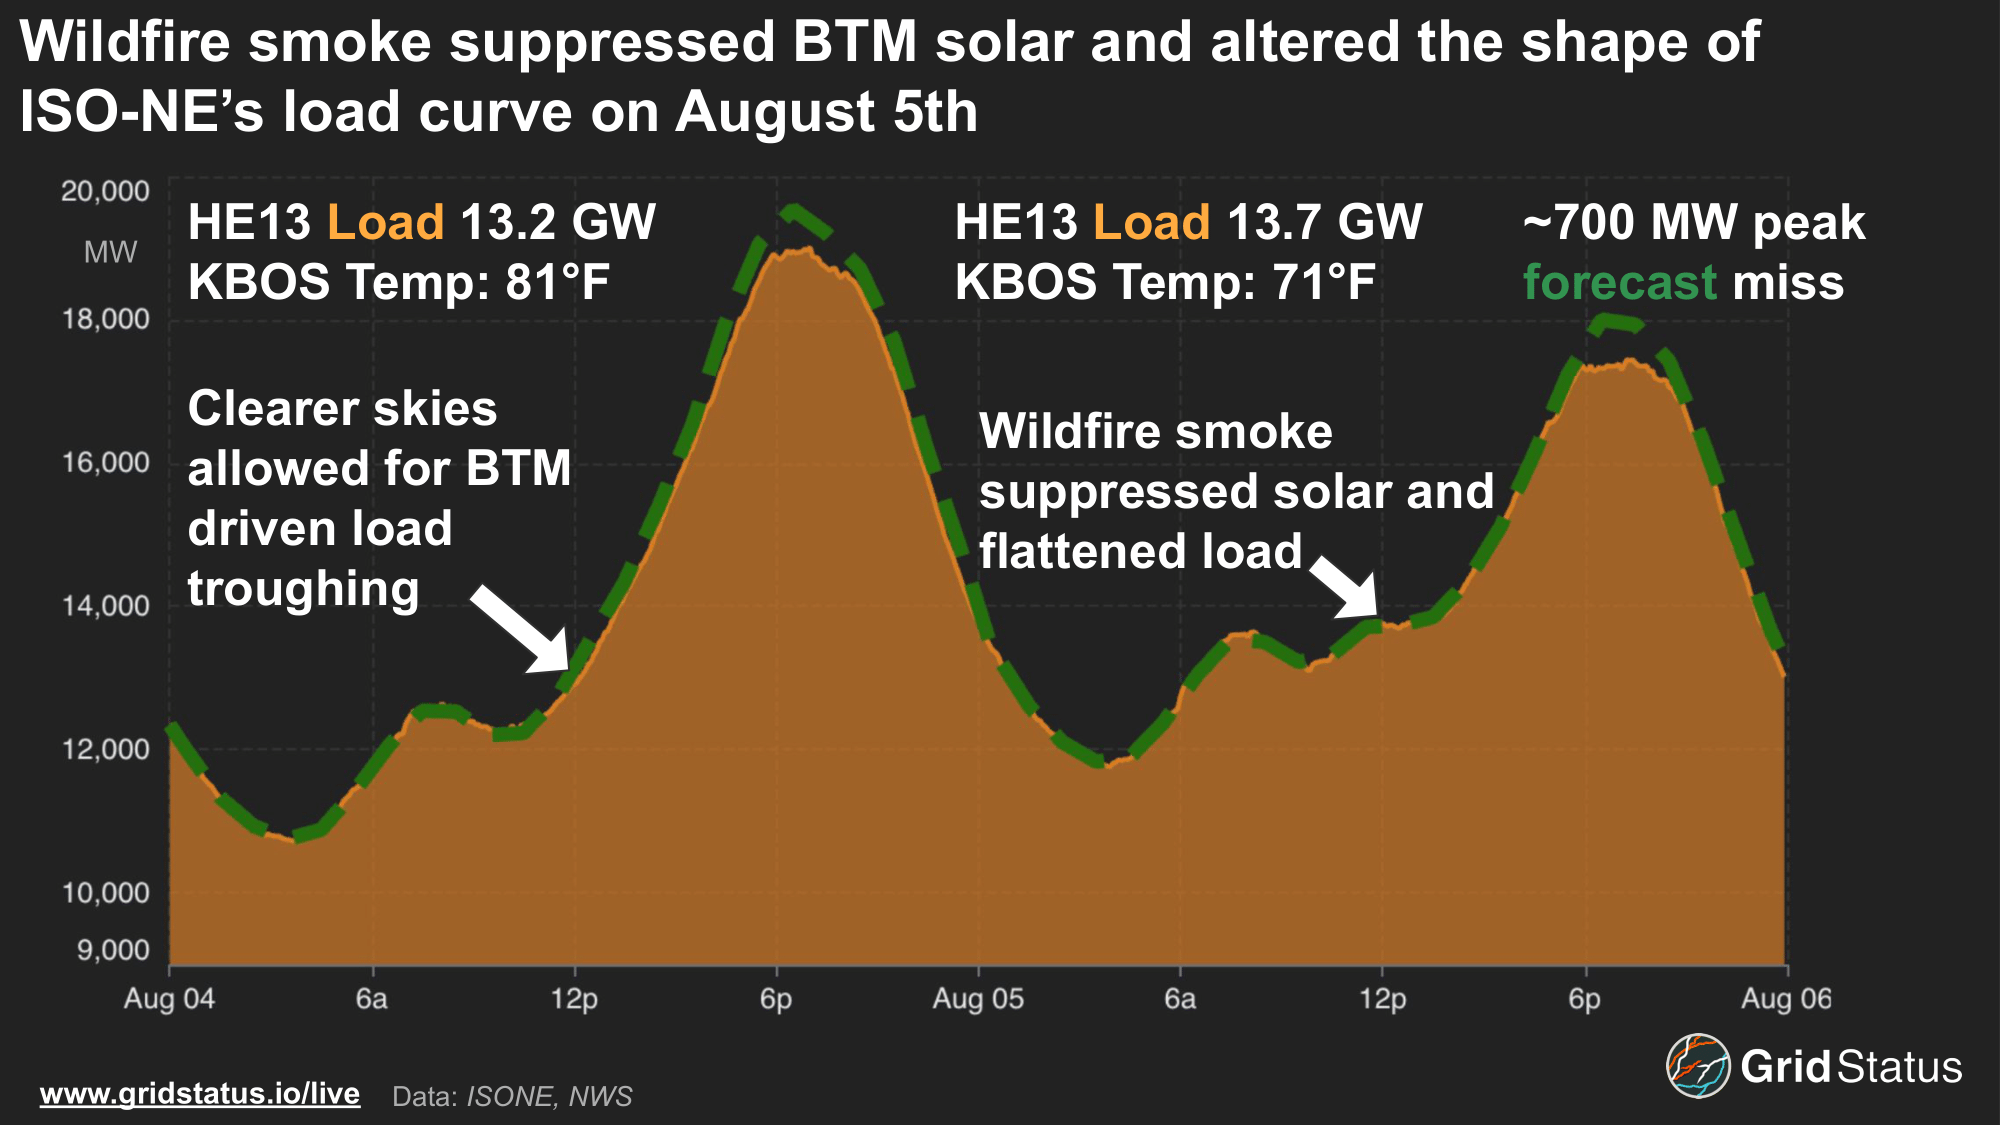
Afternoon load was over 500 MW stronger day over day, even as temperatures in Boston were 10 degrees cooler. This would normally be a sign of lower load, but suppressed BTM solar increased daytime demand. The cooler temperatures and reduced cooling load was visible in the nearly 1,500 MW drop in evening peak load as smoke and sea breeze helped rescue demand. Normally, wildfire smoke impacts in the Northeast generally follow a familiar pattern: smoke reduces solar output, pushing daytime load higher, then limits cooling demand into the evening.

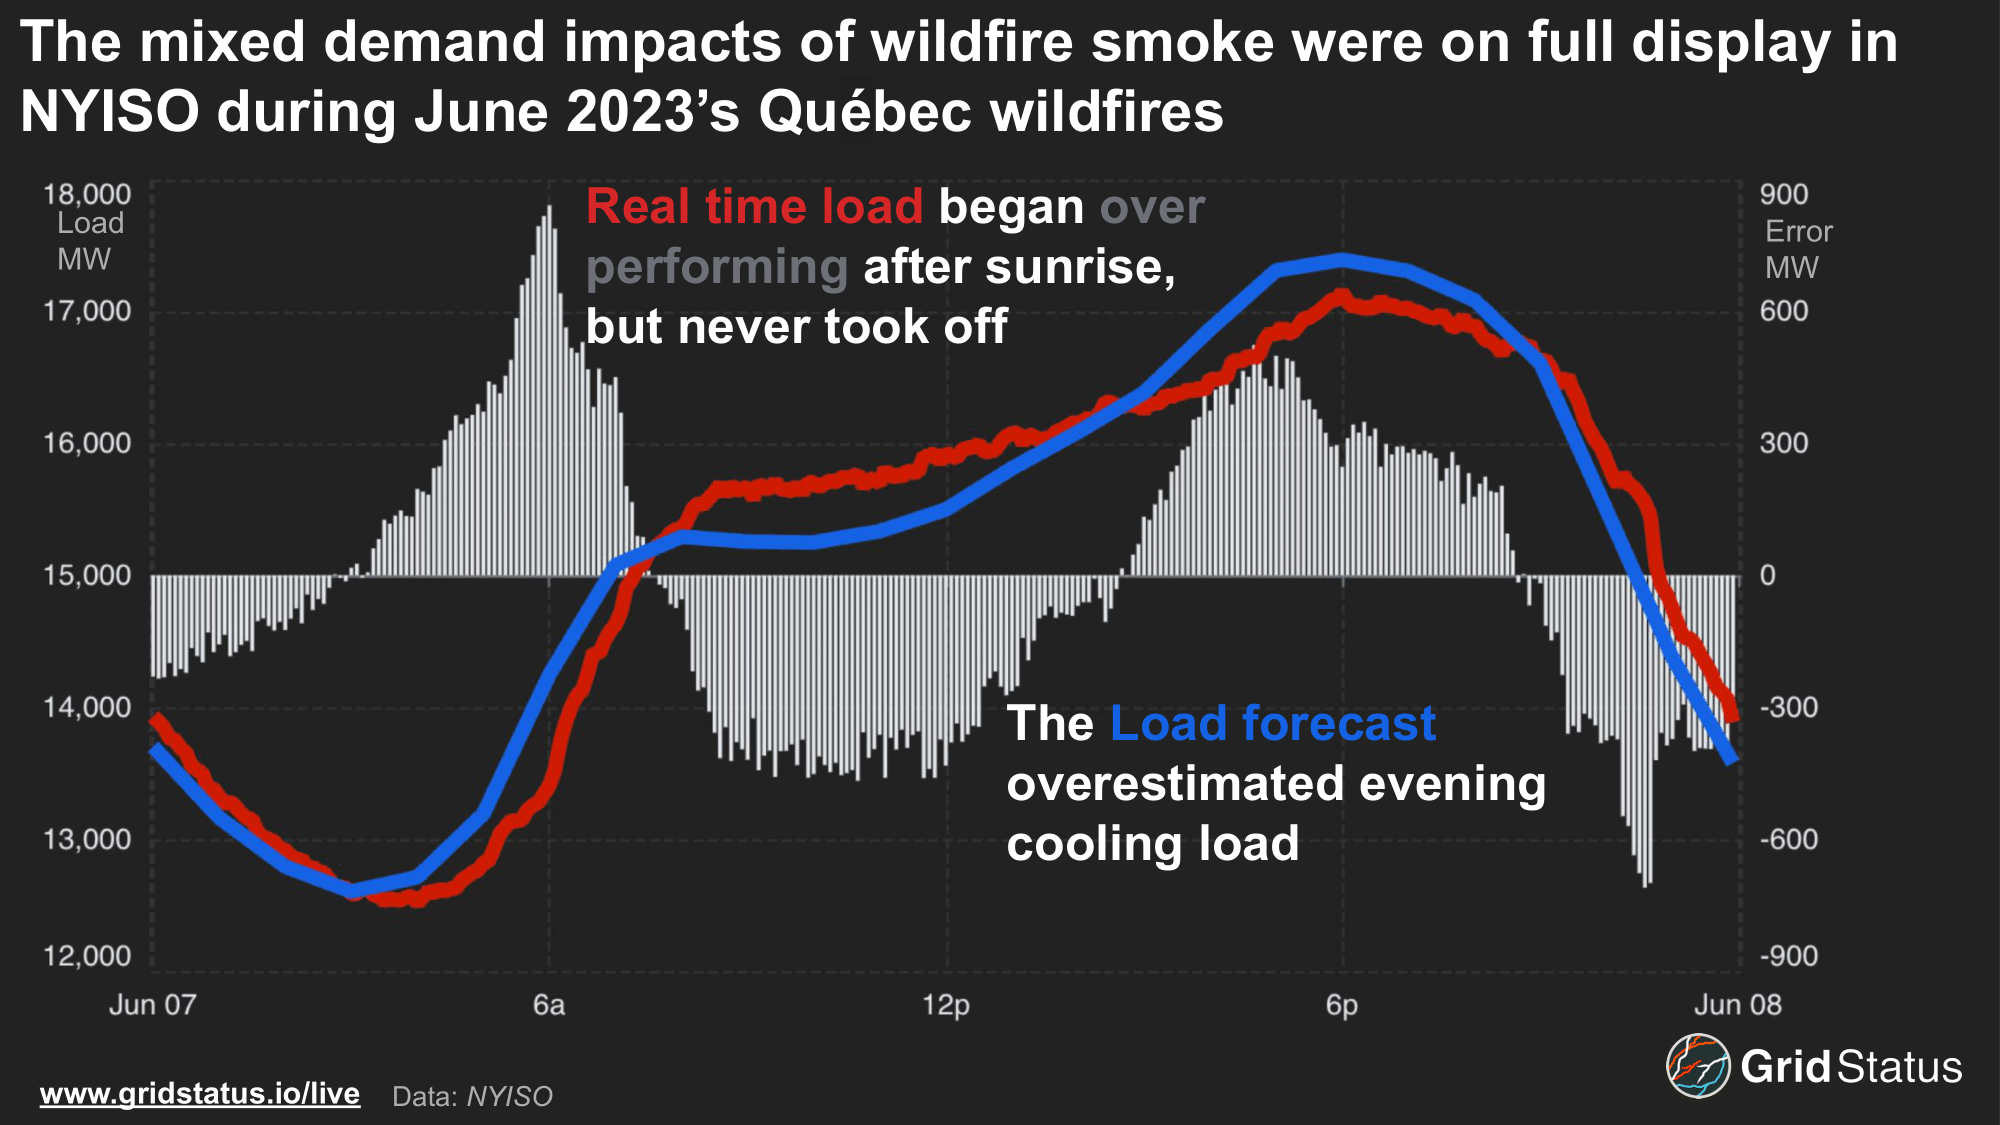
While smoke increases daytime load due to reduced BTM solar, the demand effect often reverses by evening. The same factor that weakens solar output, reduced sunshine, also works to suppress temperatures and reduce cooling load, most evident during the evening peak. As a result, real-time peaks often fall short of ISO forecasts. This was also evident in 2023, during the wildfires in Québec.
Summertime Sadness for Northeastern Power Plans
Canadian wildfire smoke and its impacts on power markets rose to prominence during 2023 when wildfires plagued Québec. Regions across Canada have been in severe drought for years, effectively turning the nation’s vast wilderness into tinderboxes. While thankfully not as destructive as Summer 2023, Summer 2025 has seen over 7 million hectares burned as of mid-August.
As we noted in our blog on potential tariff impacts, Québec plays an important and growing role in grid operations in the Northeast. Neighboring markets in the United States are relying on the province’s vast hydroelectric resources to meet decarbonization goals.
Intertie flow capacity is actively growing, with projects active in both New York and New England set to increase total transfer capability by over 2 GW. As more physical connections are made between the two regions, the risks associated with wildfires, particularly those in Québec, shift from solar suppression to direct transmission curtailments.
Imports from Québec, a winter-peaking region, are valuable to the Northeast during summer demand peaks, when air conditioning load is at its highest. Both New York and New England remain firmly summer-peaking, a pattern unlikely to shift before the mid-2030s at current rates of electrification.
Direct transmission system impacts occurred early in July 2023 when flows on Phase 2, a DC tie line between ISO-NE and Québec, were suddenly curtailed. Exports from Québec peaked over 1 GW during the afternoon of July 5th. before dropping to 600 MW over the evening, when flows on the tie line fell to 0.
Later reporting indicated the specific cause for this drop, which triggered a capacity deficiency event in New England: wildfires triggered automated curtailments on the line.
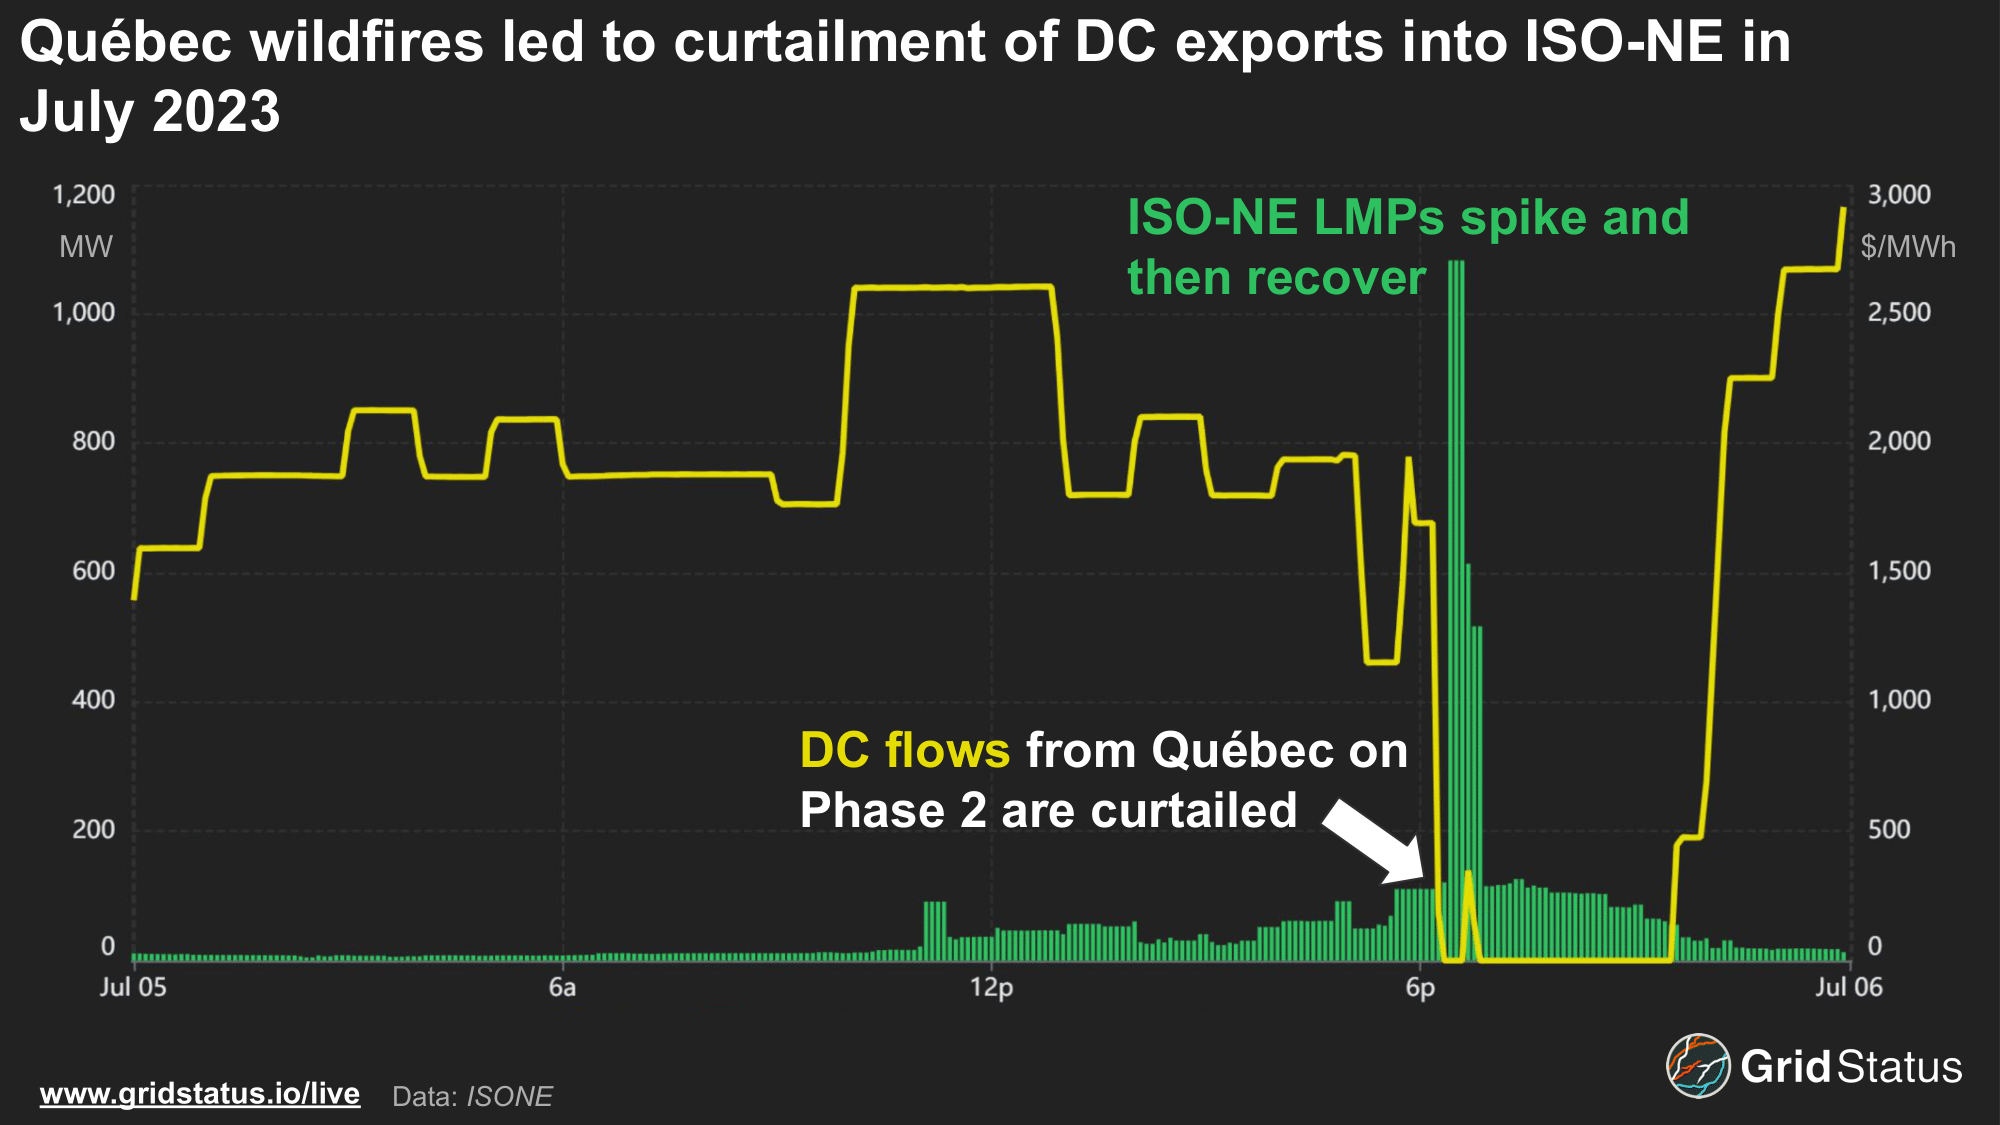
The sudden loss of flows left operators scrambling to bring 600 MW of generation online as New England approached the net load peak, triggering a nearly $2,700/MWh energy price spike after flows were curtailed.
What’s in your head?
Unlike Summer 2023, the most destructive wildfire season in Canadian history, this year has seen activity heavily concentrated in Central Canada, specifically the provinces of Manitoba and Saskatchewan. In recent years, fires have become so severe that some never fully go out, even during winter. These so-called “zombie fires” smolder beneath snow and ice, only to flare back to life as the spring thaw arrives, an ominous sign of increasing management challenges north of the border.
As fires rage, oftentimes uncontrolled in remote areas of Canada, smoke is carried due east, blanketing the Midwest and drifting into the Northeast.
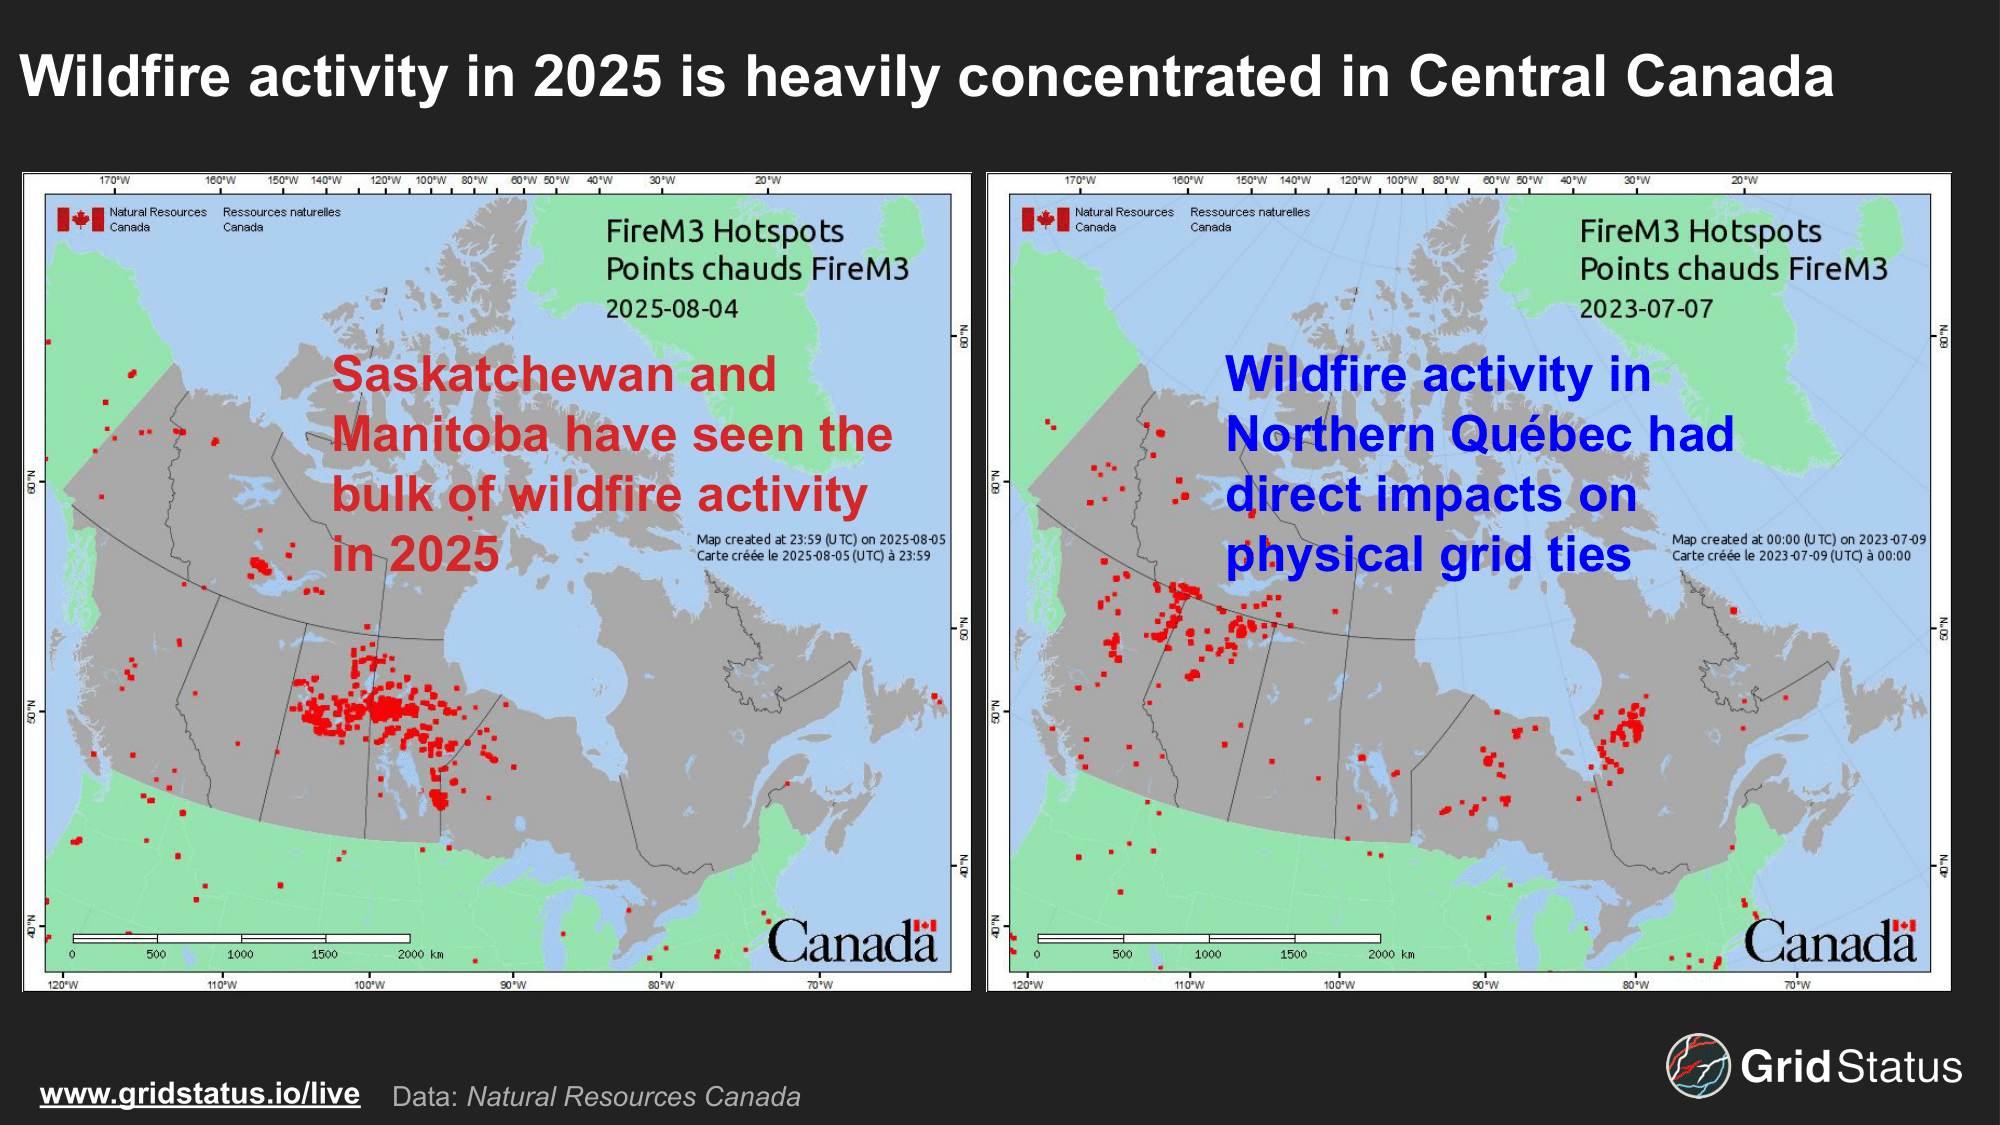
The location of wildfires directly affects smoke density, air quality, and the magnitude of impacts on the grid. In Summer 2023, smoke from neighboring Québec reached the Northeast after a short journey, spending little time in high-altitude winds. This allowed dense plumes to blanket the region, turning skies an opaque gray. With most of this season's wildfire smoke in the middle of Canada, smoke is less dense across the East, reducing the magnitude of impacts.
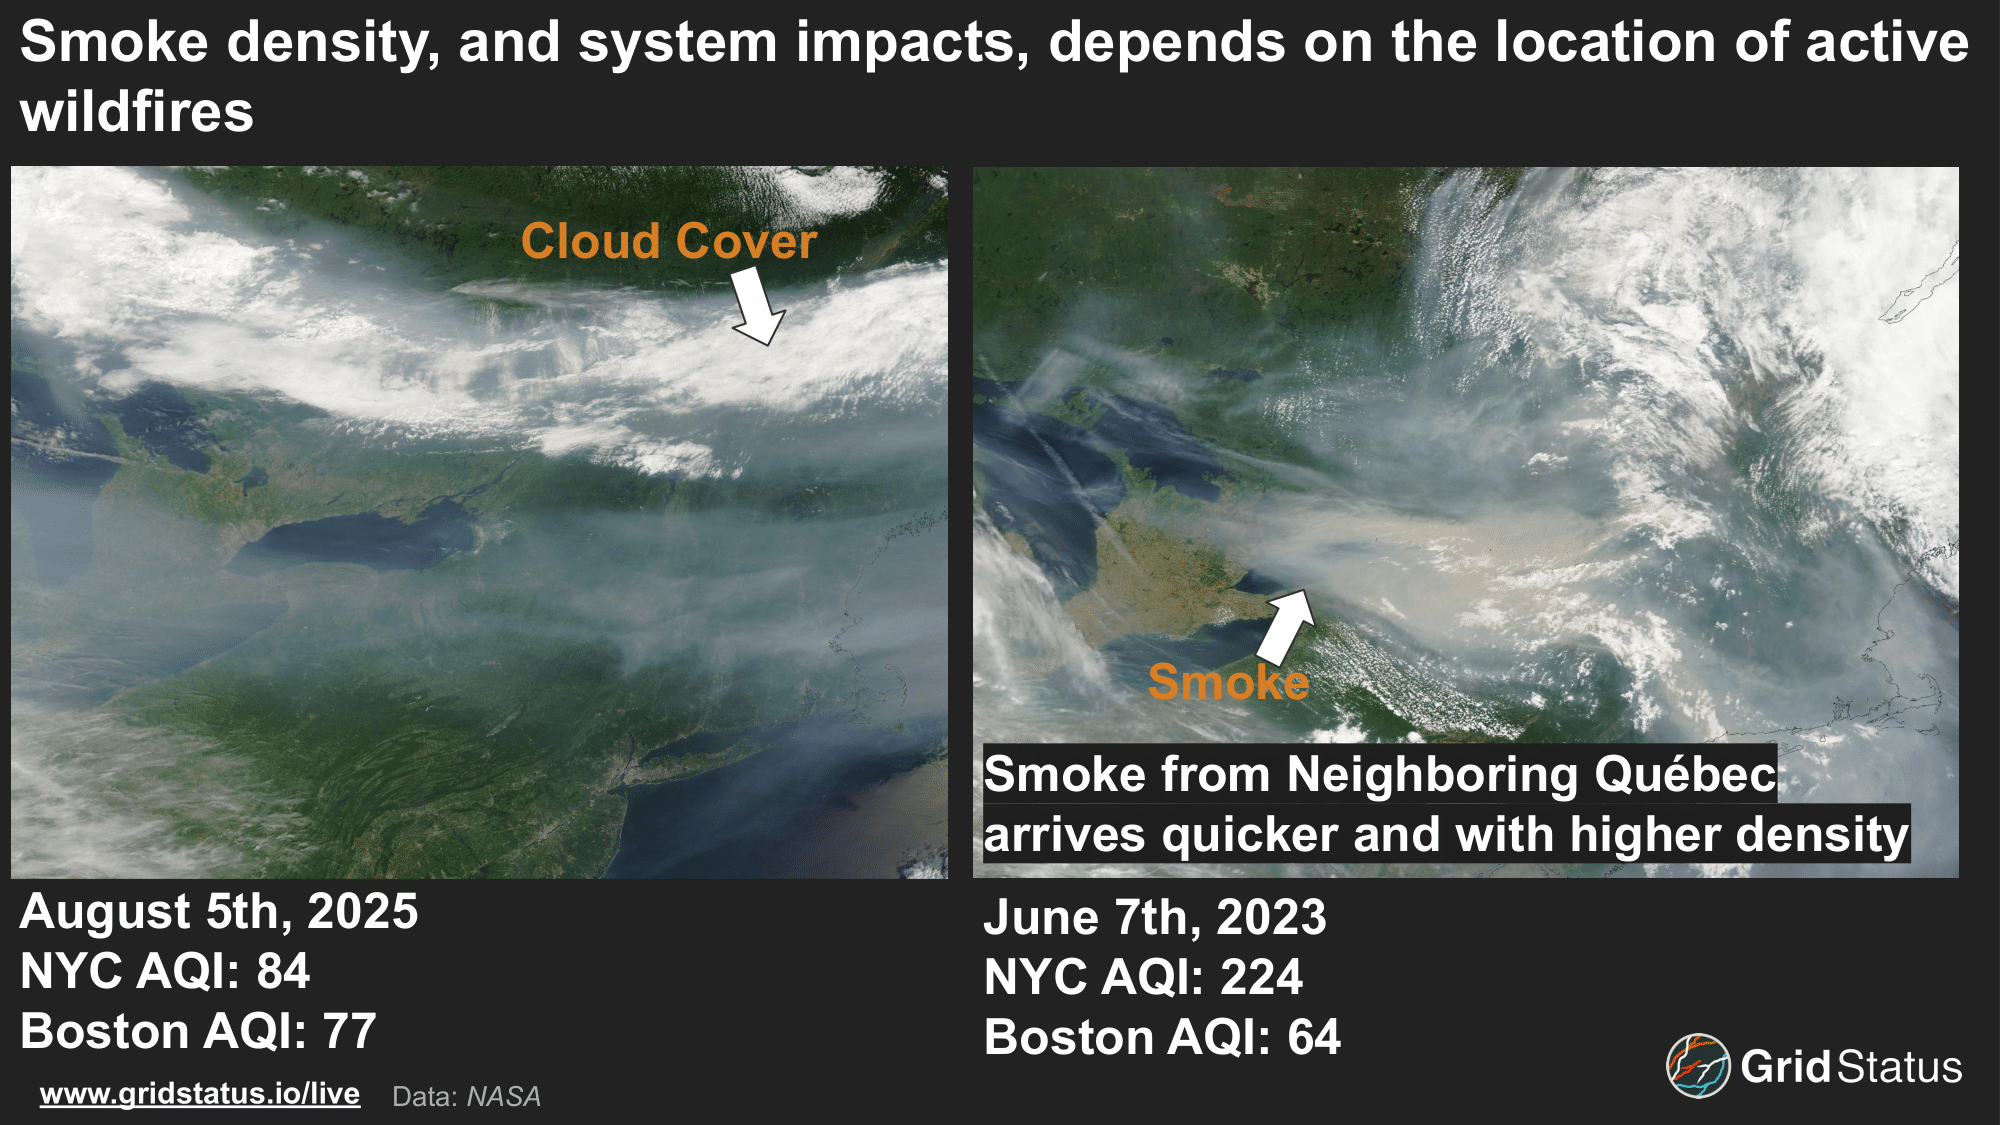
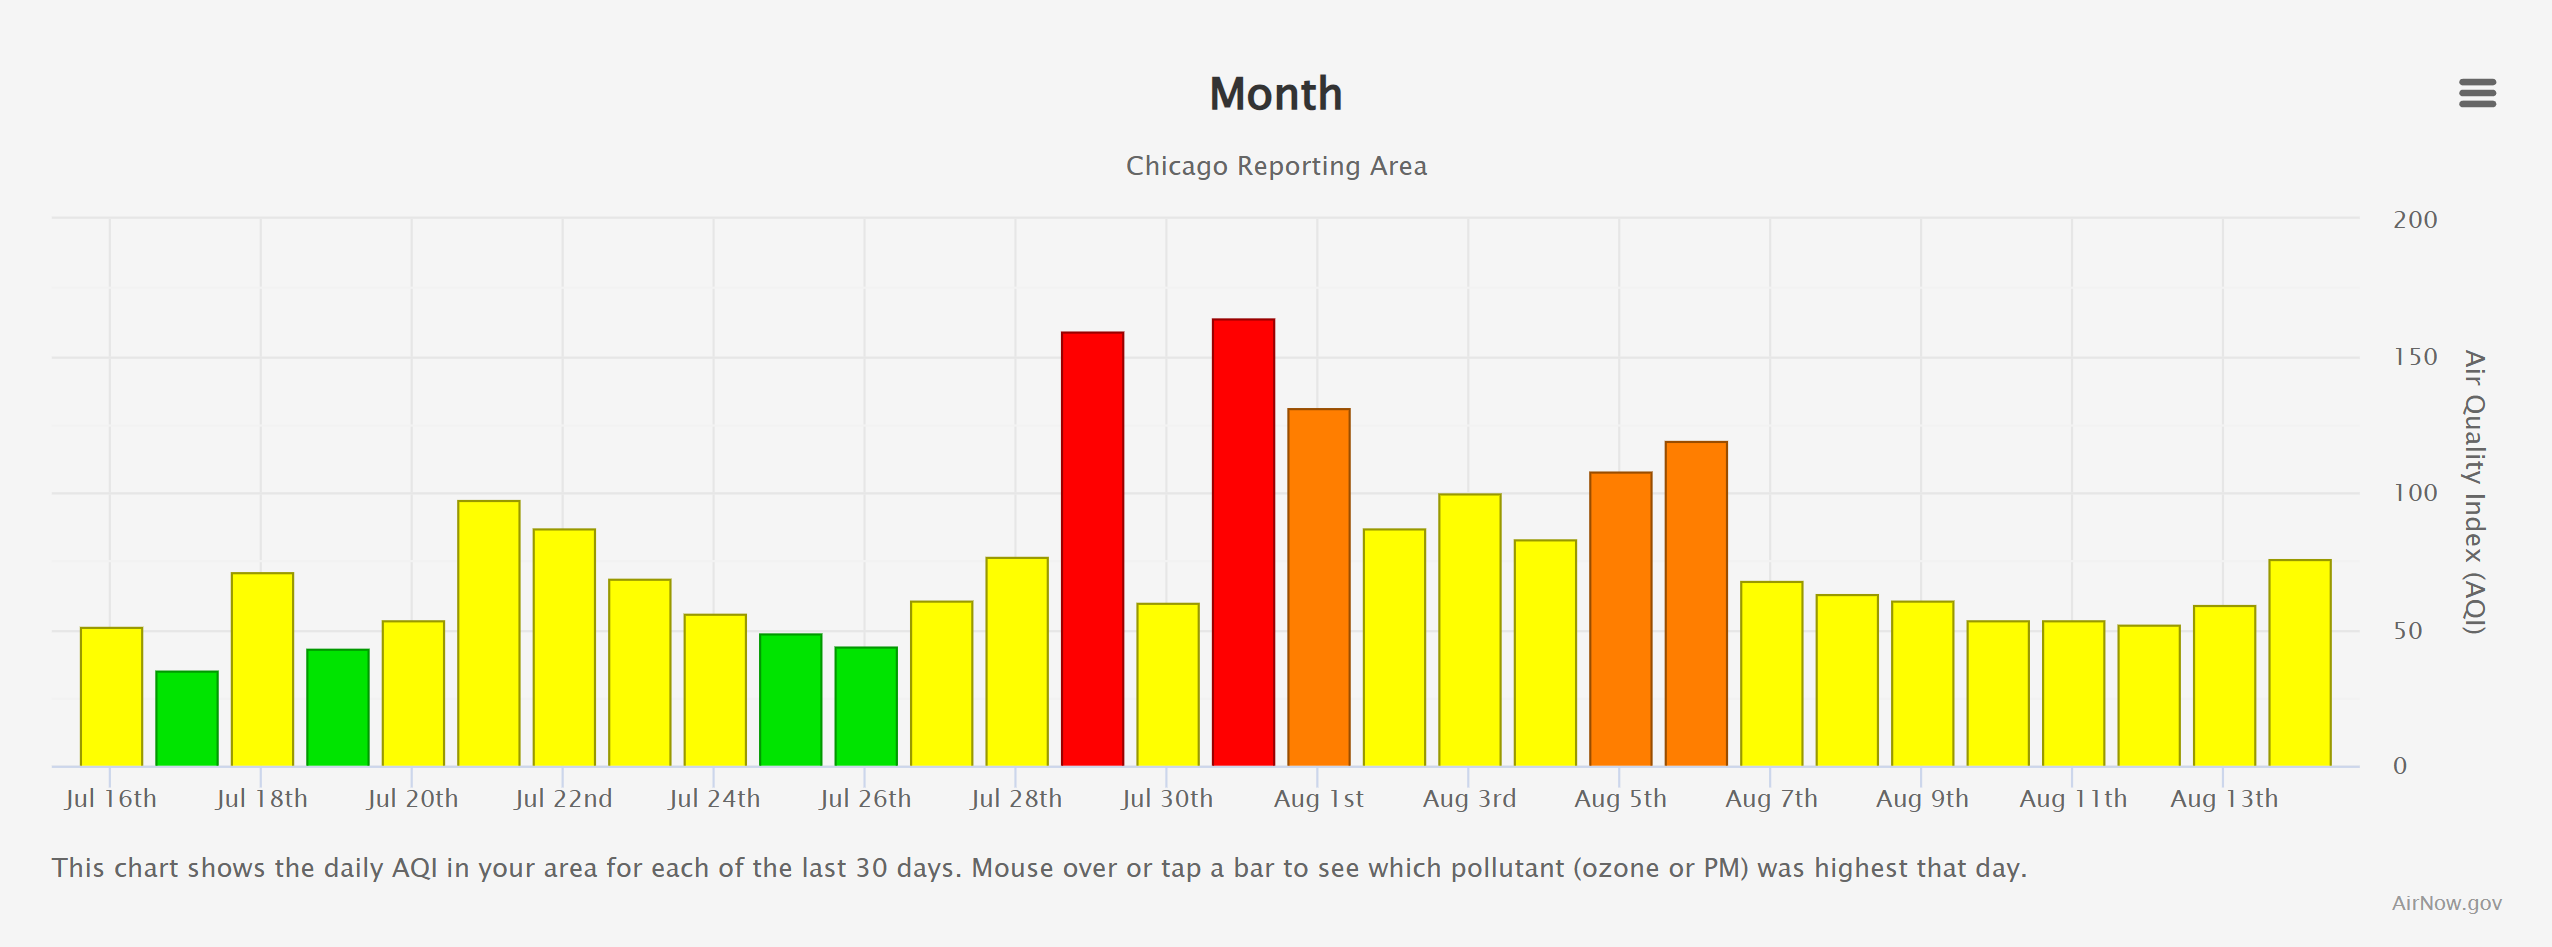
The direct proximity and density of smoke from Québec is visible in the difference in air quality index (AQI). While both days saw unhealthy air, June 2023’s air quality index, which measures particulate matter that limits sunlight exposure, was over 2.5x higher than in 2025.
Forecasting A Wide Net
Even as the frequency of wildfire activity has increased, forecasts have struggled to capture the impacts on both solar generation and system load.
NYISO’s forecast particularly struggled to capture BTM solar generation both on a zonal and system-wide level. Monday’s forecast over forecast solar generation by almost 500 MW as the first round of smoke reduced solar output. The following day, the forecast seesawed back and forth, under forecasting solar by over 1100 MW.
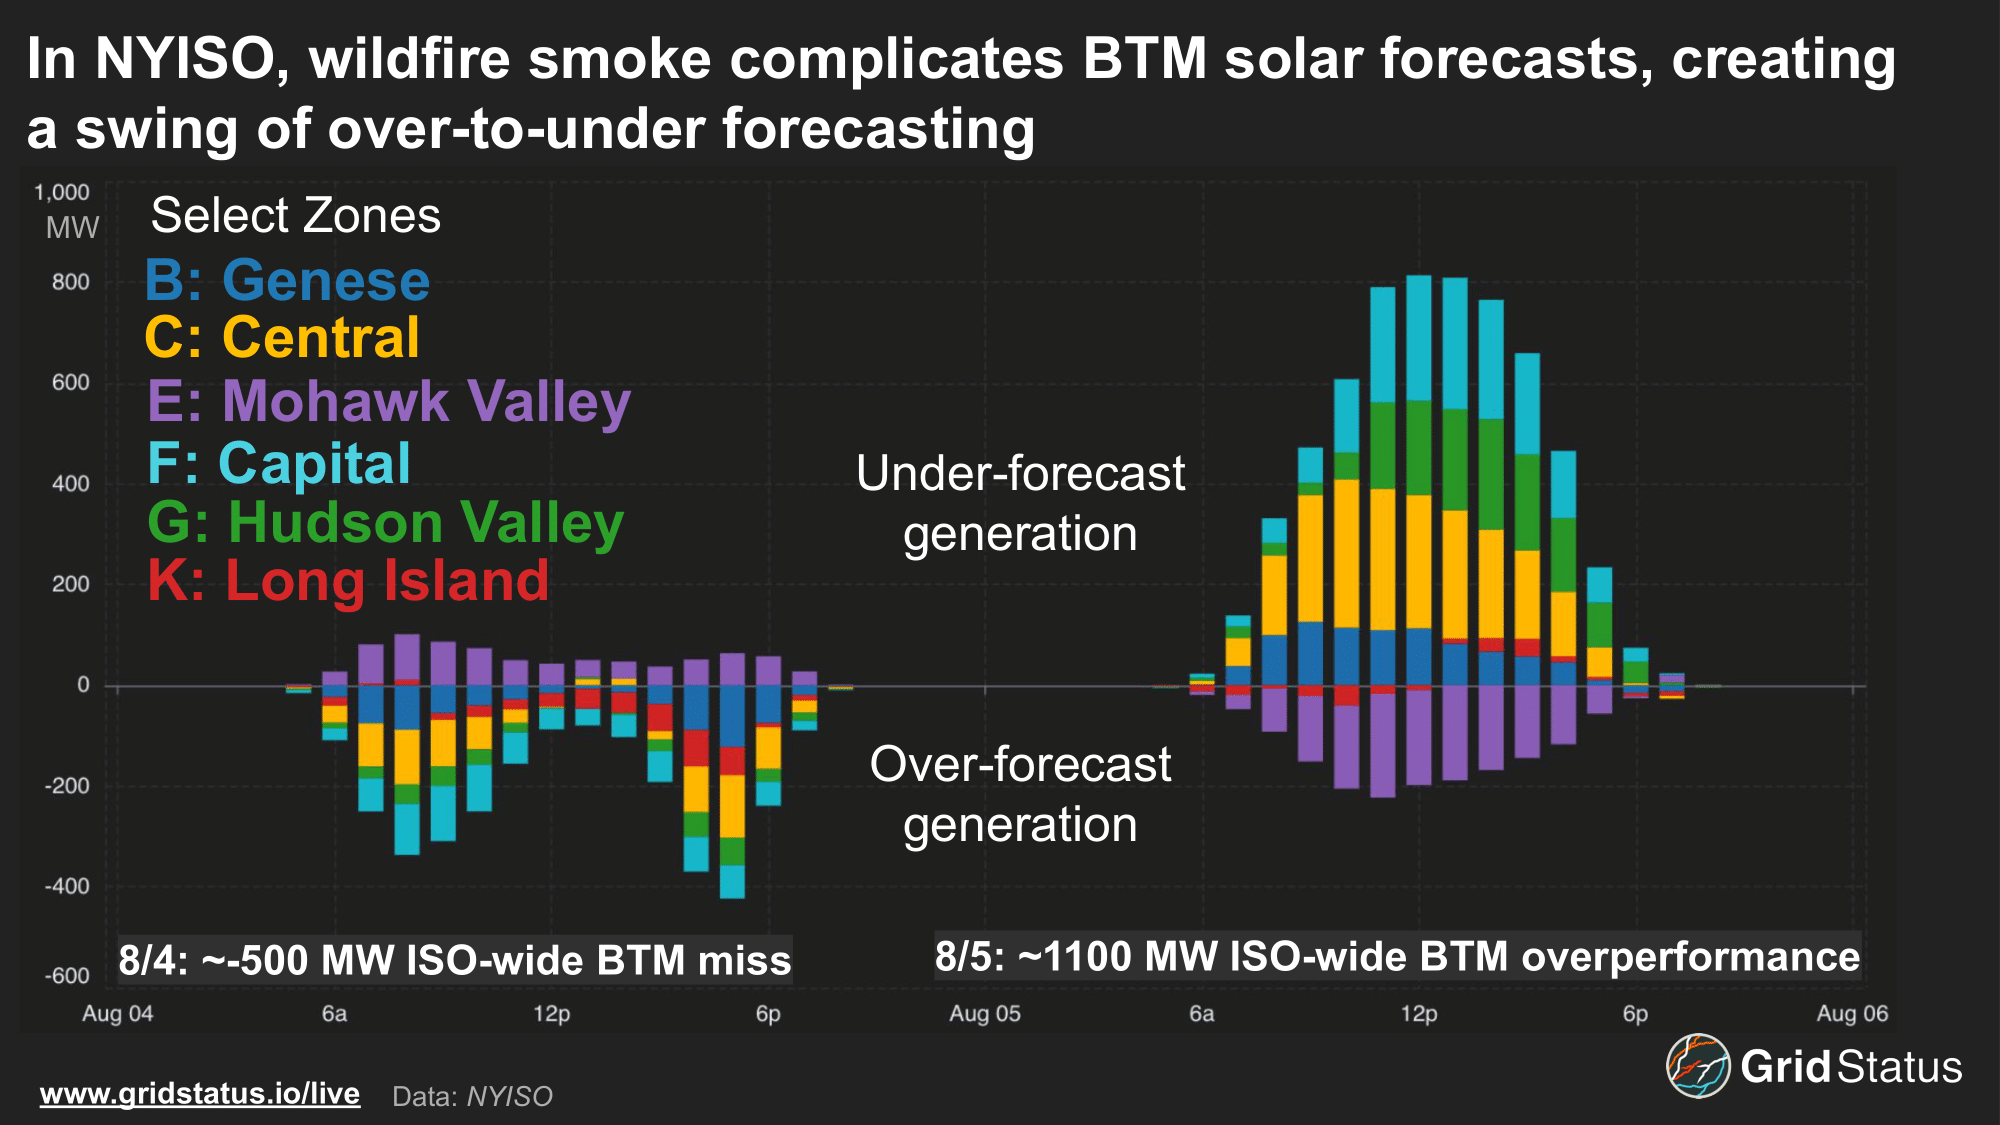
Notably, almost all of the regions that had BTM over forecasted the previous day saw it under forecasted the following day. The impact of smoke wasn’t limited to forecast difficulties, as its effect on generation shuffled the typical ranking of BTM solar output per zone in NYISO.
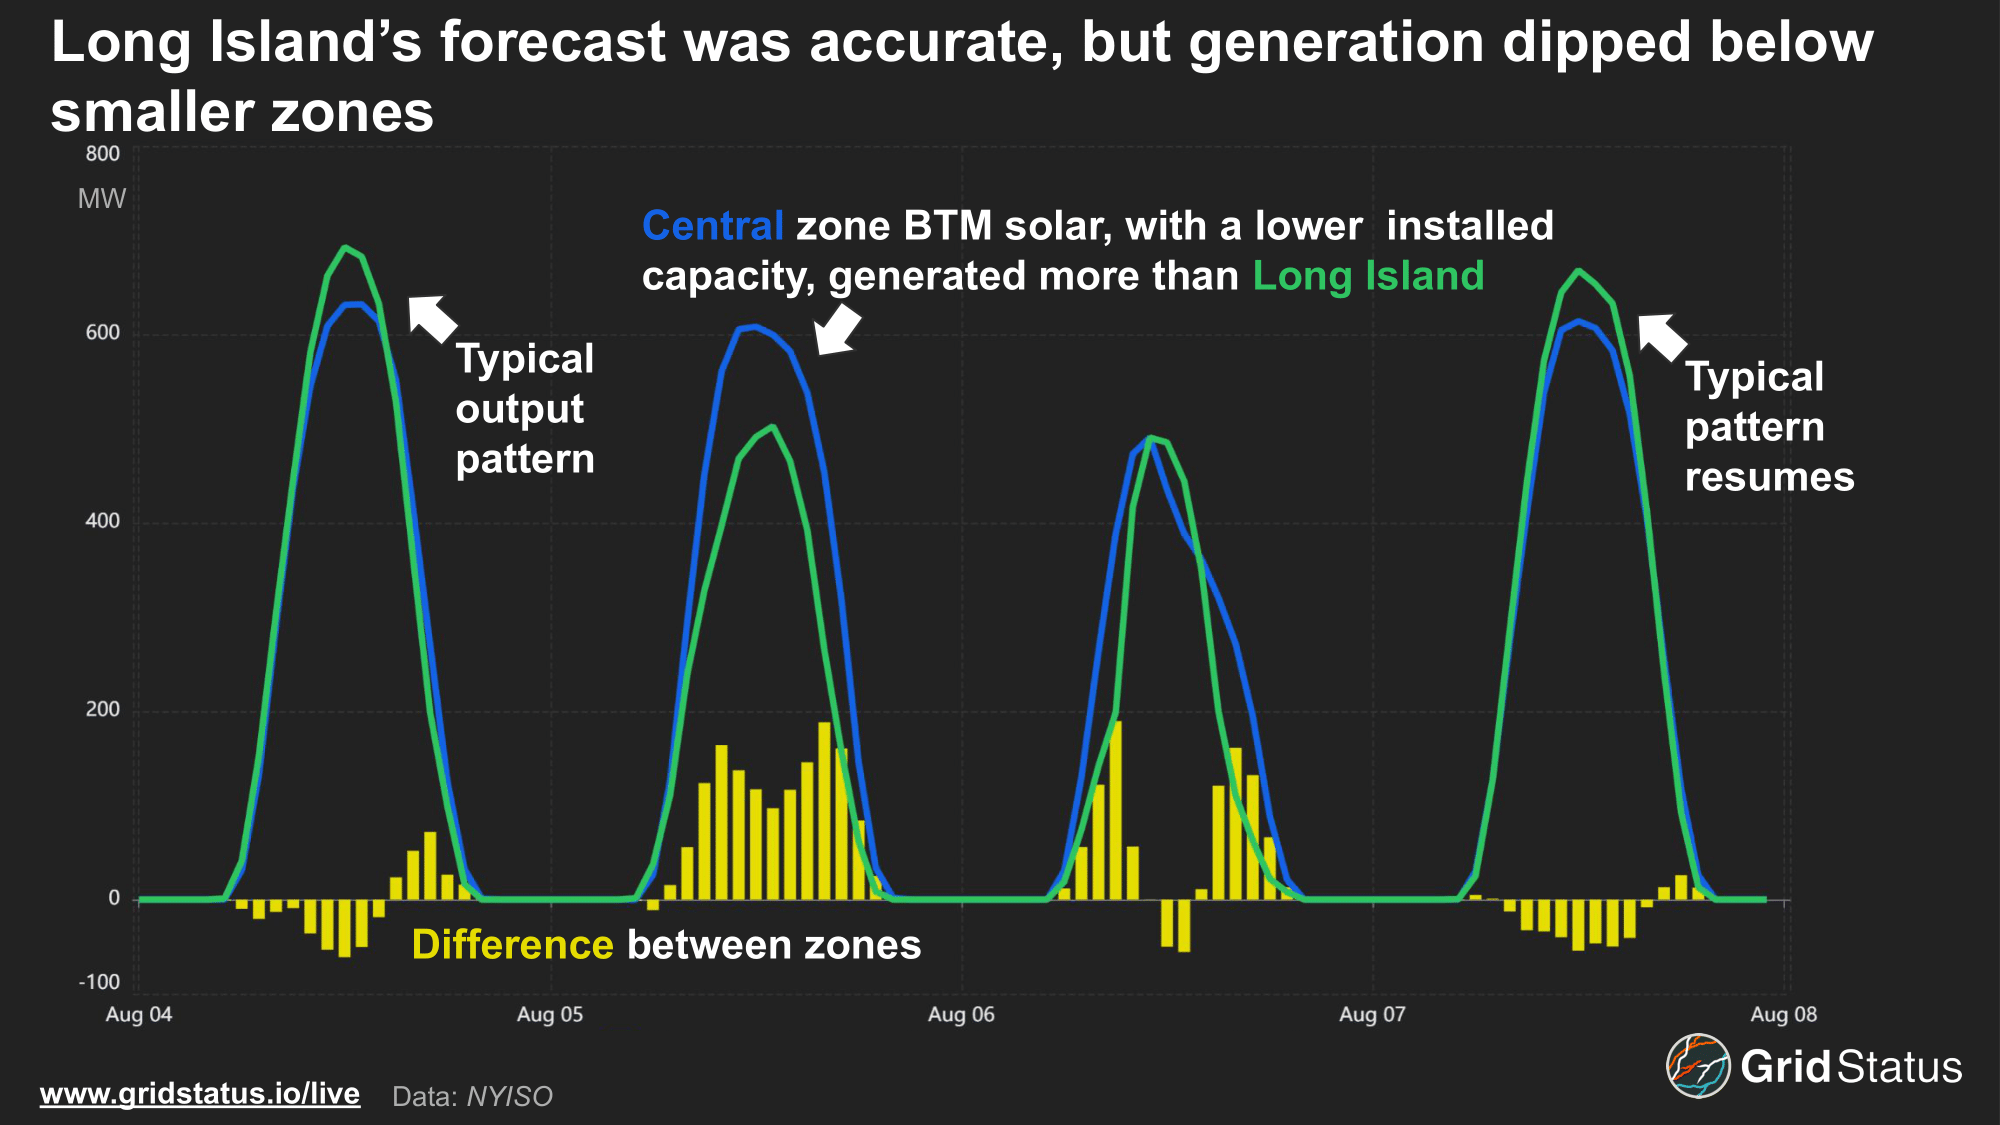
Central’s over performance on the 5th opened a 100-200 MW output gap compared to Long Island, which has a higher installed capacity.
This isn’t the first time the NYISO has faced challenges forecasting solar generation during wildfire events. Back in 2023, we highlighted NYISO’s struggles forecasting solar generation during that year’s round of Québec fires, and even with two years of additional data, the trend persists. As solar becomes a larger portion of fuel mixes across the US, understanding the impact of wildfire smoke on generation and how these impacts manifest on the grid becomes increasingly important, and models will need to be refined to better account for the expected increase and severity of wildfires.
Our forecast analysis app makes the former easier by allowing you to view how forecasts performed and changed over time, particularly as it became evident that wildfire smoke would drift back into a region. For example, ISO-NE’s forecasts held up relatively well during daytime hours, but struggled over the evening.
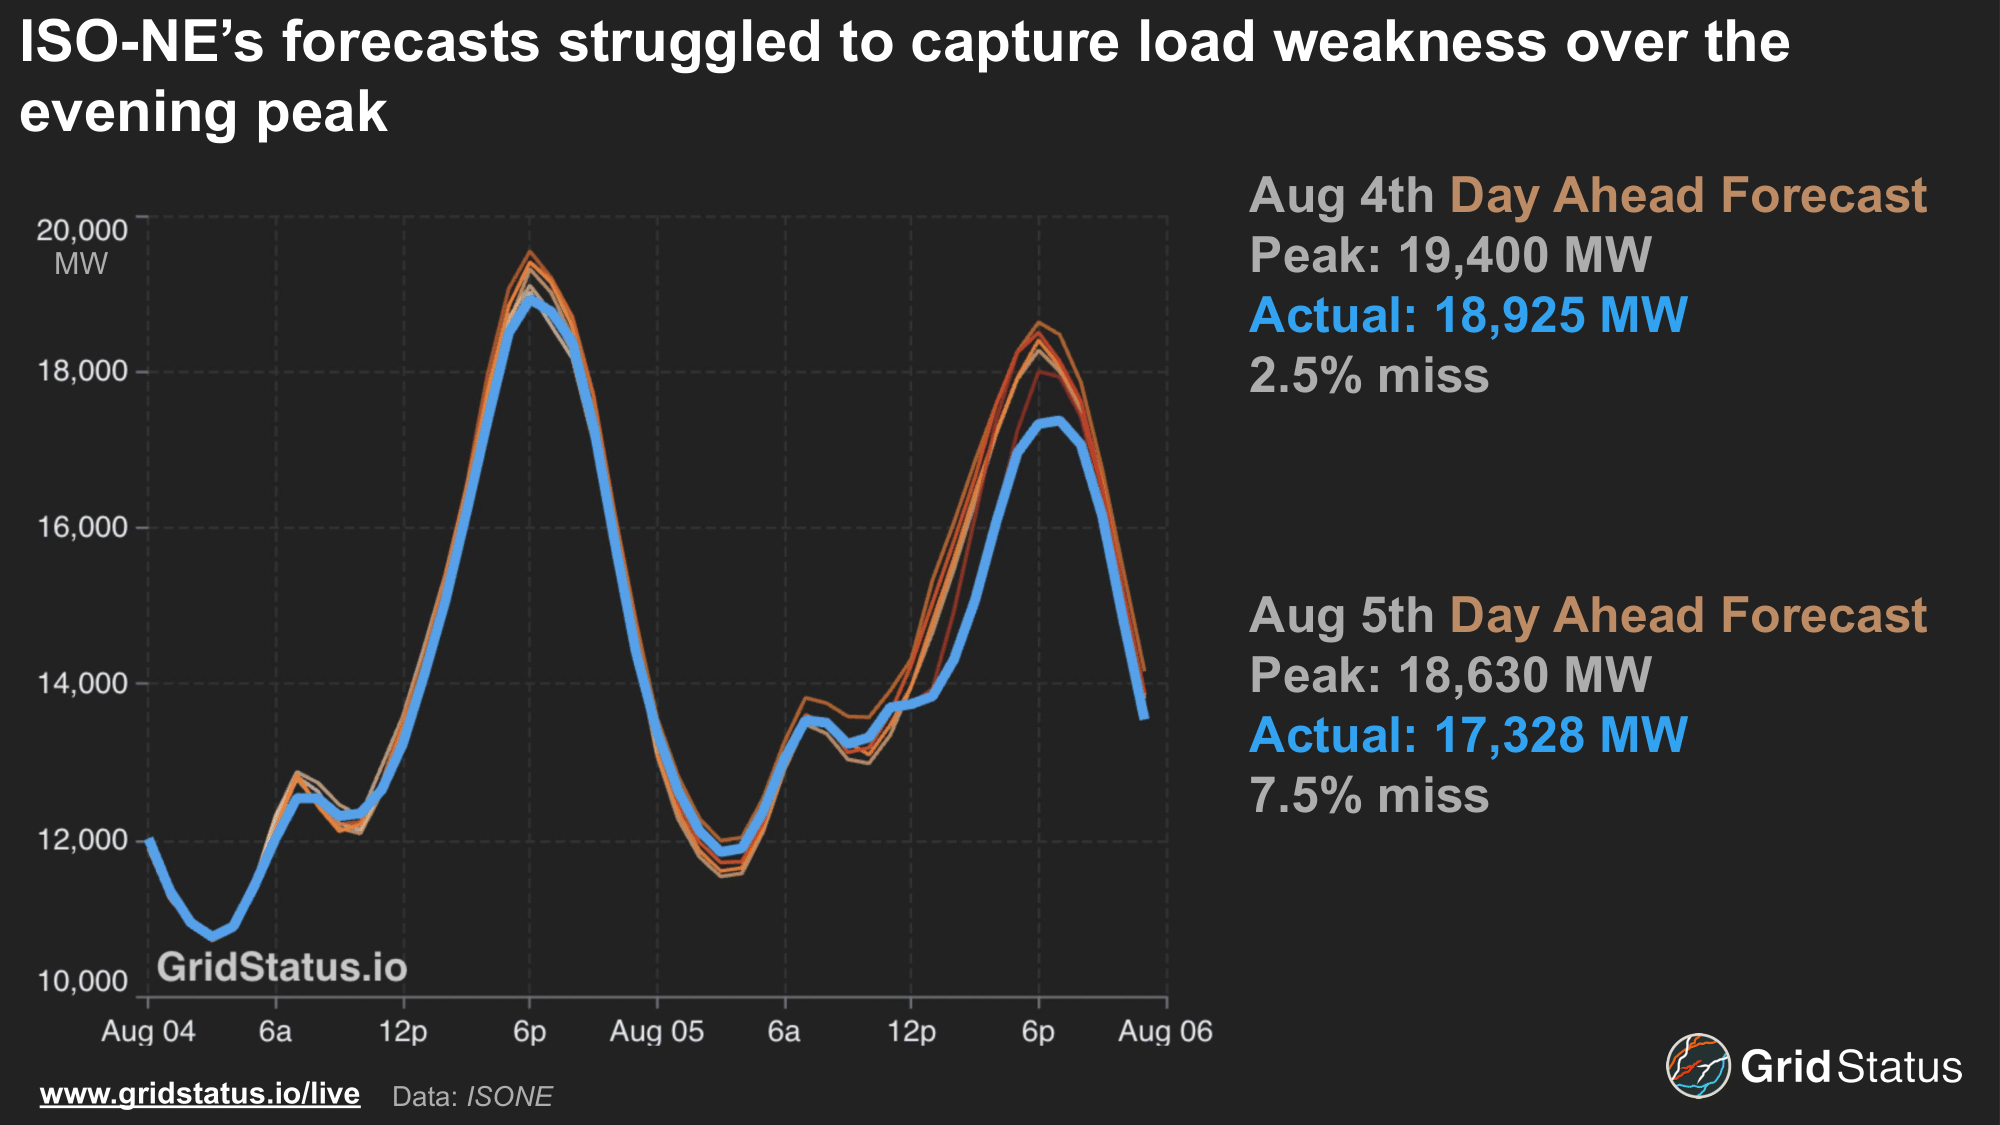
Tuesday’s forecast was considerably off during the evening peak as ISONE dealt with a combination of wildfire-driven temperature underperformance and sea breeze keeping coastal temperatures comfortable, particularly in Boston.
Similarly, the sea breeze may have been a driver for slight solar overperformance on Long Island on the same day. On Tuesday, winds at KJFK were from the Southeast, blowing directly off the Atlantic. These stronger offshore winds, partially the impetus for New York’s offshore wind energy goals, appear to have helped to push away some smoke from Zone K, home to the highest concentration of BTM solar in NYISO.
The Rise and Fall of a Midwest Solar Curve
While the most notable examples of wildfire smoke’s impact have been felt in the Northeast, increasing solar development in the Midwest exposes MISO to risks from Central Canadian wildfires.
As we noted in our early summer blog, solar development is accelerating in markets that have long trailed traditional juggernauts like ERCOT and CAISO. With wind installs slowing, MISO has seen a dramatic increase in solar generation, exceeding 14 GW of generation for the first time in August 2025. As solar capacity expands in the Midwest, wildfires in central Canadian provinces present risks similar to those in the Northeast, though the impacts would play out differently given regional conditions.
Unlike Northeastern states, MISO lacks widespread BTM solar adoption, meaning that smoke impacts wouldn’t be seen on daytime load curves due to suppressed BTM generation levels, but on utility-scale solar production. This adds another layer of complexity for grid operators as solar is expected to help ease summer daytime conditions, particularly with seasonally low wind capacity factors.
Sundown
Rising wildfire activity paired with a shifting generation mix is creating new challenges for grid operators on both sides of the border. New York and New England have benefited from the expansion of BTM resources, as the impact of retirements in recent years has been somewhat mitigated by the ensuing reduction in system load.
While individual grid operators in Canada and the U.S. are pursuing deeper power system integration, national tensions remain at historic highs, while managing wildfire smoke and its cascading effects is adding strain to both grids and a suddenly cool geopolitical backdrop.
Follow wildfire smoke patterns and their market impacts on our live pages, and stay tuned as we launch new tools to track smoke ahead of future seasons.