Curtailment: When We Throw Away Clean Energy
As we approach the end of another shoulder season — a period of lower demand and higher transmission outages — it's a good time to explain curtailment, a crucial yet often controversial aspect of today's grid operations.

As renewable energy from solar and wind expands across the country, surpluses in generation will become increasingly common and consequently lead to curtailment, which is the deliberate reduction of output below what could be produced.
As a concept and in practice, curtailment is interwoven into conversations, questions, and decisions about the modern grid. On its face, curtailment is a waste of “free” electricity from clean sources, but why does it occur? Is the answer as simple as building more transmission, as often presented? Electricity markets are a construct of human administrative engineering, so recognizing their limitations and how those constraints can lead to unintuitive outcomes is important to understanding curtailment.
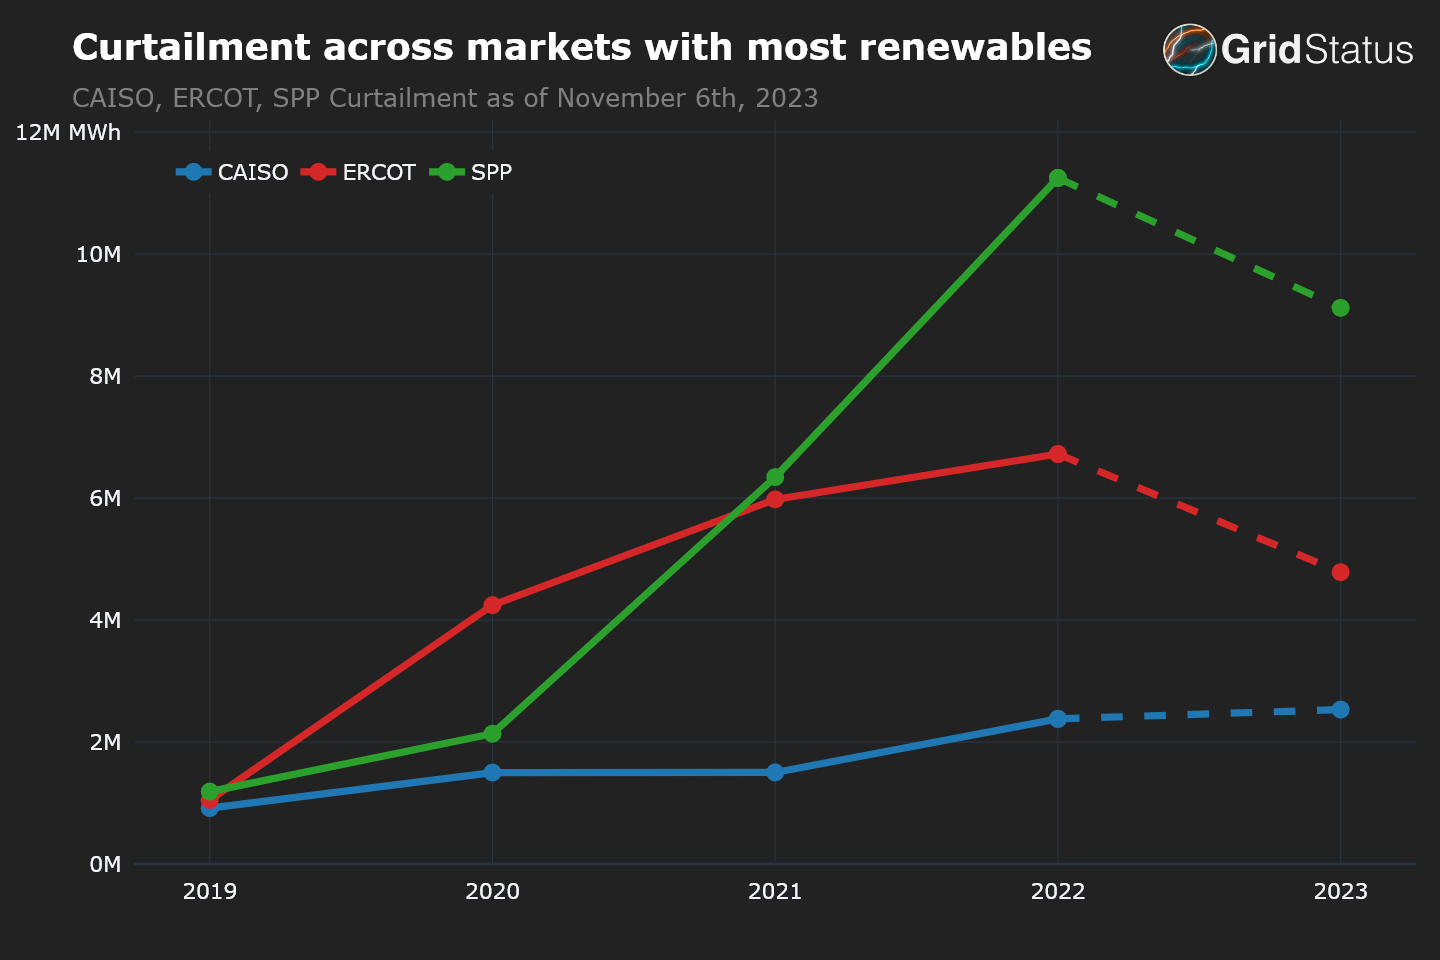
In this post, we analyze the dynamics behind renewable curtailment under three different (albeit interrelated) market circumstances in the areas that have the highest penetrations of renewables in the United States: California Independent System Operator (CAISO), Electric Reliability Council of Texas (ERCOT), and Southwest Power Pool (SPP).
Table of Contents
- A primer on curtailment
- Low demand for excess California Solar
- Transmission Congestion in Texas
- Dispatchable yet inflexible generation in Southwest Power Pool
- When less is more: a deeper look into congestion
- Conclusion
A primer on curtailment
In nodal electricity markets, curtailment refers to the intentional reduction in the production of electricity by certain generation resources. When used in conversation today, it almost always refers to zero cost renewable resources, namely wind and solar.
While curtailment is often seen as undesirable, especially from the perspective of renewable energy producers, is an essential mechanism for market operators to maintain a reliable and stable electricity grid.
A key difference between electricity as a commodity and others such as metals or produce is that the grid has to maintain a balance between supply and demand at all times. For example, while there are natural limits to the storage of potatoes, there is some flexibility in the timing of potato harvest, storage, and sale. Conversely, electricity is expected instantaneously whenever demand may occur. Fortunately, in aggregate we can make informed enough estimates to build a system with some tolerance, but that band remains fairly slim, albeit growing with the penetration of battery systems.
Curtailment and LMPs
Curtailment typically results from a negative price signal to generators via the Locational Marginal Pricing, or LMP. The LMP reflects the value of electricity at a specific location, taking into account the costs of generation, transmission constraints, and transmission losses. When the LMP is sufficiently negative, it becomes uneconomical for a unit to generate its full output, leading to curtailment. The LMP can be viewed as a representation of the administrative engineering needed for the operation of wholesale electricity markets.
In the following sections, we examine different circumstances that all lead to the same outcome - a strongly negative congestion component of the LMP. Curtailment may also occur via specific, targeted, operator actions (such as the September 6th event in ERCOT), but here we will largely focus on market fundamentals that influence LMP formation.
The fact that disparate circumstances can lead to curtailment through price signals alone is both the beauty of a market system and a factor that muddles understanding of correlation and causation.
Low demand for excess California Solar
Let's start by exploring a fundamental driver of curtailment – a lack of demand for the renewable capacity that has been built.
California has seen explosive growth in solar generation, with solar resources built to serve the summer peak leading to excess capacity during periods of low demand. The scatter plot below lays bare the existence of a relationship between curtailment and low load.
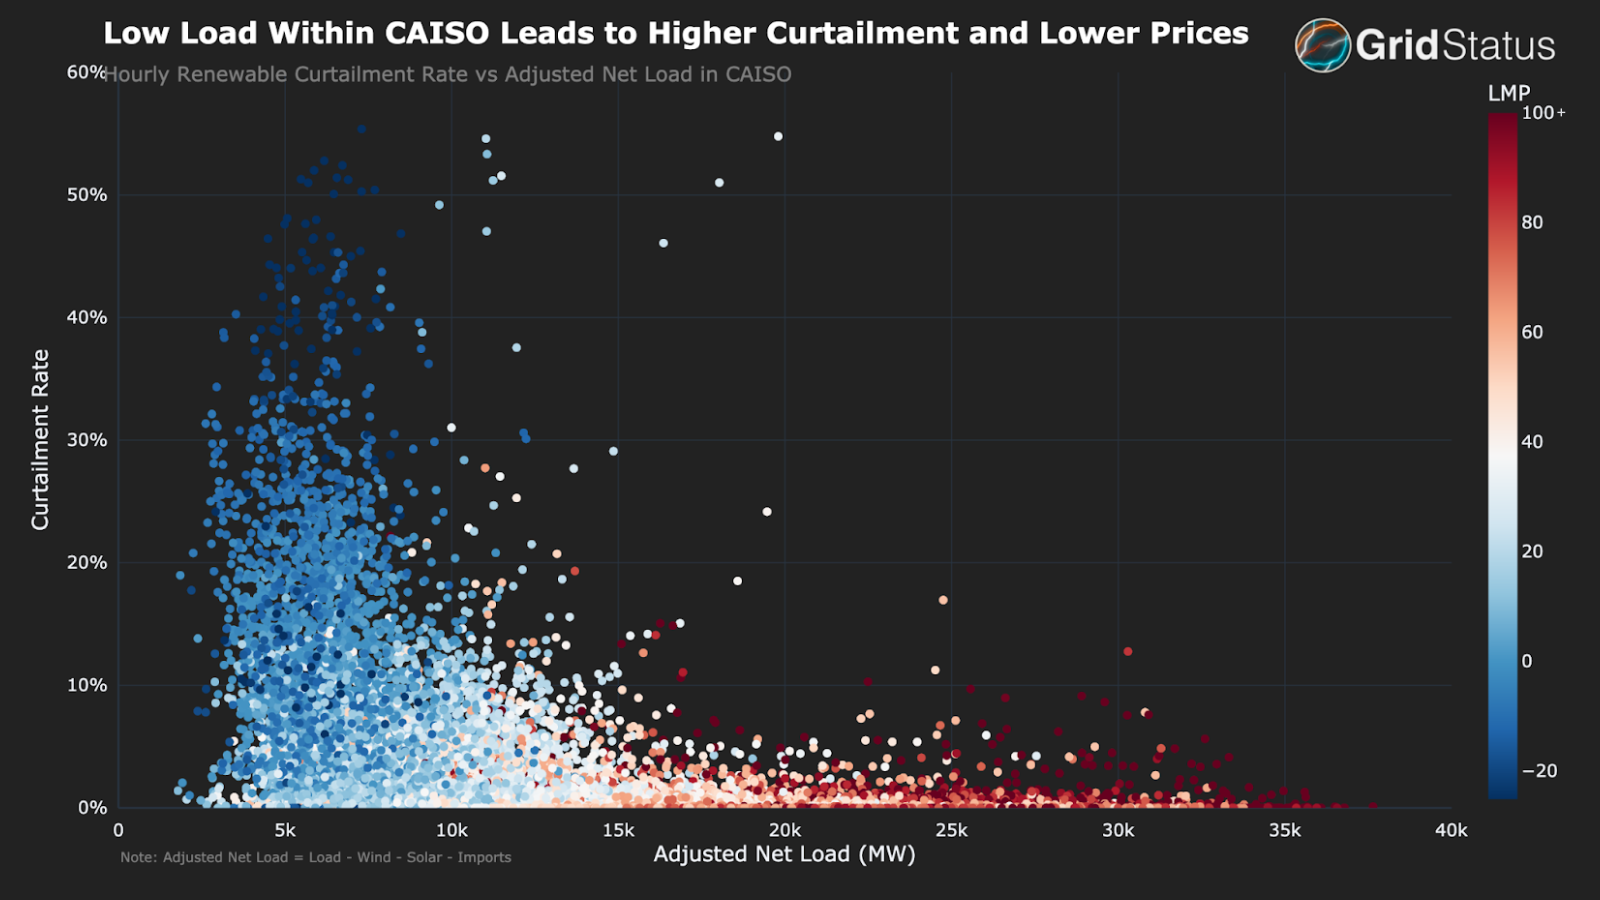
In a way, this graph shows a properly functioning market, as higher prices tend to be correlated with lower levels of curtailment, while very low prices are properly signaling the existence of excess generation exacerbating congestion.
The solar buildout is so large that CAISO is often exporting during peak sunny hours, even while running gas plants internally. But, what happens when the regional grid can't use all of California's solar?
While it still relies on interchange with neighbors, the timing and depth of the relationship has shifted due to renewable generation as we can see below

CAISO has undergone quite a transformation over the past decade.
- In the above figure, the second chart shows a deepening of CAISO exports that even surpasses the solar and wind generation of the first chart.
- While it appears the solar generation suddenly spikes over the summer in 2023, it was actually being substantially reduced by the greater rate of spring curtailment than previous years.
- A driver of this outcome not in the chart is the rapid penetration of behind-the-meter solar, which is roughly half of all installed solar in the CAISO’s footprint. This generation doesn’t show up in the typical fuel mix chart, but does have an impact on load balancing requirements by freeing up additional utility-scale generation for regional exports.
As solar has expanded its role in daily CAISO generation, exports have become more common, but when regional demand is satiated, curtailment becomes the only option. With economic incentives to deliver as much renewable energy as possible, conditions can occur in which a given area has energy production above its load.
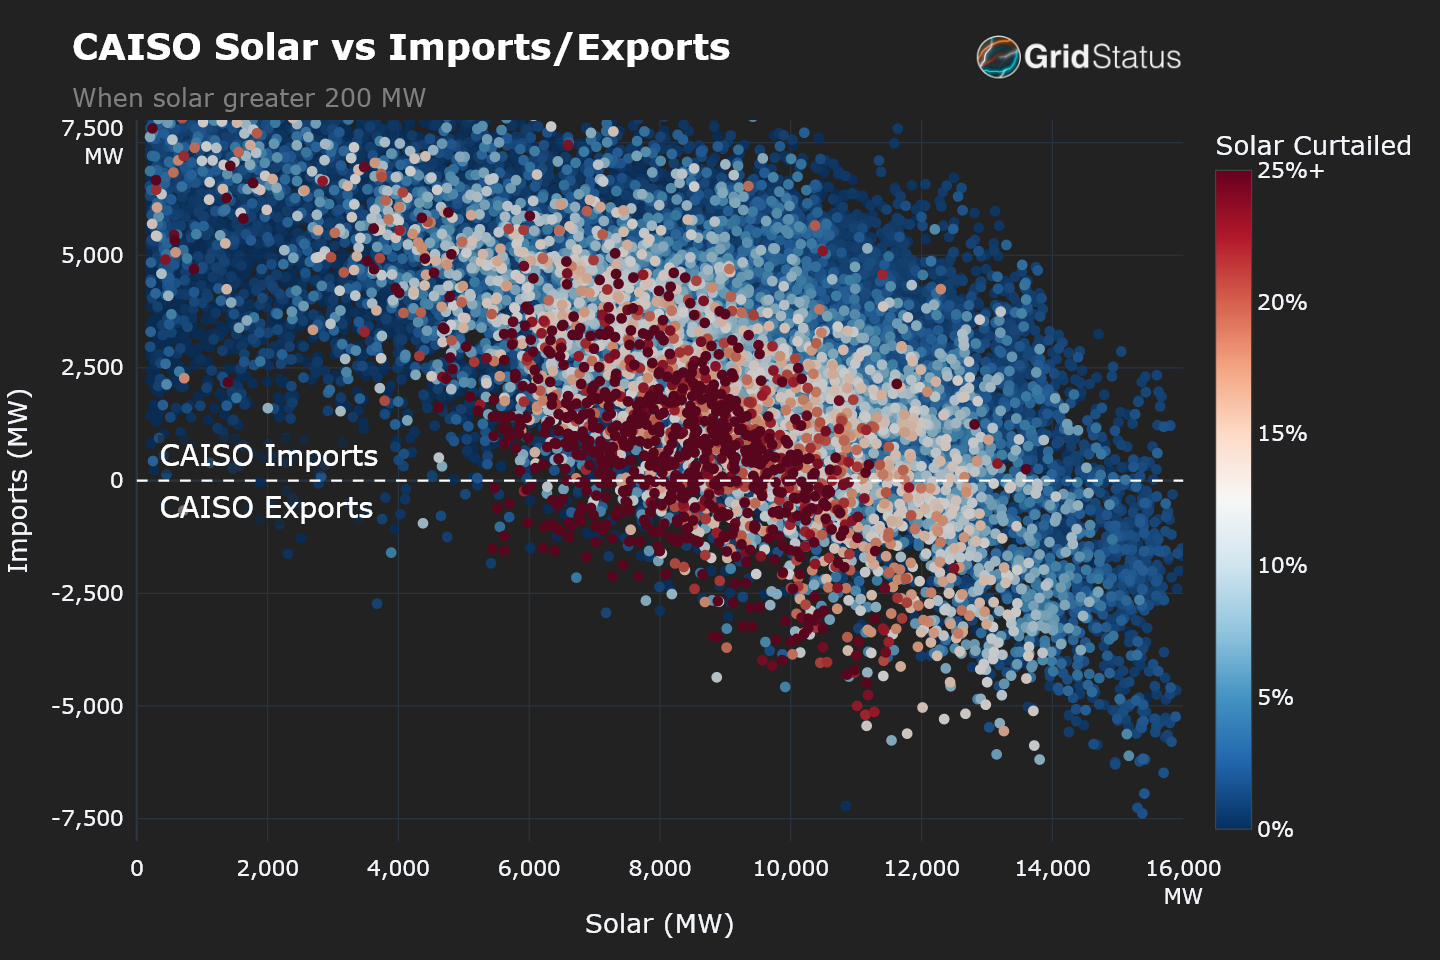
Here, we see the relationship between interchange, solar generation, and curtailment in CAISO. A few things stick out
- The area near zero on the interchange axis implies low demand for CAISO solar generation, either internally or throughout the region.
- The higher periods of curtailment are clustered in the middle of the figure because curtailment is correlated with lower demand, either in CAISO or regionally.
- The bottom right quadrant has relatively little curtailment, despite very high solar generation, because there is a strong enough regional demand for generation
- Conversely, we see slightly more curtailment (in terms of %) in the upper left, despite lower solar. This is likely related to individually odd hours or congested conditions where the high level of imports creates a more difficult-to-manage topology.
When generation exceeds demand, instability may occur. In such cases, curtailment of renewables is often required to balance out the system and may even be preferred in a policy environment that prefers a highly renewable resource mix.
It is tempting to conclude that any additional load while there is curtailment would have zero marginal emissions because it would not actually require more fossil fuel generation. However, in the next two sections, we will explain how not all curtailment is caused by insufficient load.
Transmission Congestion in Texas
Utility-scale renewables often depend on transmission lines to allow electricity to flow from where it is generated to where it is needed. When transmission bottlenecks arise, the system operator may have to curtail generation from certain sources to ensure grid stability.
No place is a better example of this dynamic than Texas, where disparities between the geographic locations of renewables and load can cause ERCOT to experience particularly expensive curtailment due to transmission constraints. Transmission bottlenecks can take a few different forms, but the two most common are thermal constraints, where the line will quite literally melt past certain limits, and voltage constraints related to electrical balancing.
The map below shows the location of solar and wind units in ERCOT as they are curtailed throughout a day in April of this year. The circles and squares are proportionally sized by facility nameplate capacity, while the color shows an approximation of total facility curtailment.
The curtailment data from ERCOT is not perfectly clean (you may notice some solar blips overnight) as ERCOT does not report curtailment directly. Instead, it can be calculated via the 60-day SCED data using the difference of basepoint and high sustained limit (HSL), which may be subject to occasional operator errors in submission.
A subset of 345kV transmission lines and major metropolitan areas are also overlaid to give a sense of scale and location - most of the curtailed generation isn’t particularly close to the Austin-Dallas-Houston triangle and therein lies much of the operational issue in ERCOT today. To put it in perspective, some of those curtailed western resources are closer (as the crow flies) to all of Albuquerque, Phoenix, and Oklahoma City, but cannot flow towards those load centers due to ERCOT’s isolationist tendencies.
When transmission constraints cause generator output to be “bottled up” in a given area, power prices in that area fall due to the congestion component of the LMP. Prices fall because that constrained generation is less valuable to the system.
Today, solar and wind generators have the capability to modulate their output, but market-based curtailment events still rely on the actual bids of generators. Due to the unique economics of wind and solar plants (e.g., not having neither minimum generating levels nor heat rate variations over their output curve) they often have fewer points in their bid curves compared to traditional dispatchable generation, which can result in curtailment approaching complete facility capacity more often than may be needed.
In a sense, the system-wide grid balancing of the CAISO example becomes localized in ERCOT due to local pockets of imbalance supply and demand, which are exacerbated by resistance against interconnection with neighboring regions.
The Market Mechanisms of Curtailment in ERCOT
Internal congestion in ERCOT is prevalent enough to have prompted the creation of several internal interfaces known as Generic Transmission Constraints (GTCs). Think of GTCs as specific bundles of transmission lines allowing power to flow from one region to another. In addition to assessing a single line’s physical capabilities, ERCOT also packages these lines together with an overall transfer limitation value which affects market clearing and operations. When individual lines bind, the bottled up generation tends to be relatively small, with only a handful of facilities exposed to curtailment risk. When a GTC binds, entire regions of solar and wind may be forced to curtail.
The combination of very low bids and binary off/on operations tends to mean that wind and solar facilities will not curtail until prices are already much lower than profitable for traditional generators.
We can look at this in ERCOT through the 60 day SCED data as well, this time by visualizing the bids of various generators. First, we have a look at the West zone on April 18th, a shoulder season day with relatively high levels of curtailment.
There’s a lot going on in this figure, so let’s break it down:
- The colored bar curve is the bid stack for energy in the West zone at each 15 minute interval. Each bar is an individual price-MW pair from a resource, the width of the bar is determined by the MW amount, while the y-value is the $/MWh, excluding any start-up costs.
- As resources are curtailed or otherwise unavailable the bars become transparent - these are the gaps in the stack.
- The white and red dashed lines together represent the combined ability of the west load zone to utilize generation whether through internal demand or export to the rest of ERCOT. These move each hour as load in the west changes. The white line is hourly load, while the red represents the additional MW of the GTC which ERCOT monitors to manage flows between the West zone and the rest of ERCOT.
- The curtailment numbers in the middle of the figure show instantaneous curtailed capacity for wind and solar resources in each interval.
- Next to each legend entry is the zonal weighted average of energy bids for the interval from each resource type for that interval. This is across all bids - not just cleared.
- The teal line is the Settlement Point Price, or SPP, for the interval, which is also updated at the top of the figure, underneath the title. We use the LZ West price which is representative of, but not exactly, the SPP at each generator on the graph.
With that understanding in place, what does this figure tell us about curtailment in ERCOT?
- For one, there is a lot of solar and wind in the western region of ERCOT, and a significant chunk of it can’t actually be exported reliably.
- Wind tends to bid lower than solar, so without any local constraints solar would always be curtailed first.
- The regional load barely budges over the course of a day. Unlike the diurnal cycle of residential and commercial load, western Texas is dominated by extractive industries and their supporting infrastructure, generally running 24/7.
- Generators with very low bids in the west are curtailed due localized congestion within west texas, which can be more impactful than the GTC.
But how do other regions in ERCOT compare? Let’s look at the load zone around Houston
Houston is an interesting counterpoint to the west; it has much less generation, although a substantially larger dispatchable fleet, and higher demand (over 20 GW at summer peak, meaning it has greater internal demand than supply), with substantially more intra-day variability than West Texas. Prices are almost always higher, never reaching the $0 or the negative prices seen in the previous figure, and curtailment of the limited solar and wind resource is nonexistent. The Houston zone is closer to a traditional grid that hasn’t undergone much transition towards renewables.
In an ideal world, the Houston Zone would be a nice complement to the West Zone; as a load sink on typical days and dispatchable generation source during lulls in wind and solar production. Unfortunately, the intervening topology contains a number of internal constraints, creating islands within ERCOT that reflect its larger isolated status.
While the transmission buildout to enable a fully interconnected ERCOT, and even continental US, is the dream of many grid advocates, there are still likely to be situations where curtailment is the more economically efficient solution when compared to low use transmission.
Dispatchable yet inflexible generation in Southwest Power Pool
SPP is the third and final member of our curtailment trio and presents another market dynamic that leads to curtailment, self-scheduling.
Rather than the price-sensitive bidding we expect from the merit order concept, self-scheduled units become price takers. Typically, they make this choice for operational reasons - startup and shutdown times, minimum generation levels, and more (see callout), but this operational choice can have a distortionary effect on the market as a whole. When these units are kept online regardless of the bid stack it can lead to curtailment of other resources.
Reasons for Generation Inflexibility (click to open)
Inflexibility in Ramping: Some generators, particularly traditional ones like coal and nuclear plants, can't ramp up or down quickly. If there's a sudden increase in supply from variable sources like wind and solar or a sudden drop in demand, these inflexible generators might not be able to adjust in time. This can lead to situations where excess generation is present, leading to curtailment of the flexible resources.
Minimum Generation Levels: Some traditional generators have minimum output levels they need to maintain for operational or economic reasons. If the demand drops below this level and these generators can't reduce their output it might necessitate curtailment of other, more flexible resources to maintain the balance of supply and demand.
Start-Up and Shut-Down Times: Traditional generators might have long start-up and shut-down times. This can make it challenging to adapt to rapidly changing grid conditions, especially with increased renewable penetration, which can be variable.
Economic Considerations: At times, it might be more economically viable to curtail flexible resources (like wind or solar) than to reduce the output of a large inflexible generator, especially if there are costs associated with ramping down or shutting off that generator.
Additional Operational Constraints: Inflexible generators might have specific operational requirements or constraints, such as the need for scheduled maintenance. These constraints can influence decisions around which resources to curtail in given situations.
SPP has a significant amount of self-scheduling, particularly from its coal fleet, as well the most curtailment of all US ISOs.
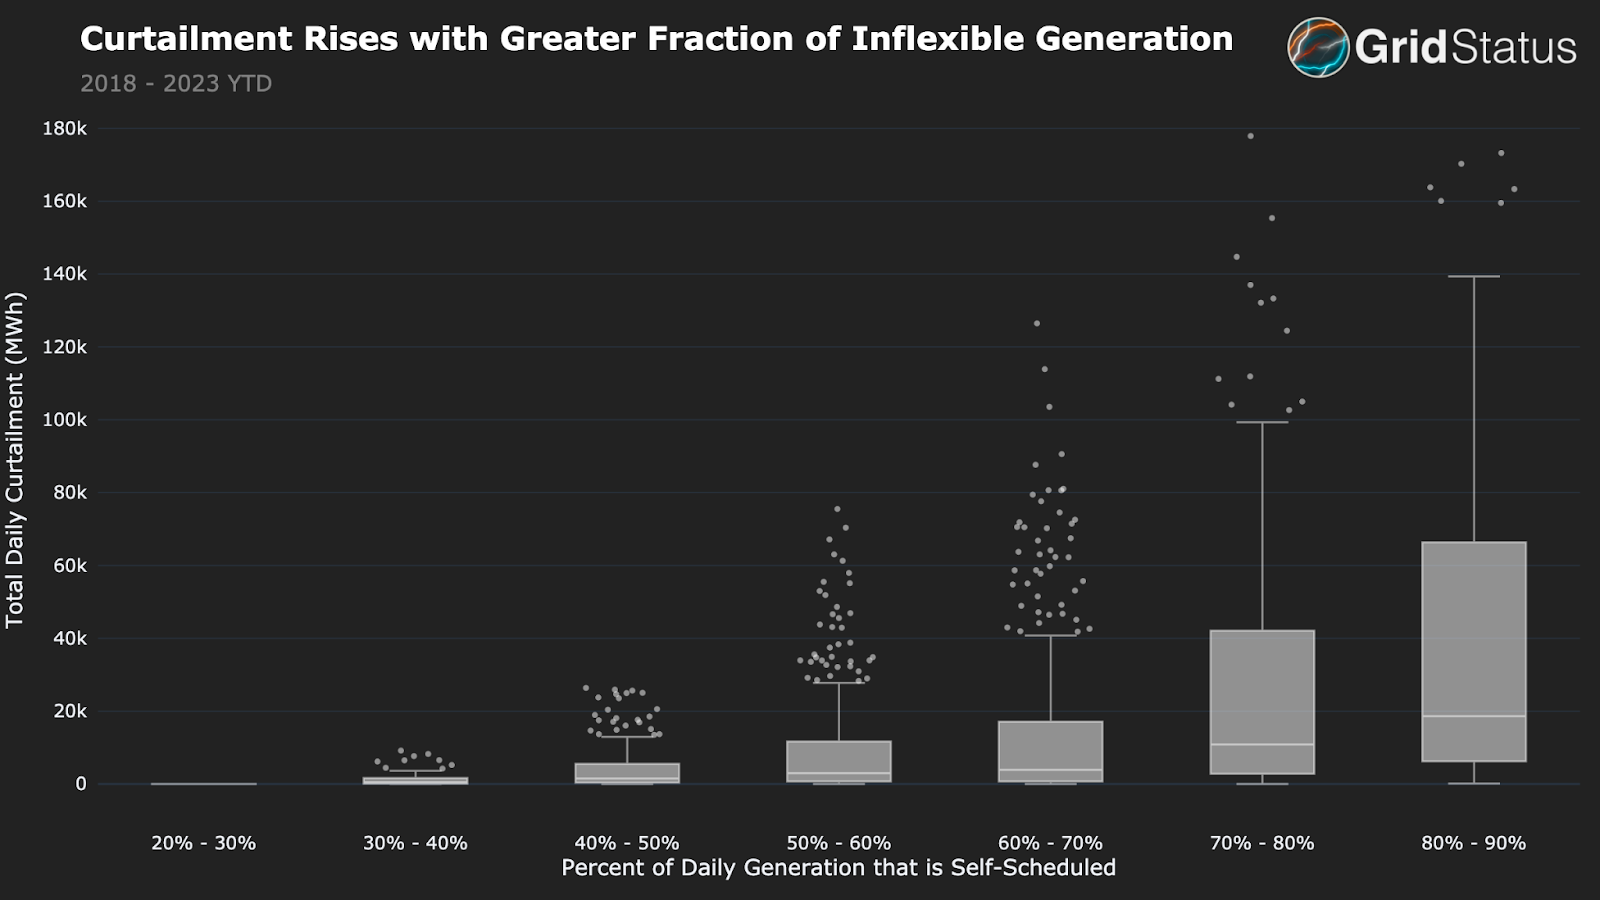
Above, the figure shows a clear trend of increasing curtailment alongside self-scheduling. In systems dominated by inflexible generation, the introduction of significant renewable energy can lead to higher levels of curtailment, particularly during periods of high renewable output and low demand. In SPP, these issues are further exacerbated by the correlated nature of its wind resource, leading to alignment in flows from the sparse west towards eastern load centers. On a particularly windy day with low load and a high amount of self-scheduling, curtailment may be required across a large swathe of the Great Plains all at once.
We can take a deeper dive by looking at curtailment against self-scheduled generation for each month.
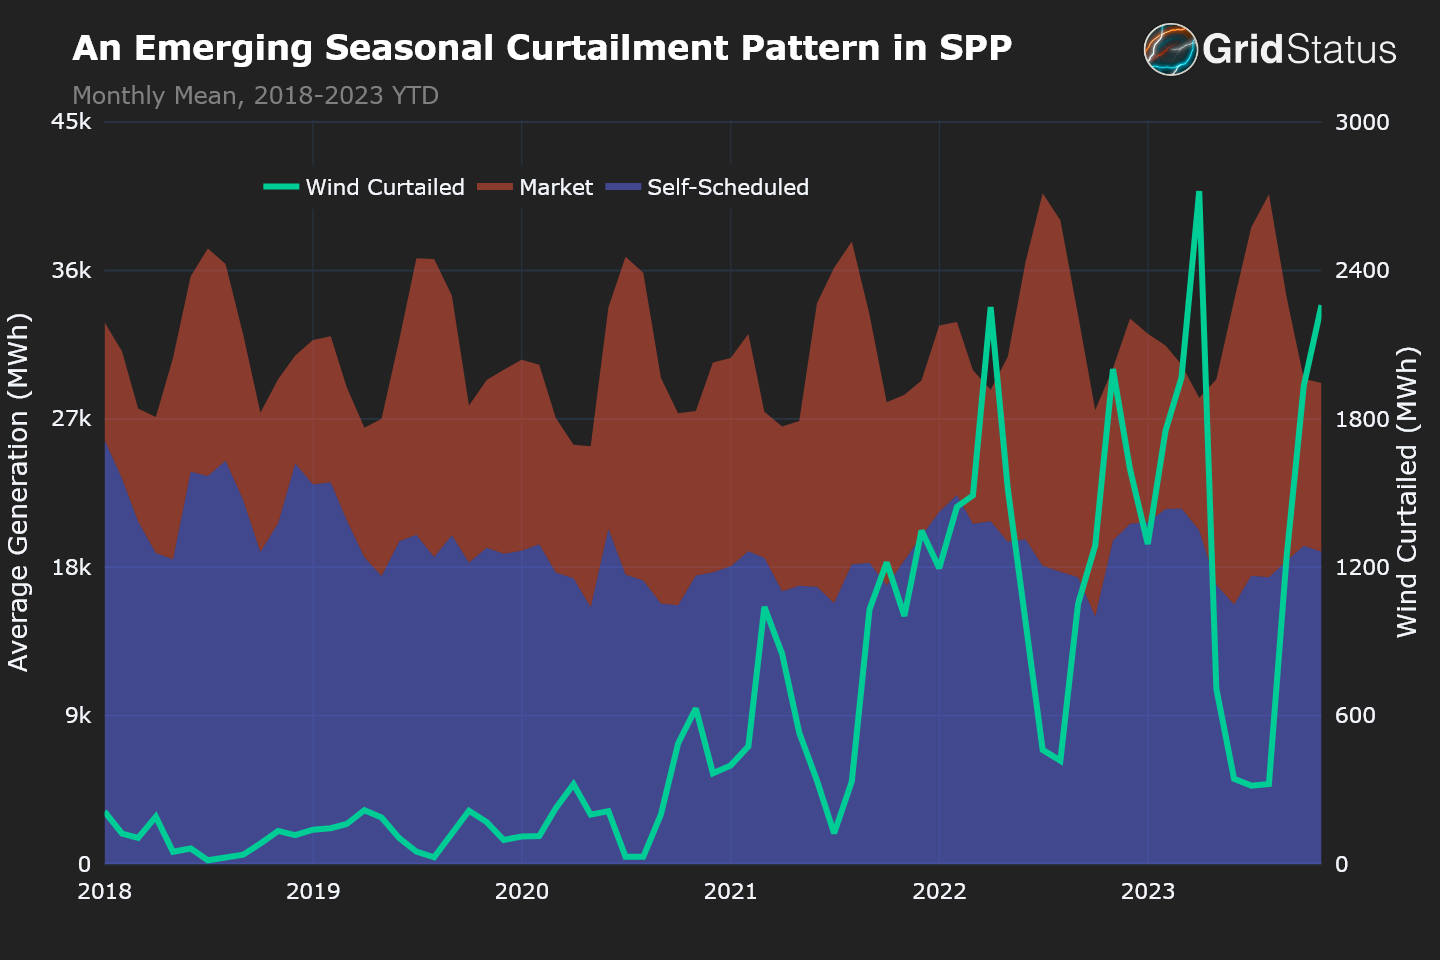
SPP’s curtailment and self-scheduling has had a seasonal cyclicity in recent years.
The last few years have seen a particularly large amount of curtailment in SPP (which has vastly more installed wind capacity than solar, hence the exclusionary focus), as well as the emergence of a clear seasonal trend.
Curtailment tends to spike during the lower load winter months and decline during the summer. This is not a benign trend for wind, which is at its most consistent in the winter. Not only do heavy winter curtailments reduce daily energy revenues, they may influence resource adequacy (RA) calculations and capacity accreditation, an actively evolving topic in SPP, degrading the RA revenue stream for wind. Recent winter events have had a deleterious impact on the bottom line of some dispatchable generators in SPP, possibly contributing to the trend of increased winter self-scheduling. Taken together, the higher winter capacity factor for wind interacts poorly with self-scheduling, leading to the increased curtailment seen above.
In the context of increasing renewable energy integration, a generator’s ability to respond to market signals becomes a crucial factor. Systems with a higher percentage of flexible resources (like natural gas peaker plants or battery storage) can more easily accommodate the variable nature of renewables without resorting to curtailment.
When less is more: a deeper look into congestion
We spoke earlier about how congestion is a key driver of curtailment, but felt it deserved a deeper review. Here is an explanation, created with the expertise and help of Dr. Kyri Baker, who leads the GRIFFIN lab at the University of Colorado Boulder.
- Dr. Kyri Baker
In electric power systems, congestion occurs when the demand for electricity exceeds the transmission system's ability to transfer power from generators to consumers in the most cost effective manner. Managing congestion and finding the optimal generation dispatch to minimize costs while satisfying the physical constraints of the network is a key aspect of power systems operations.
Below is a simple 3 bus case to help better explain the phenomenon described in both the ERCOT and SPP sections in more detail.
Full Solving Discussion (click to open)
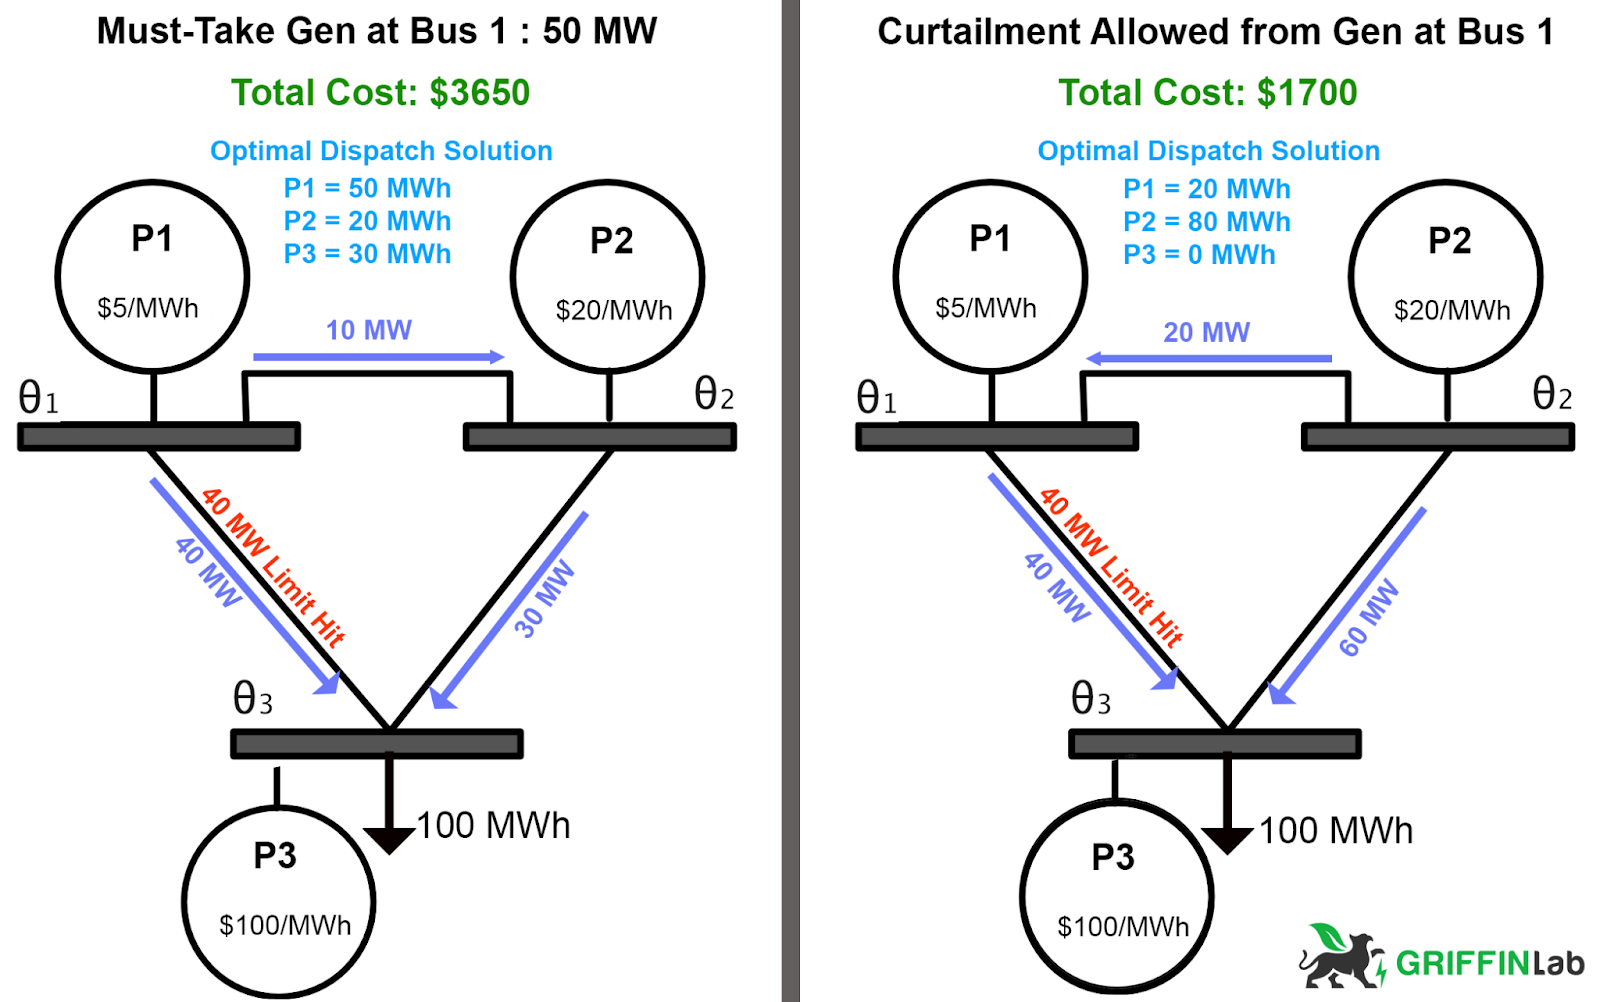
In this example the line between buses 1 and 3 is constrained to 40 MW. There are three generators: a cheap one ($5/MWh) at bus 1; a medium one ($20/MWh) at bus 2; and an expensive one ($100/MWh at bus 3). There's one load at bus 3 of 100 MWh.
Congestion occurs in both cases. However, in the left case the congestion cost is greater when curtailment is not allowed from the "must-take" generator, shown on the left case, which can be seen conceptually as a self scheduled generation. This can be seen in ‘total cost’. The SPP curtailment discussed above is a real-life example of this phenomenon.
The right-hand solution is much cheaper for consumers but actually results in lower production from the cheapest generator, at bus P1. It would be economically efficient to curtail generation from this facility at a much lower price than shown. The ERCOT curtailment discussed above is a real-life example of this phenomenon.
Left Case: the cheap generator produces 50 MW (e.g. its dispatch level is not a variable in the optimization) and the network has to take it. This forces weird flows - because the line from 1-3 can only take 40 MW, the other 10 from P1 has to go somewhere. Thus, it forces the flow on line 1-2 to go from left to right. Power flows from high voltage to low voltage, which means that this forces the voltage angle variable theta1 to be greater than theta2. However, theta1 can't be too big because it's constrained by the flow limit on 1-3.
Theta2 then has to be even smaller and must be small enough such that 10 MW can flow from bus 1 to 2. Unfortunately, this means that P2 can't send enough power alone to satisfy the rest of the load at bus 3, because the voltage angle difference between buses 2 and 3 can't be big enough given the constraints on theta2. Thus the rest of the power must come from the expensive generator at bus 3, raising system costs to $3650.
Right Case: I allowed P1 <= 50 in the optimization rather than P1 == 50. The optimal solution then becomes P1 = 20, meaning it curtailed 30 MW voluntarily to reduce system costs. This allows the network to only deliver power from generators 1 and 2 and avoid using the expensive generator 3. The overall cost for this hour is thus $1700.
Conclusion
While we discussed reasons for and outcomes from curtailment above, there is still much discussion to be had on solutions. Despite its prevalence, questions pertaining to curtailment still loom large. Are existing market structures sufficient to handle $0 input cost units? How do we match traditional load centers with newly distant energy resources? What is the value of regional interconnectivity? How should operators manage and communicate system bottlenecks? And perhaps at the root of all of these: what is the “correct” grid resource mix?
In truth, the correct resource mix is whatever society has decided it should be. In California this is generally guided by explicit state policy and support, while in Texas the state policy decisions are no less explicit, but the market-driven focus leads in different directions. Like congestion, curtailment is likely to be a fact of life for renewable operators for the foreseeable future.
At Grid Status, we hope to provide frictionless data access and analytical support for investors, asset operators, grid managers, policymakers and the broader energy ecosystem to make well-informed and thoughtful choices in this rapidly evolving space.
We are nearing the launch of exciting new dashboarding and alerting features on Grid Status. To be notified when they are released, sign up for our wait list here. We take feedback into account when prioritizing our roadmap, so please feel free to reach out on Twitter, LinkedIn, or through email.
This post is supported by funding from GridLab.
Updated Nov 29, 2023: An earlier version of this post stated, "Because wind and solar units are generally unable to moderate their output without entirely shutting down, curtailment of units occurs." It has been updated to reflect that solar and wind generators have the capability to modulate their output, with more details on how this relates to market-based curtailment events.