Early Season Heat Stressed The Eastern Interconnection
PJM, NYISO, ISO-NE, and IESO exceeded last summer's peak demand, and did so before July. With load climbing beyond forecast, we break down how each region responded and navigated this record-breaking early-season heat event.


This past week, a massive portion of the Eastern Interconnection experienced one of the strongest heat waves in recent memory. Surging cooling demand complicated the fundamental task of grid operators, matching supply and demand, driving fireworks across the East Coast the week before the Fourth of July.
This challenge was made all the more difficult as the specific regional systems in question are in the middle of several transitions, including a wave of thermal retirements, data center-driven load growth, and a large uptick in solar generation, but have yet to see results from interconnection queue reform and have nearly none of the energy storage capacity that supports CAISO and ERCOT.
We’re taking a look at the forecasts, records, and outcomes from a blistering handful of days—all before the end of June.
The Calm Before the Storm
Well ahead of the actual event, long-range weather models pointed to a combination of high heat and high humidity across the East Coast. Unlike the mercurial nature of winter storms, we tend to be better at forecasting heatwaves, which gives grid operators the confidence to start planning for system stress early.
Here at Grid Status, we were tracking forecasts and identifying where we might see impacts on the grid.
For the former, our newly out-in-beta Forecast Analysis App was in regular rotation to track the evolving load and outage forecasts. Early on it was clear that this event was likely to be no joke as the latest forecast was repeatedly the highest.
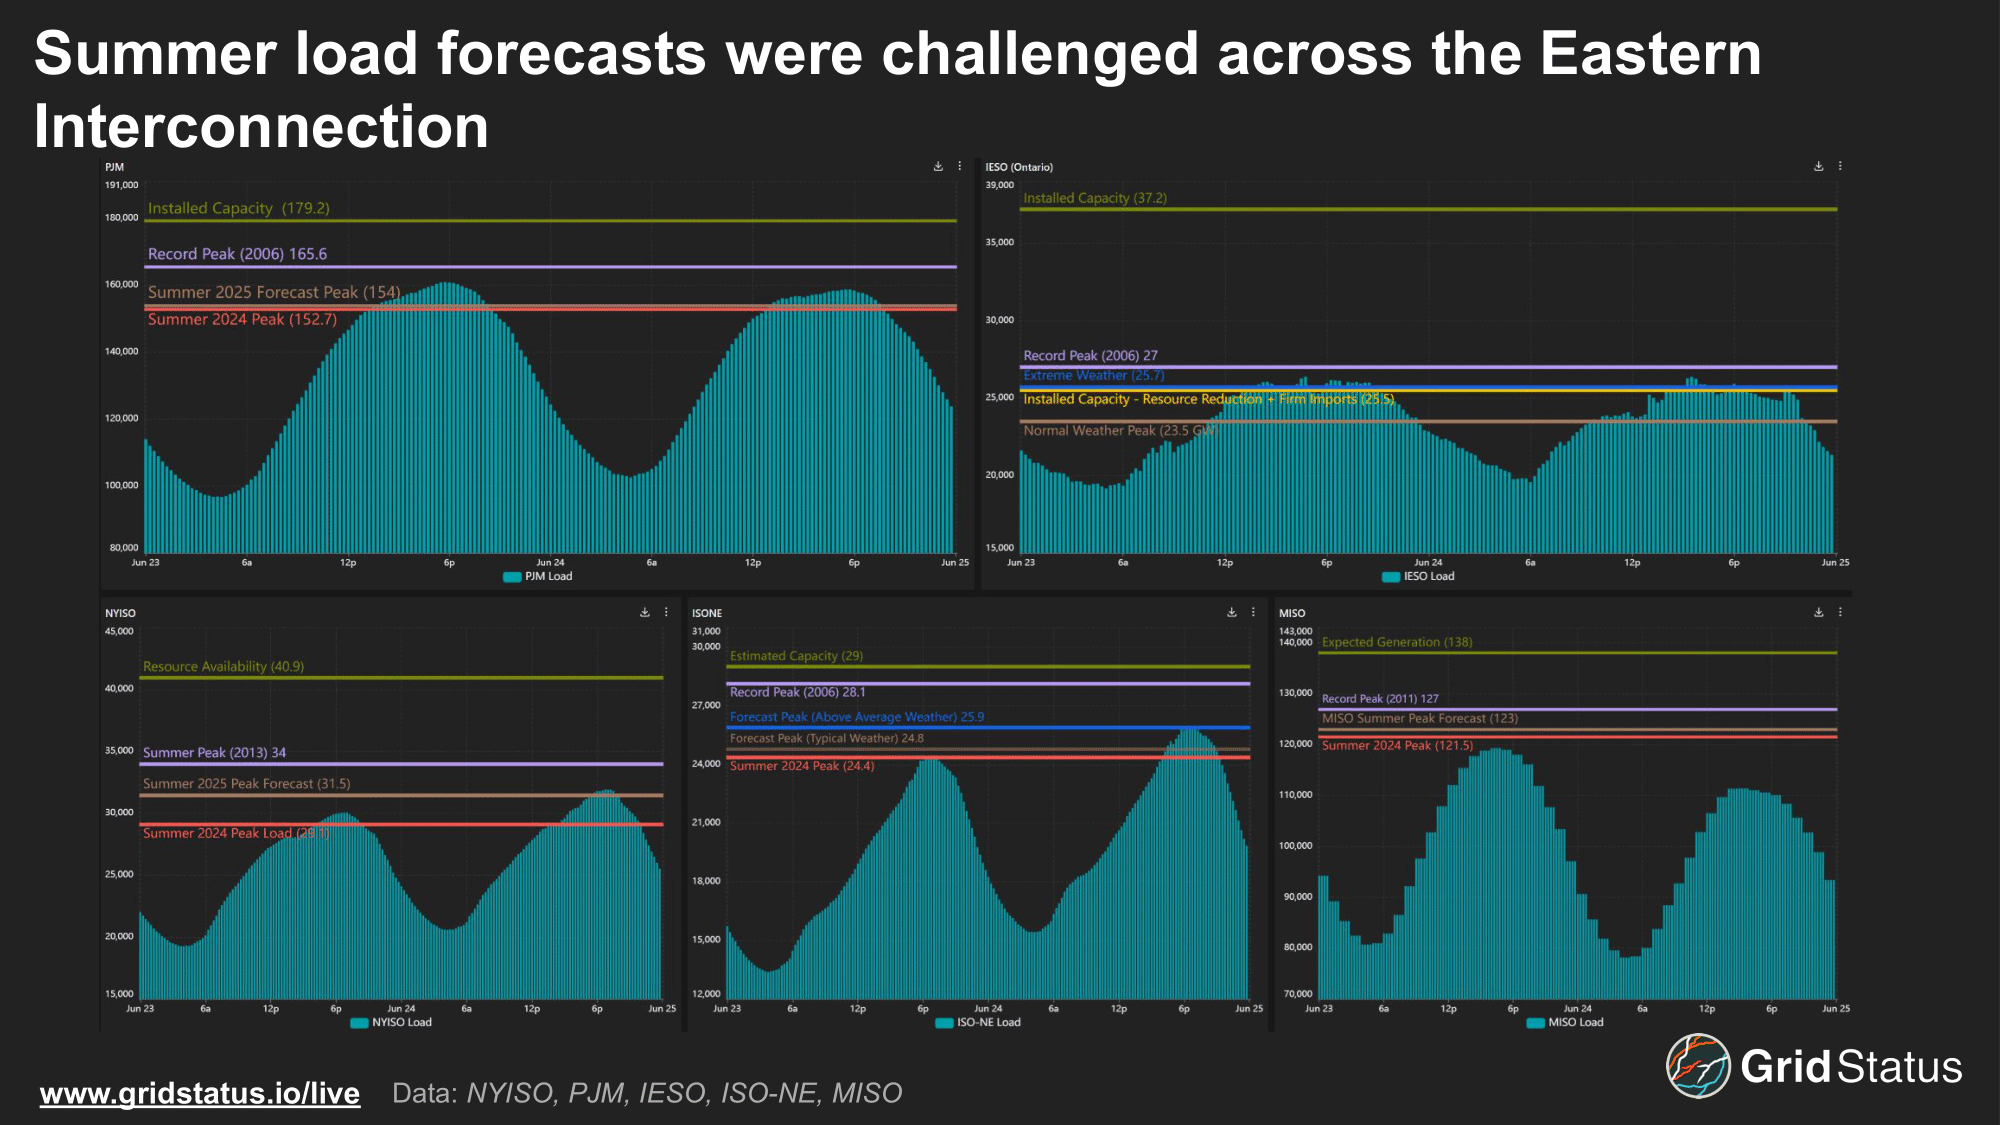
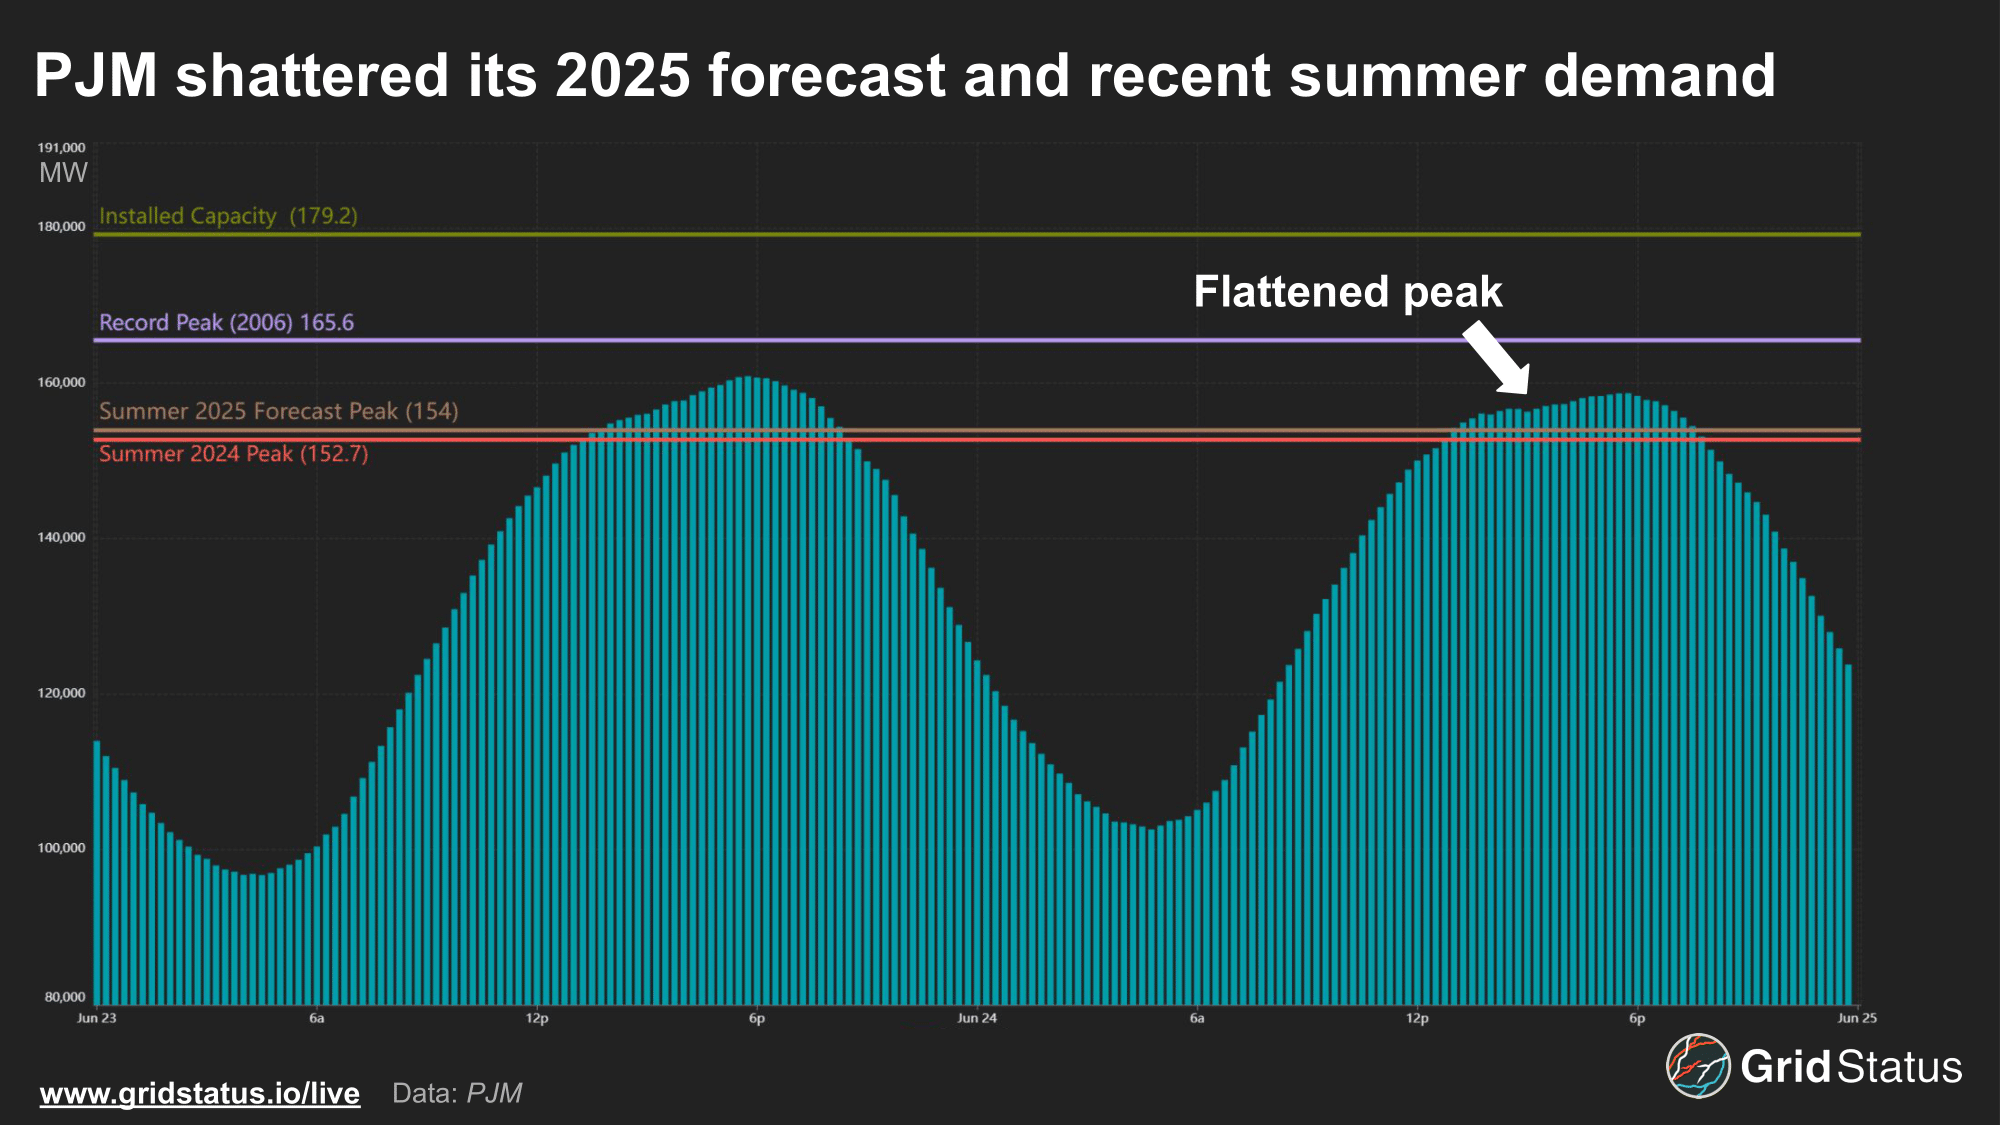
PJM’s first round of forecasts for Monday and Tuesday peaked at 152 GW and 155 GW, respectively, already in line with some of the highest values in the past decade.
This initial Tuesday value even exceeded PJM’s pre-summer peak load forecast of 154 GW and was meaningfully higher than the previous summer’s 152.7 GW peak.
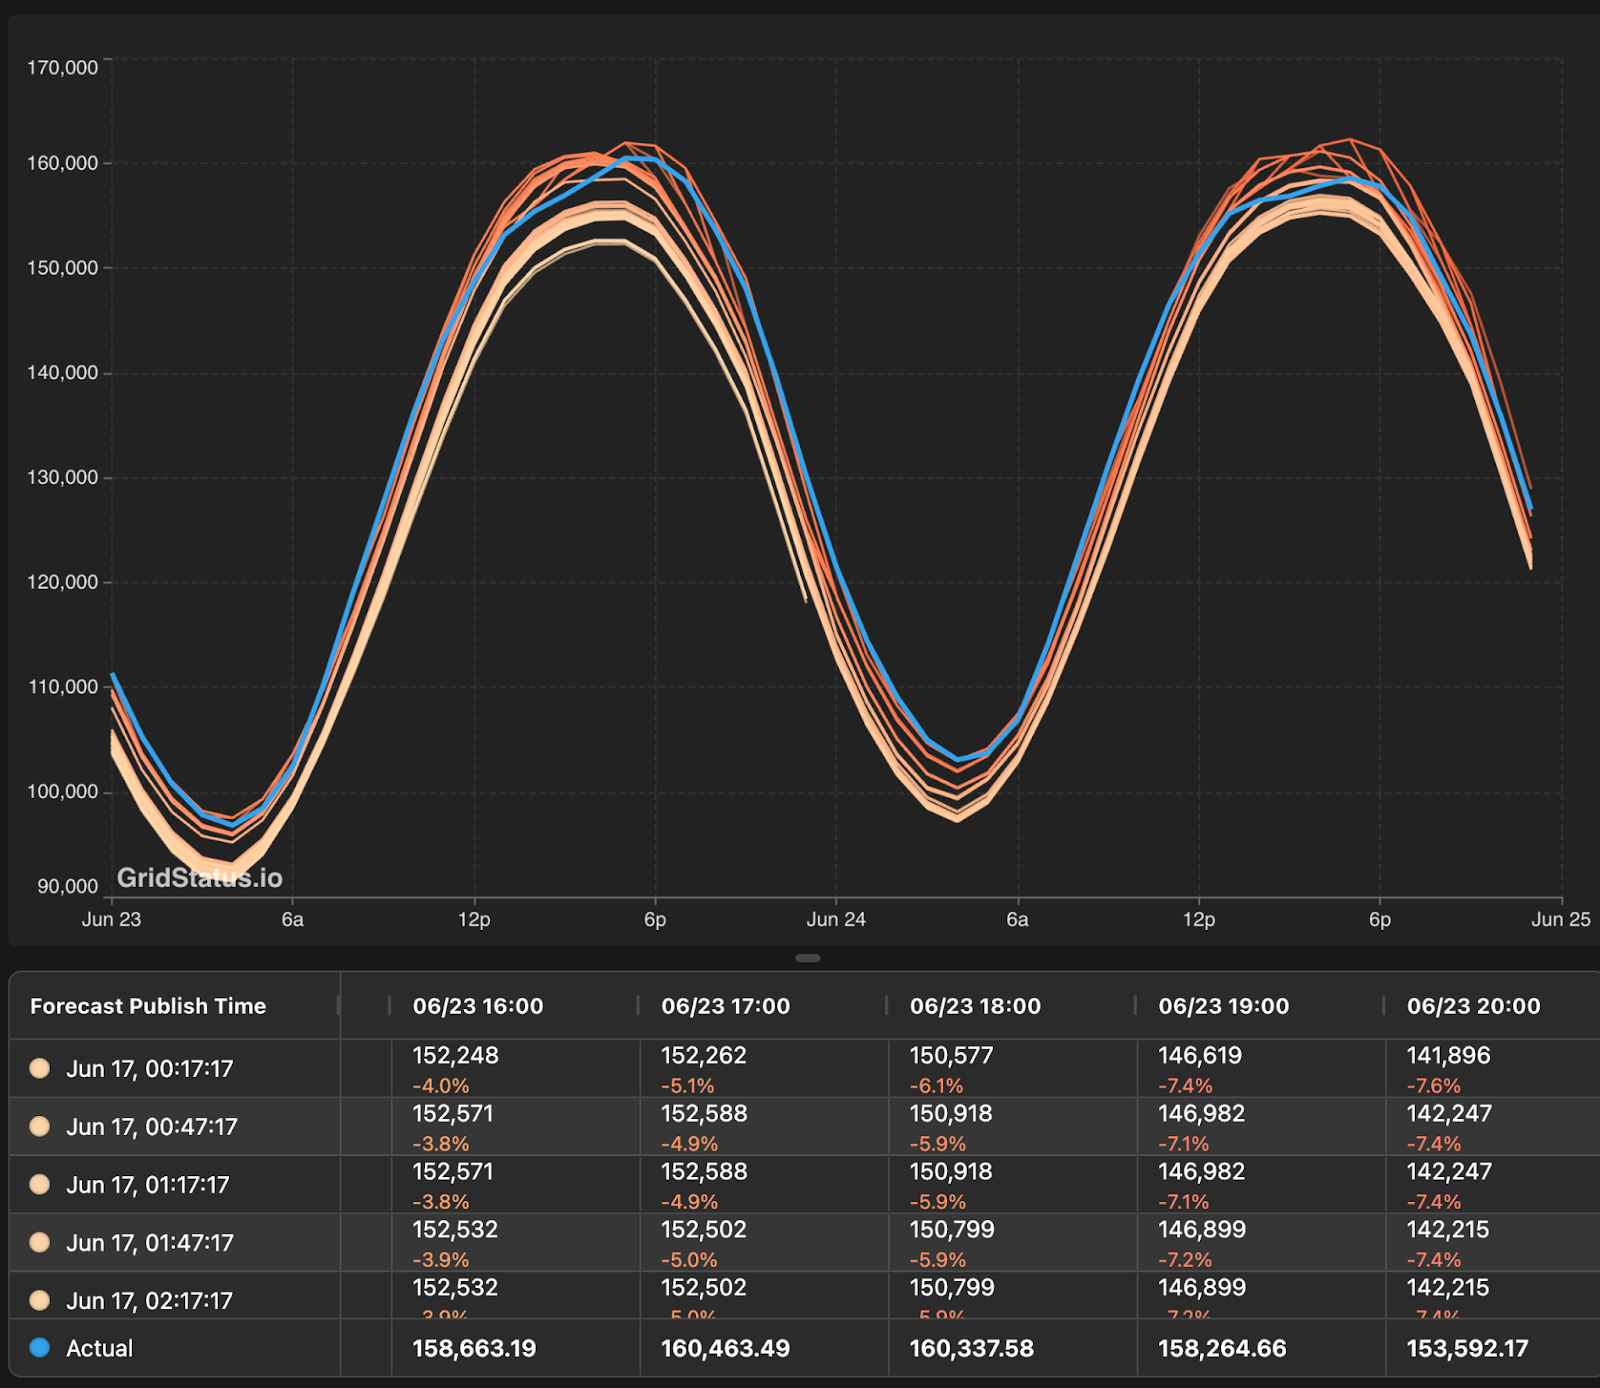
As confidence in the extent of the heat and humidity continued to grow, the magnitude of the peak began to increase. Both Monday and Tuesday saw forecasted peaks exceed 160 GW, ultimately reaching as high as 162 GW on Tuesday, June 24th.
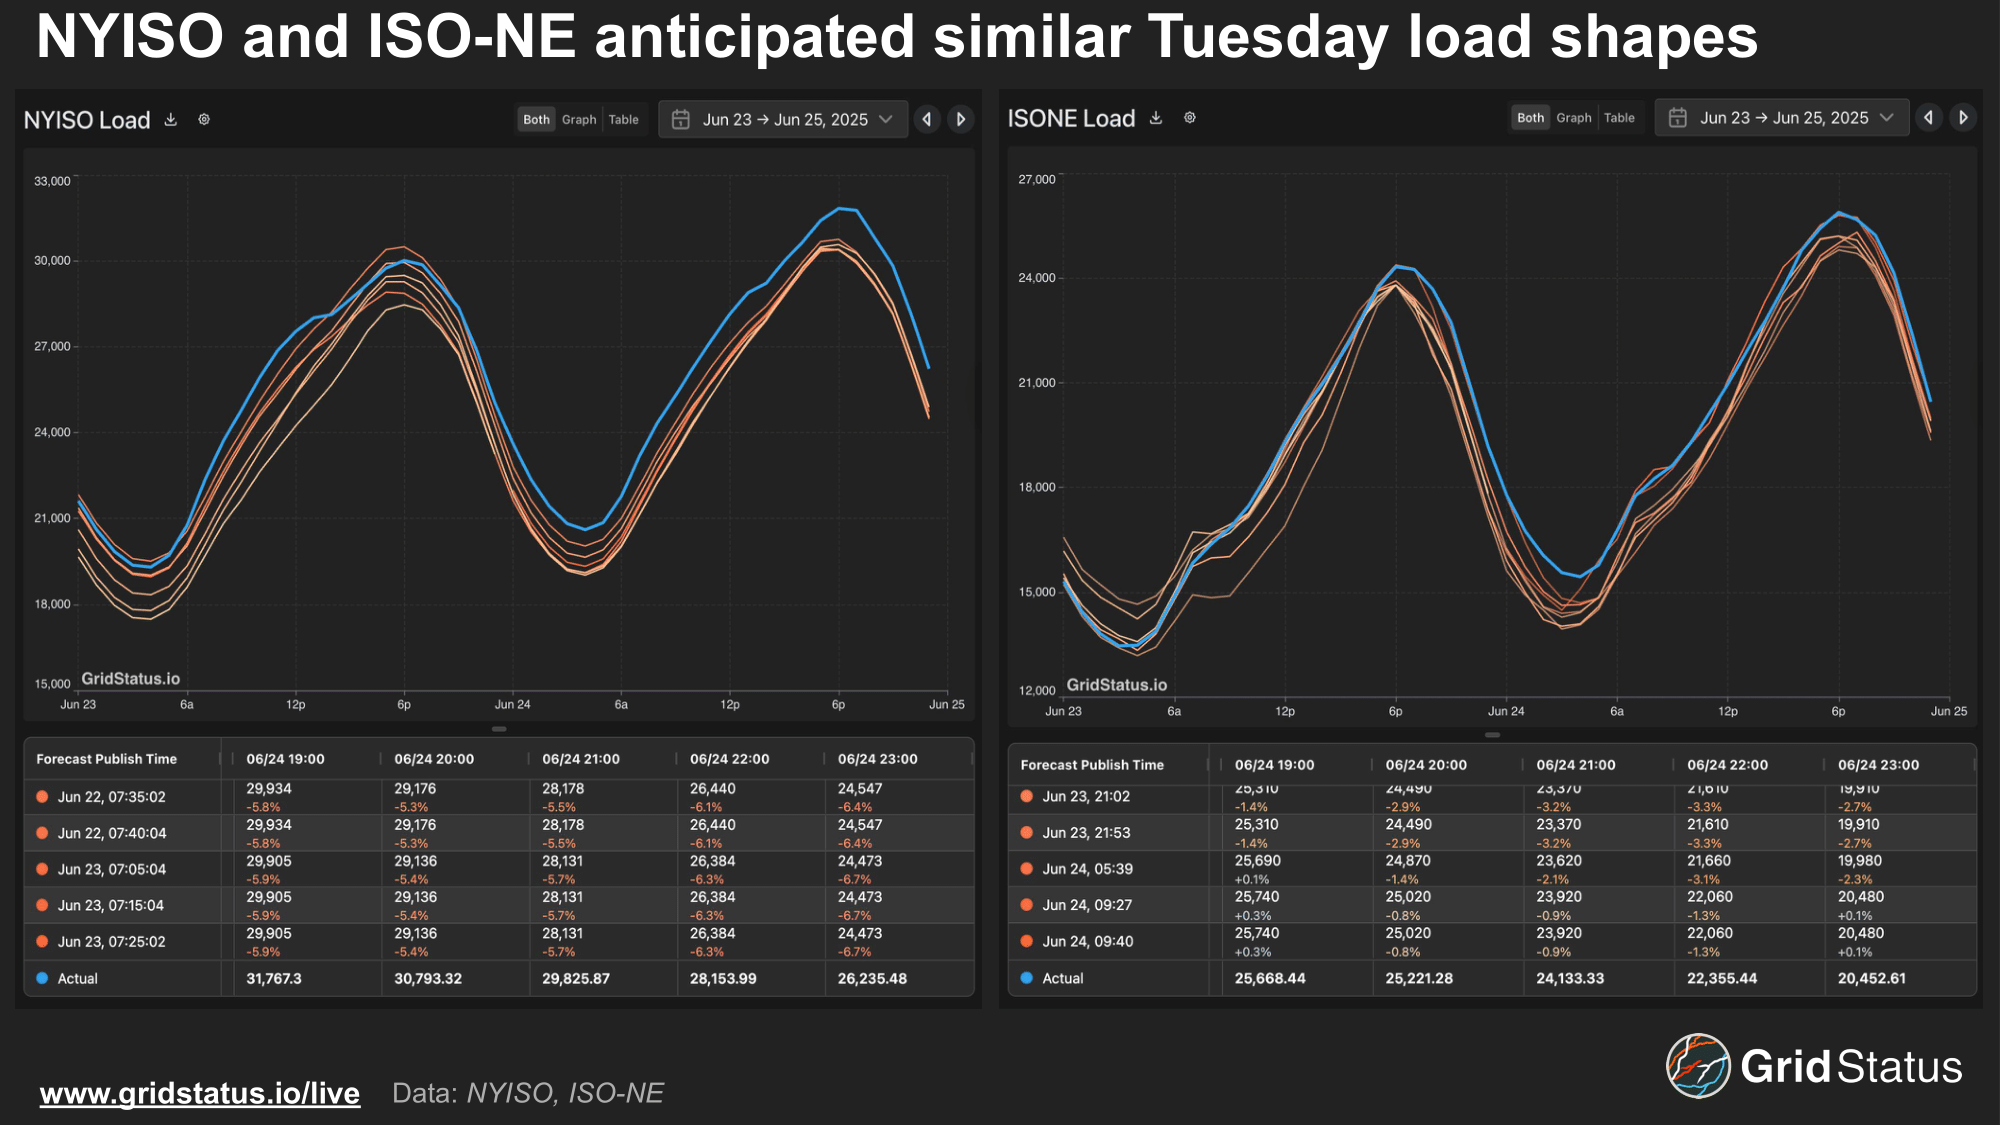
Both NYISO and ISO-NE caught the trend relatively well, too, although the actual load on Tuesday in New York outstripped even the highest forecast by more than 1 GW.
No Reservations
In summer peaking regions, heat waves pose significant challenges as cooling load pushes grids close to their installed capacity. This event came at a challenging time for East Coast grids as thermal capacity has fallen in recent years. At the same time, demand growth has returned.
PJM saw forecasted reserve margins dip to their lowest level in years on Tuesday. Operational reserves fell to 4.1 GW as only 165.2 GW of capacity was scheduled to meet a forecasted load peak of 161.1 GW.
An increase in outages, particularly forced outages, helped to drive such tight reserve margins.
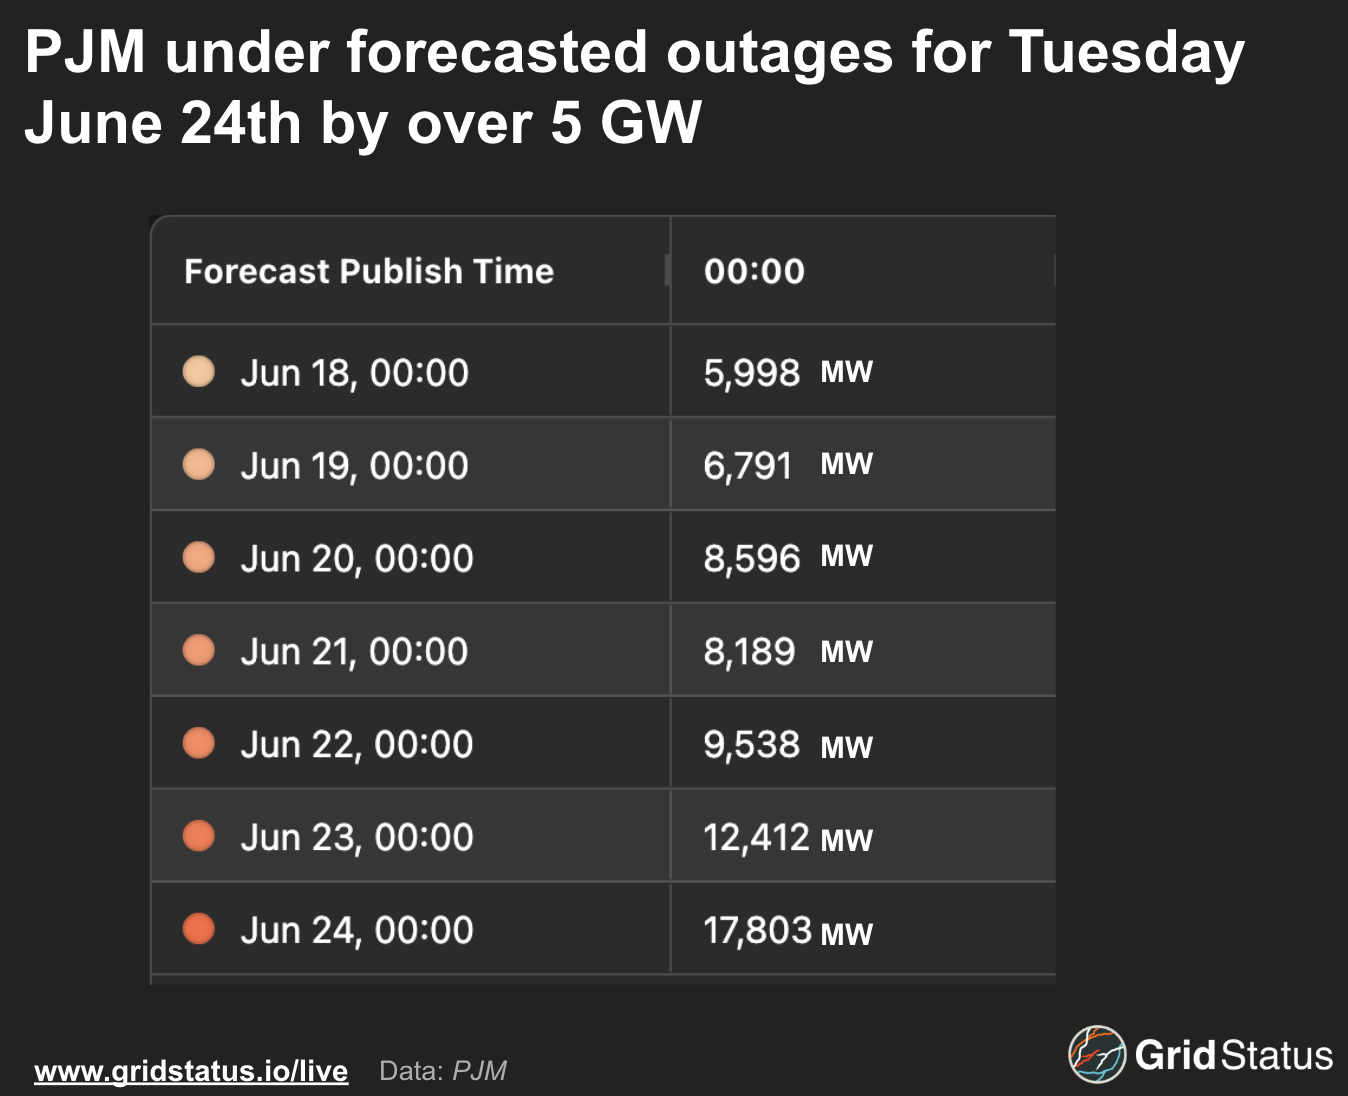
PJM initially projected that outages would fall over 4 GW from June 23 to June 24th, driven largely by a reduction in forced outages. Instead, forced outages increased, and total outages jumped 1.2 GW. The increase in forced outages highlights one of the many challenges that appear during extreme events.
Grid operators often rely on lower-capacity-factor, older units to supply the marginal megawatts for sustained periods, and these units can struggle when asked to perform for longer stretches.
Each day, PJM produces multiple forecasts with projected peak values for the following day, including demand and scheduled capacity. RTO-wide, June 24th had the smallest gap between these values in the last 15 years, indicating near-peak utilization of capacity within PJM.
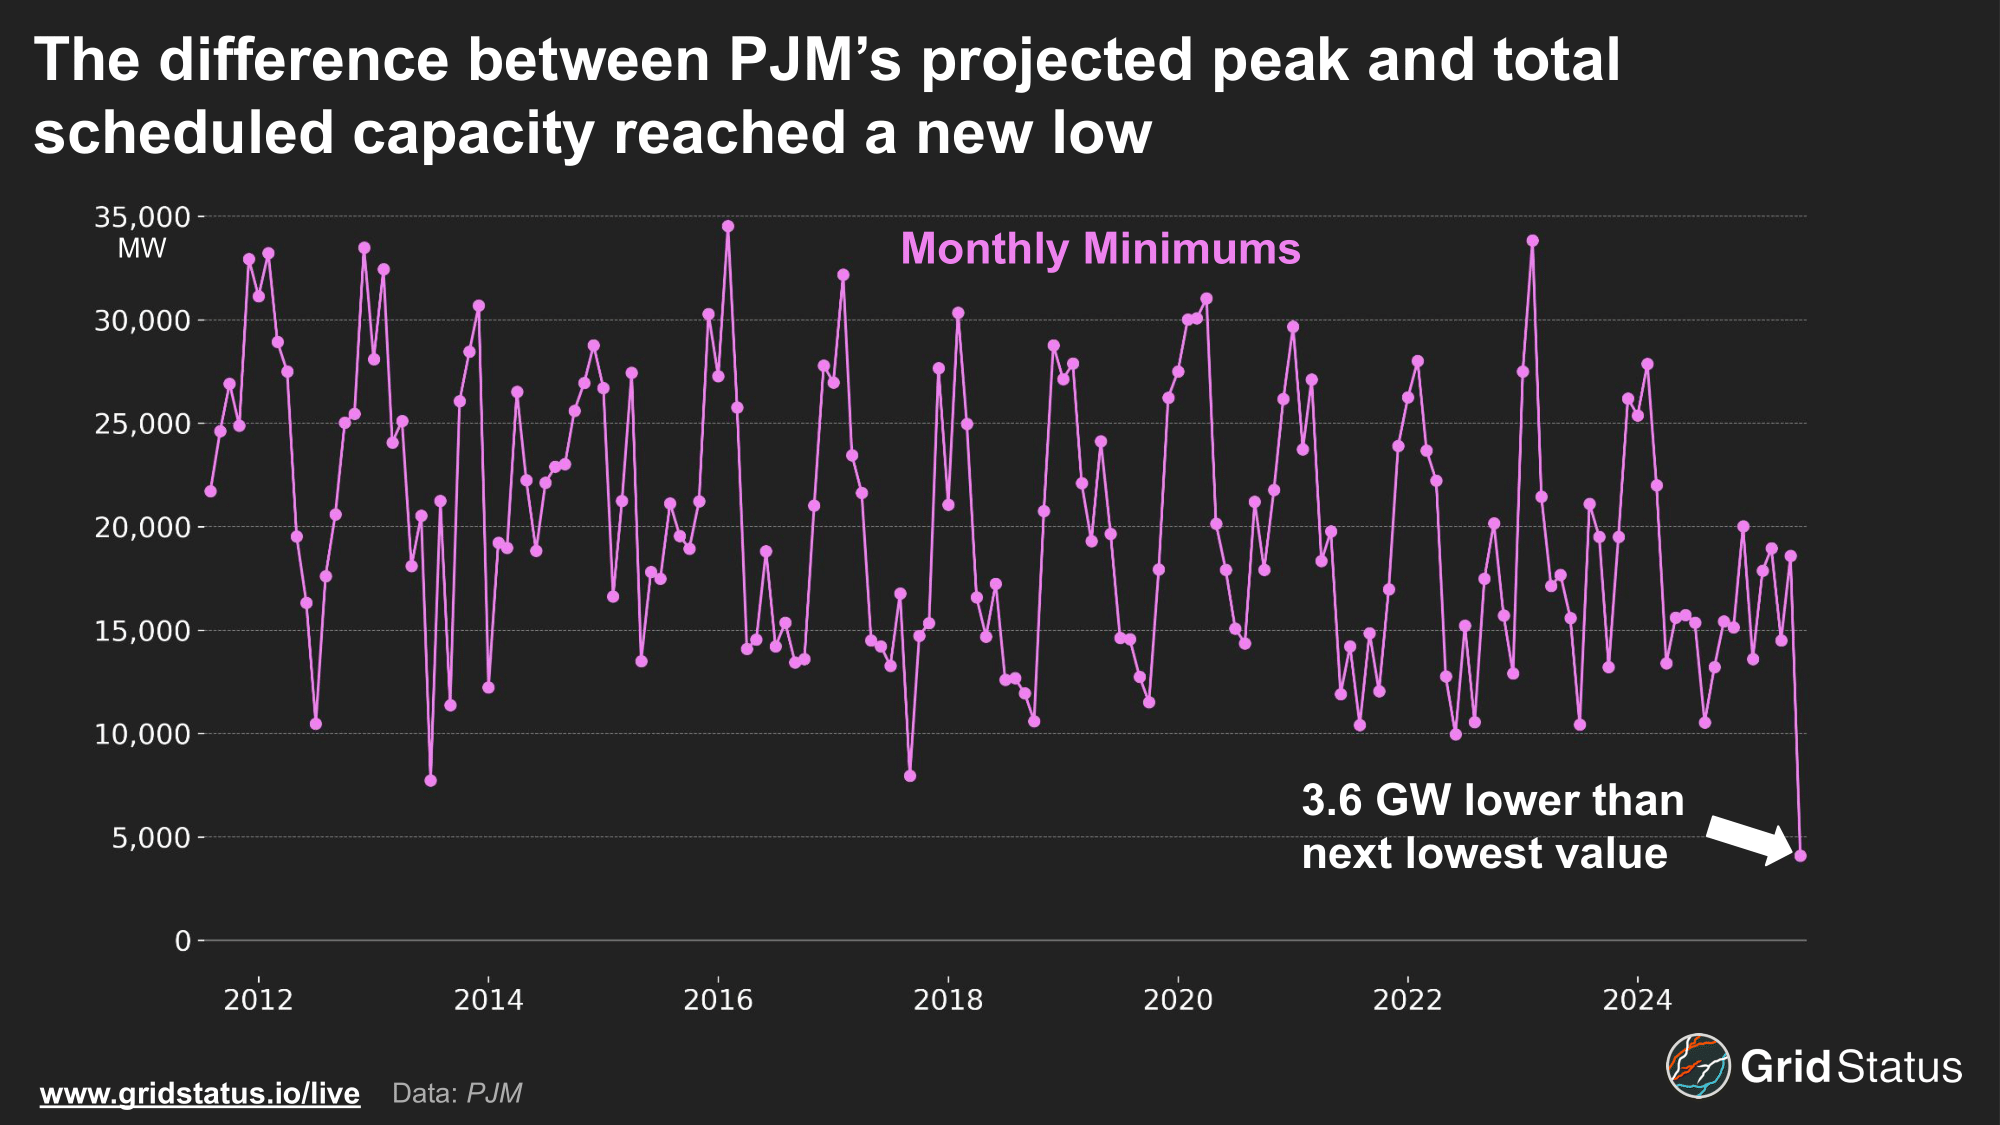
This metric does have a major seasonal caveat: fuel availability. In the winter, generation may be scheduled, but ultimately forced offline due to disruptions in gas supply and an inability to secure spot gas.
Early Summer Days, Deep Summer Demand
Even as PJM hit a 160 GW load peak for the first time since the early 2010s, demand may have reached even higher levels if not for load management actions.
PJM activated demand response programs across the RTO during the event, beginning with calls in 12 zones on Monday, 15 on Tuesday, and 11 on Wednesday. In addition to actions taken directly by PJM, many large load users voluntarily reduced consumption to avoid some of the clearest coincident peak hours in recent memory.
Loads are subject to demand charges from PJM based on consumption during the 5 peak hours. Additional charges are levied by utilities. For example, COMED customers on its hourly pricing rate are charged based on consumption during the 5 PJM CP hours and COMED’s 5 highest hours.
The combination of actions is relatively easy to see, particularly when comparing a mixed residential-industrial region and a more heavily residential zone.
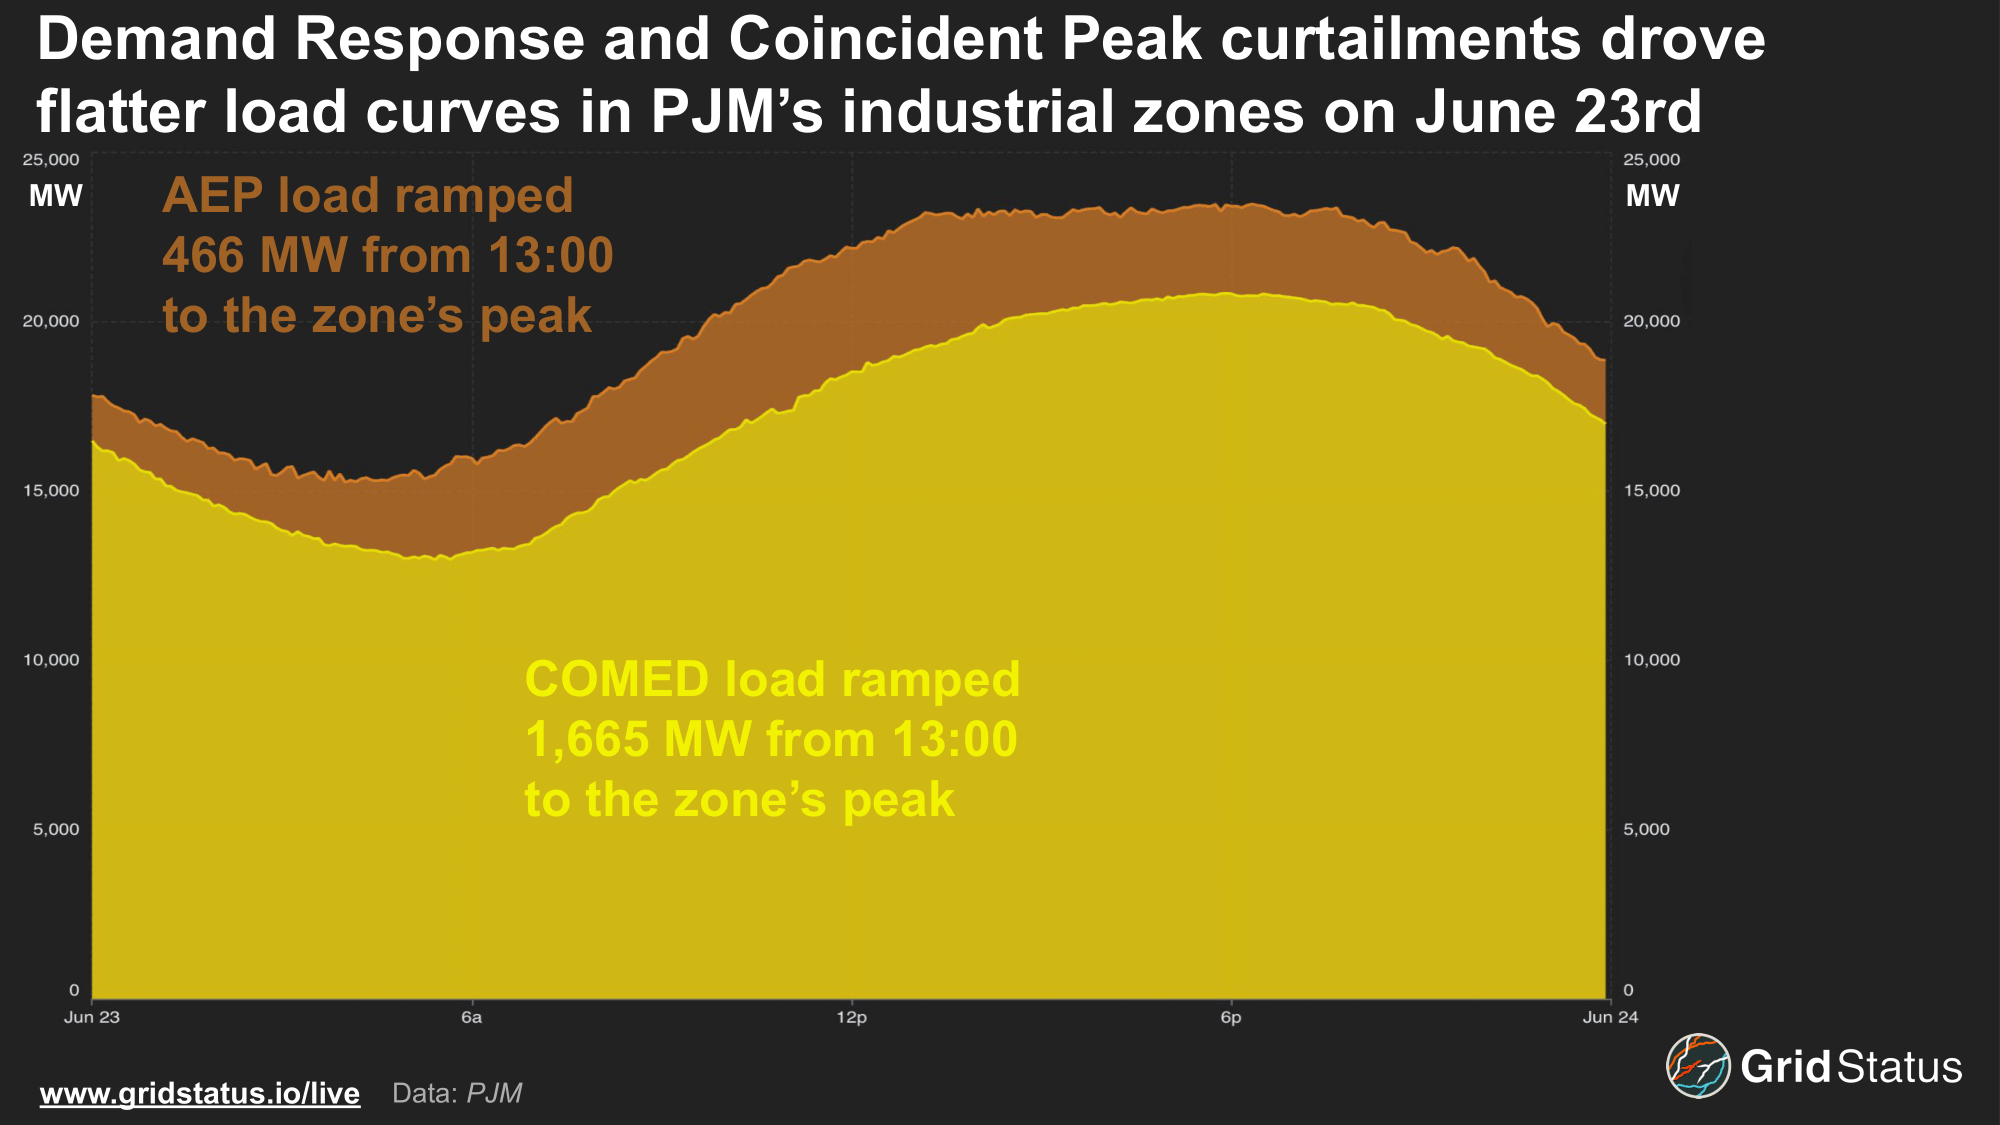
Beginning at 13:00 on June 23rd, PJM’s American Electric Power (AEP) load began to flatten out. From this time to the evening peak, load only increased by 466 MW. During the same timeframe, COMED, heavily dominated by residential demand in Chicagoland, saw load climb by well over 1,600 MW.
Load levels across the RTO had remained flat for well over a decade, and before this event, all of PJM’s top 10 hourly summer peaks occurred during or before 2013. This trend has changed in recent years, driven almost exclusively by the Dominion load zone. Off-peak load levels have risen by more than 4 GW over the past 6 years, and Dominion reached new demand peaks multiple times this year. Based on preliminary load numbers, data centers were likely a significant contributor in taking this event from the 7th highest PJM-wide summer load peak to the 4th highest.
Virginia is for (electricity) lovers
So far in 2025, Dominion has exceeded its all-time record load as well as both winter and summer seasonal peaks.
Datacenter-driven load growth in Northern Virginia has been well-documented, and the zone has seen two extreme weather events that quickly pushed the system to new peaks within six months of each other.
Back in January, Winter Storm Enzo brought single-digit temperatures to Virginia. On 1/23/25, a cold, clear morning led to 5-minute load peaking over 25 GW.
Multiple factors helped to drive the strength of this peak. Virginia, like many southern states, has a high ratio of resistance heating. This technology, which employs the same basic principle as a toaster, is highly electrically intensive, particularly as temperatures plummet. Adding to the challenges were the clear skies seen over Virginia that morning.
Cloud coverage is a bearish influence over the winter morning load peak. As heat dissipates overnight, clouds hold onto some of that warmth, propping up temperatures and reducing heating load.
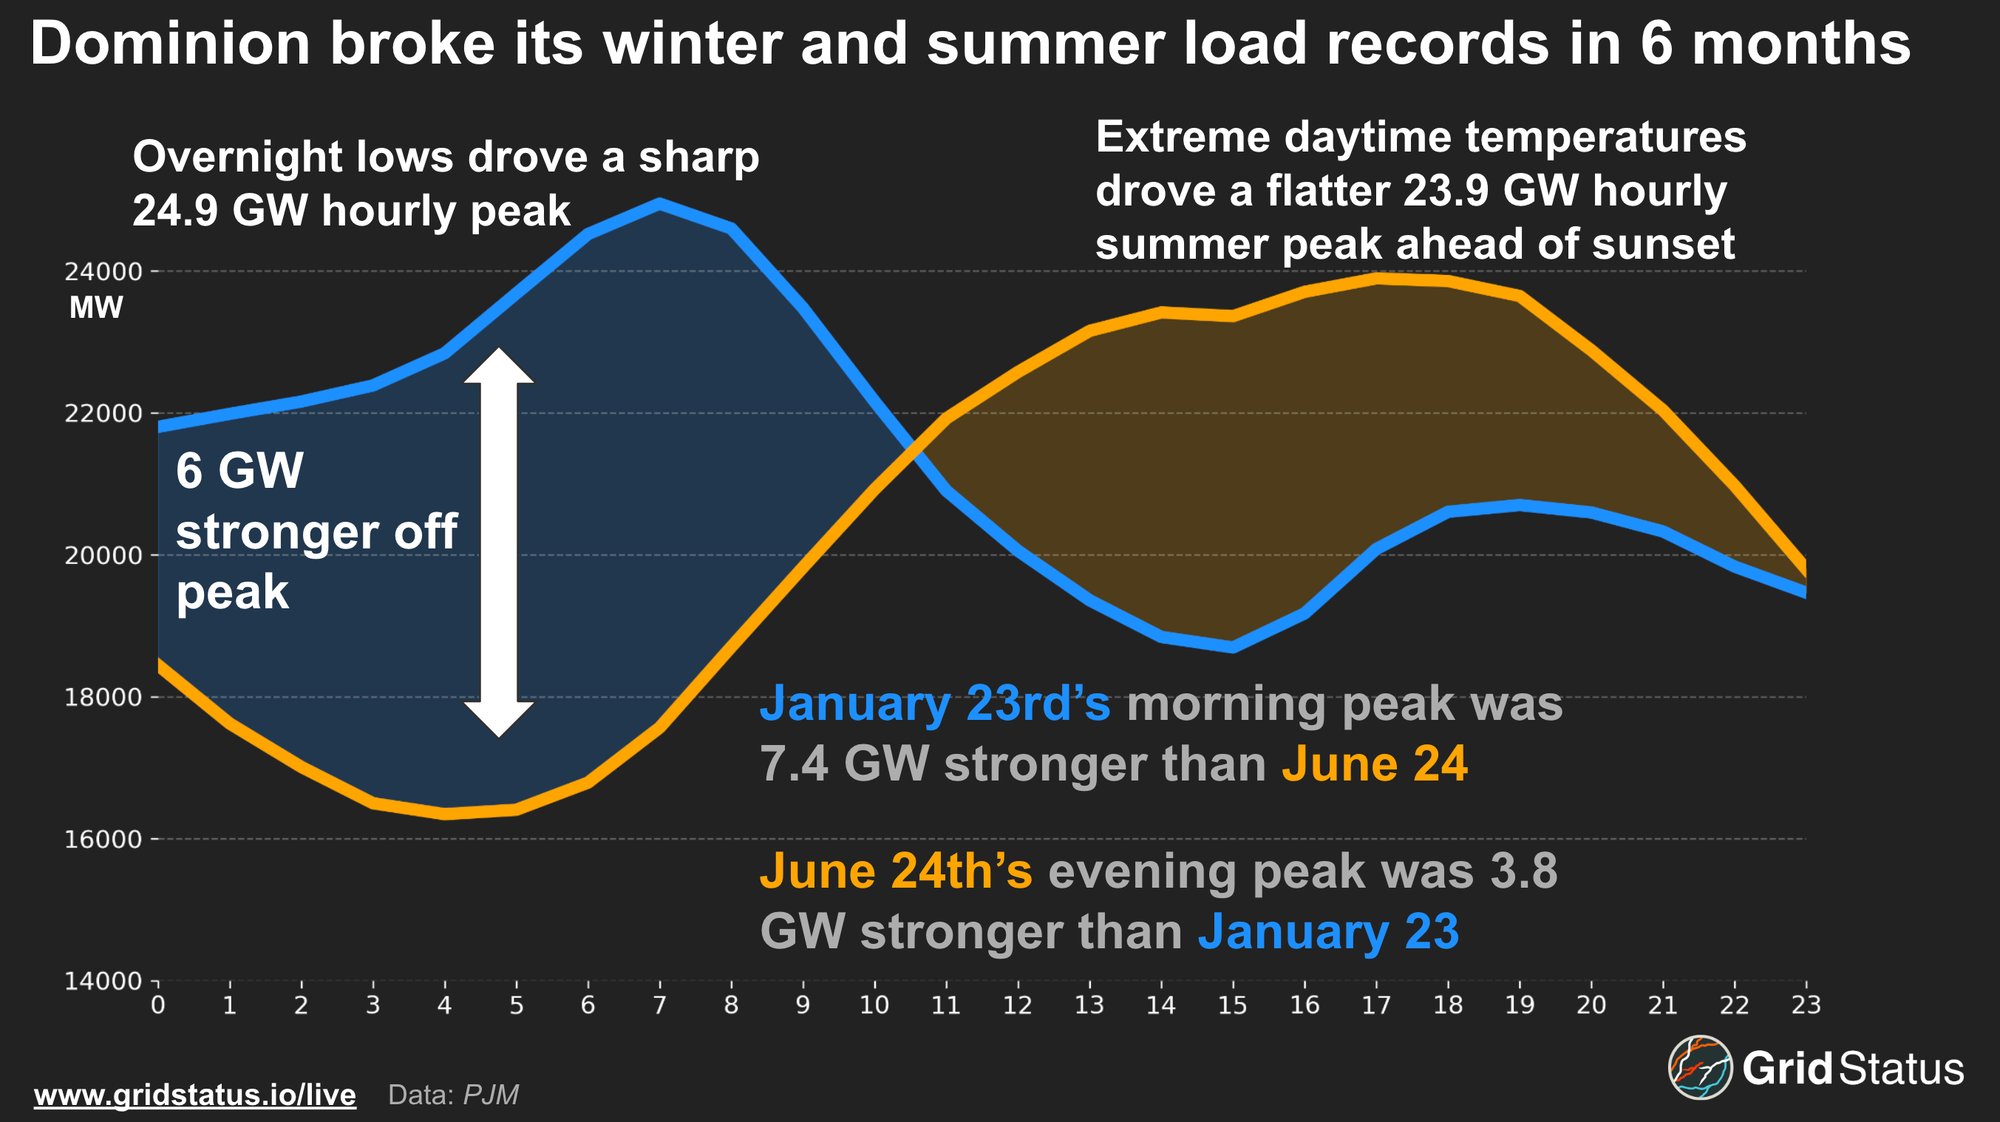
The blue curve above shows load over the morning of January 23rd. Notably, off-peak load levels were well over 3 GW higher than the afternoon, and even 2.5 GW stronger than the evening peak, all due to resistance heating. These factors combined drove Dominion’s strongest load peak, but that quickly fell as the sun rose and temperatures climbed. Winter load curves tend to have sharp peaks, while summer curves have longer periods of elevated load.
Compare that load curve to June 24th’s record summer peak. While air conditioning over the evening kept off-peak load propped up, the most extreme conditions did not appear until the afternoon and evening, the inverse of winter.
Crank That (older thermal generation)
PJM’s thermal fleet responded to the bullish load forecasts and direct calls from the RTO, increasing output. As reserved margins fell, lower capacity factor generation was dispatched to meet demand over the peaks.
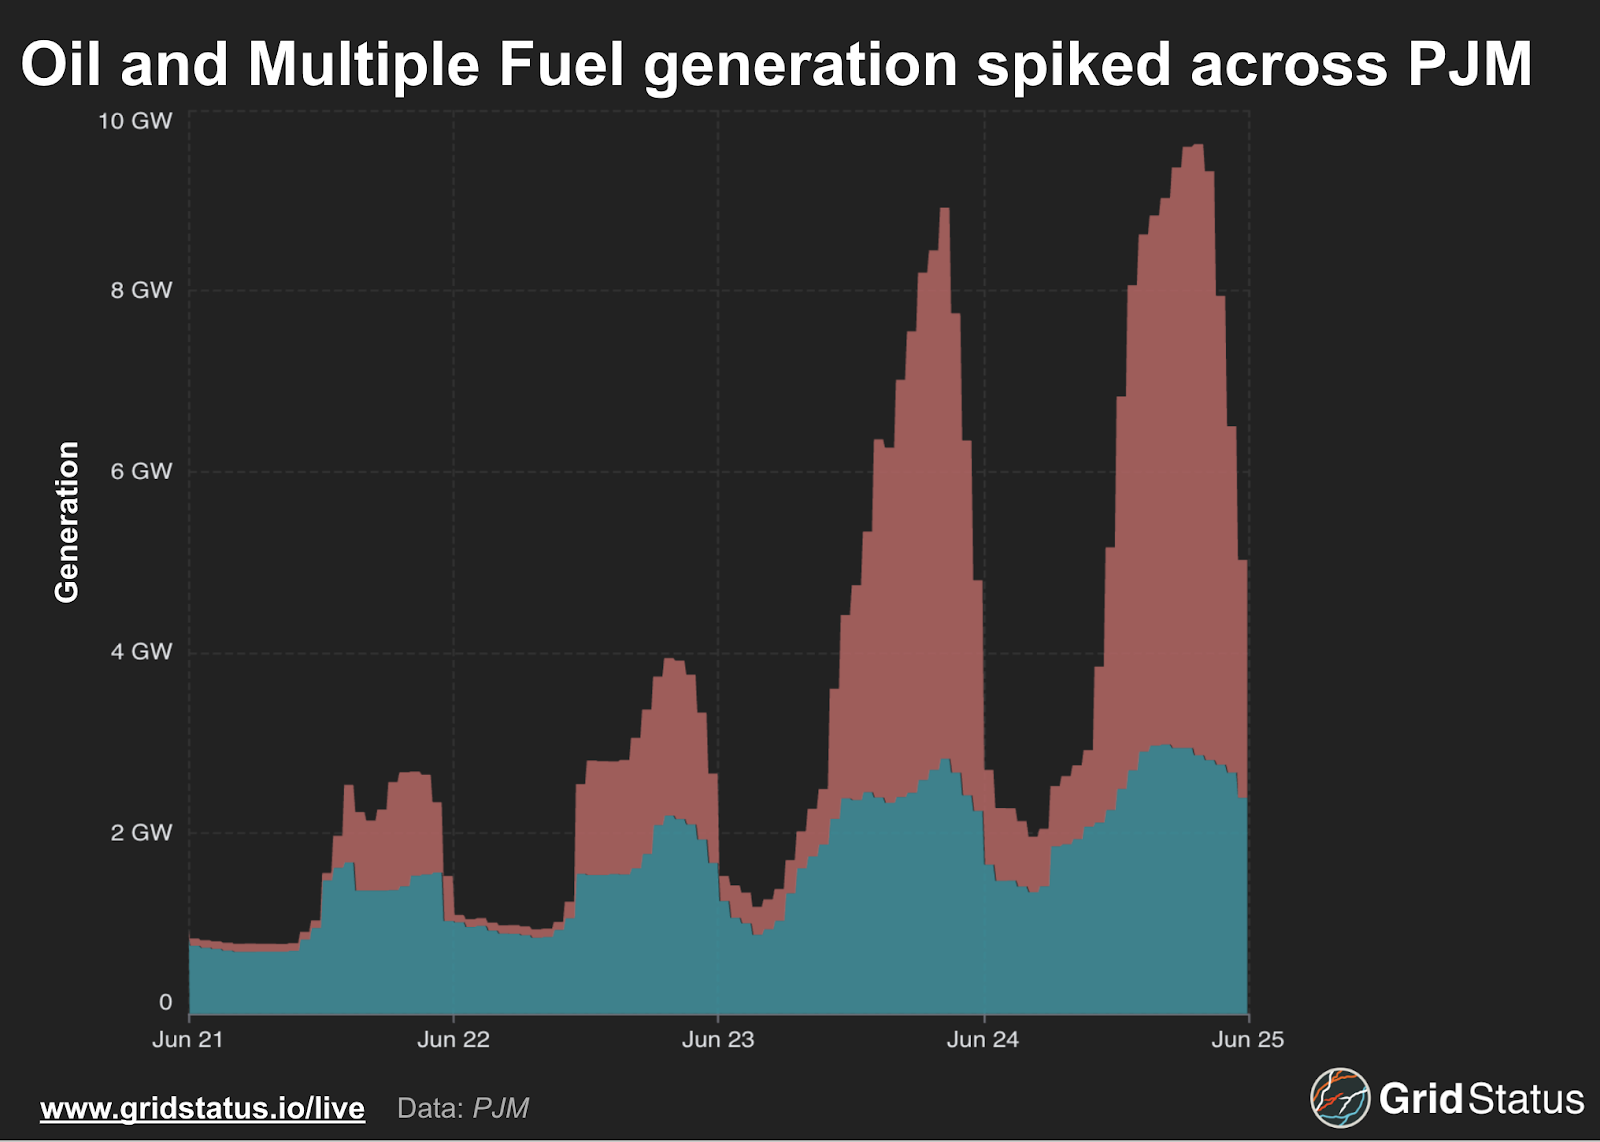
On a grid as large as PJM’s, even infrequently-run oil peakers can make up a significant chunk of generation, peaking above 6.7 GW, while the always-mysterious “Multiple Fuels” category contributed almost 3 GWs itself.
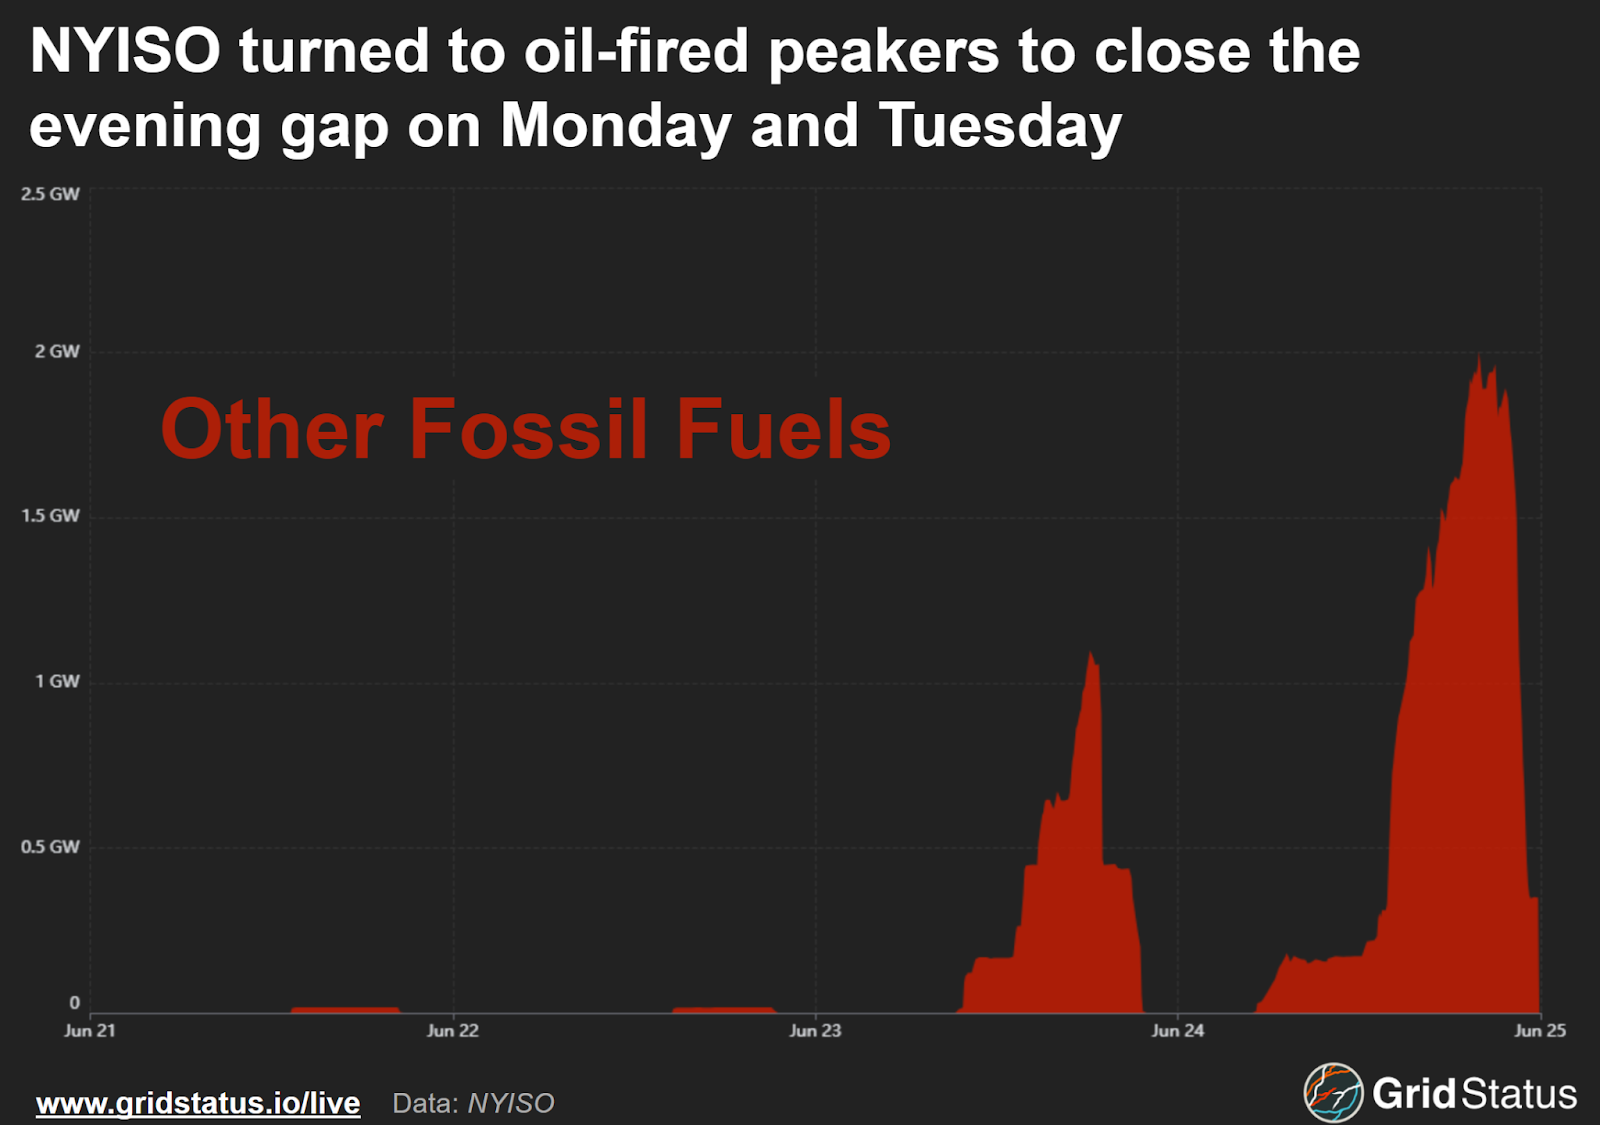
NYISO also turned to oil-fired peakers to close the evening gap. NYISO has a large number of dual-fuel units, which can burn either natural gas or various fuel oils, but in the summer, it’s rare for these units to burn oil. So, we turn to the “other fossil fuels” category, which largely represents oil-only units, many of which reside on Long Island, as many plants managed by the Long Island Power Authority do not have access to gas.
Similar to ISO-NE, in recent years NYISO has seen both the retirement of fossil generation within its largest load center and a slower-than-expected rollout of offshore wind. However, NYISO identified a capacity deficiency and prevented the complete retirement of old in-city peakers, retaining the barges for Gowanus 2 and 3 as well as Narrows 1 and 2. New York also has their own Quebec-supplied transmission project, the Champlain Hudson Power Express, which is expected to enter service in 2026 and bring additional capacity into the city area, hopefully eliminating the ongoing capacity concerns.
Into the Mystic
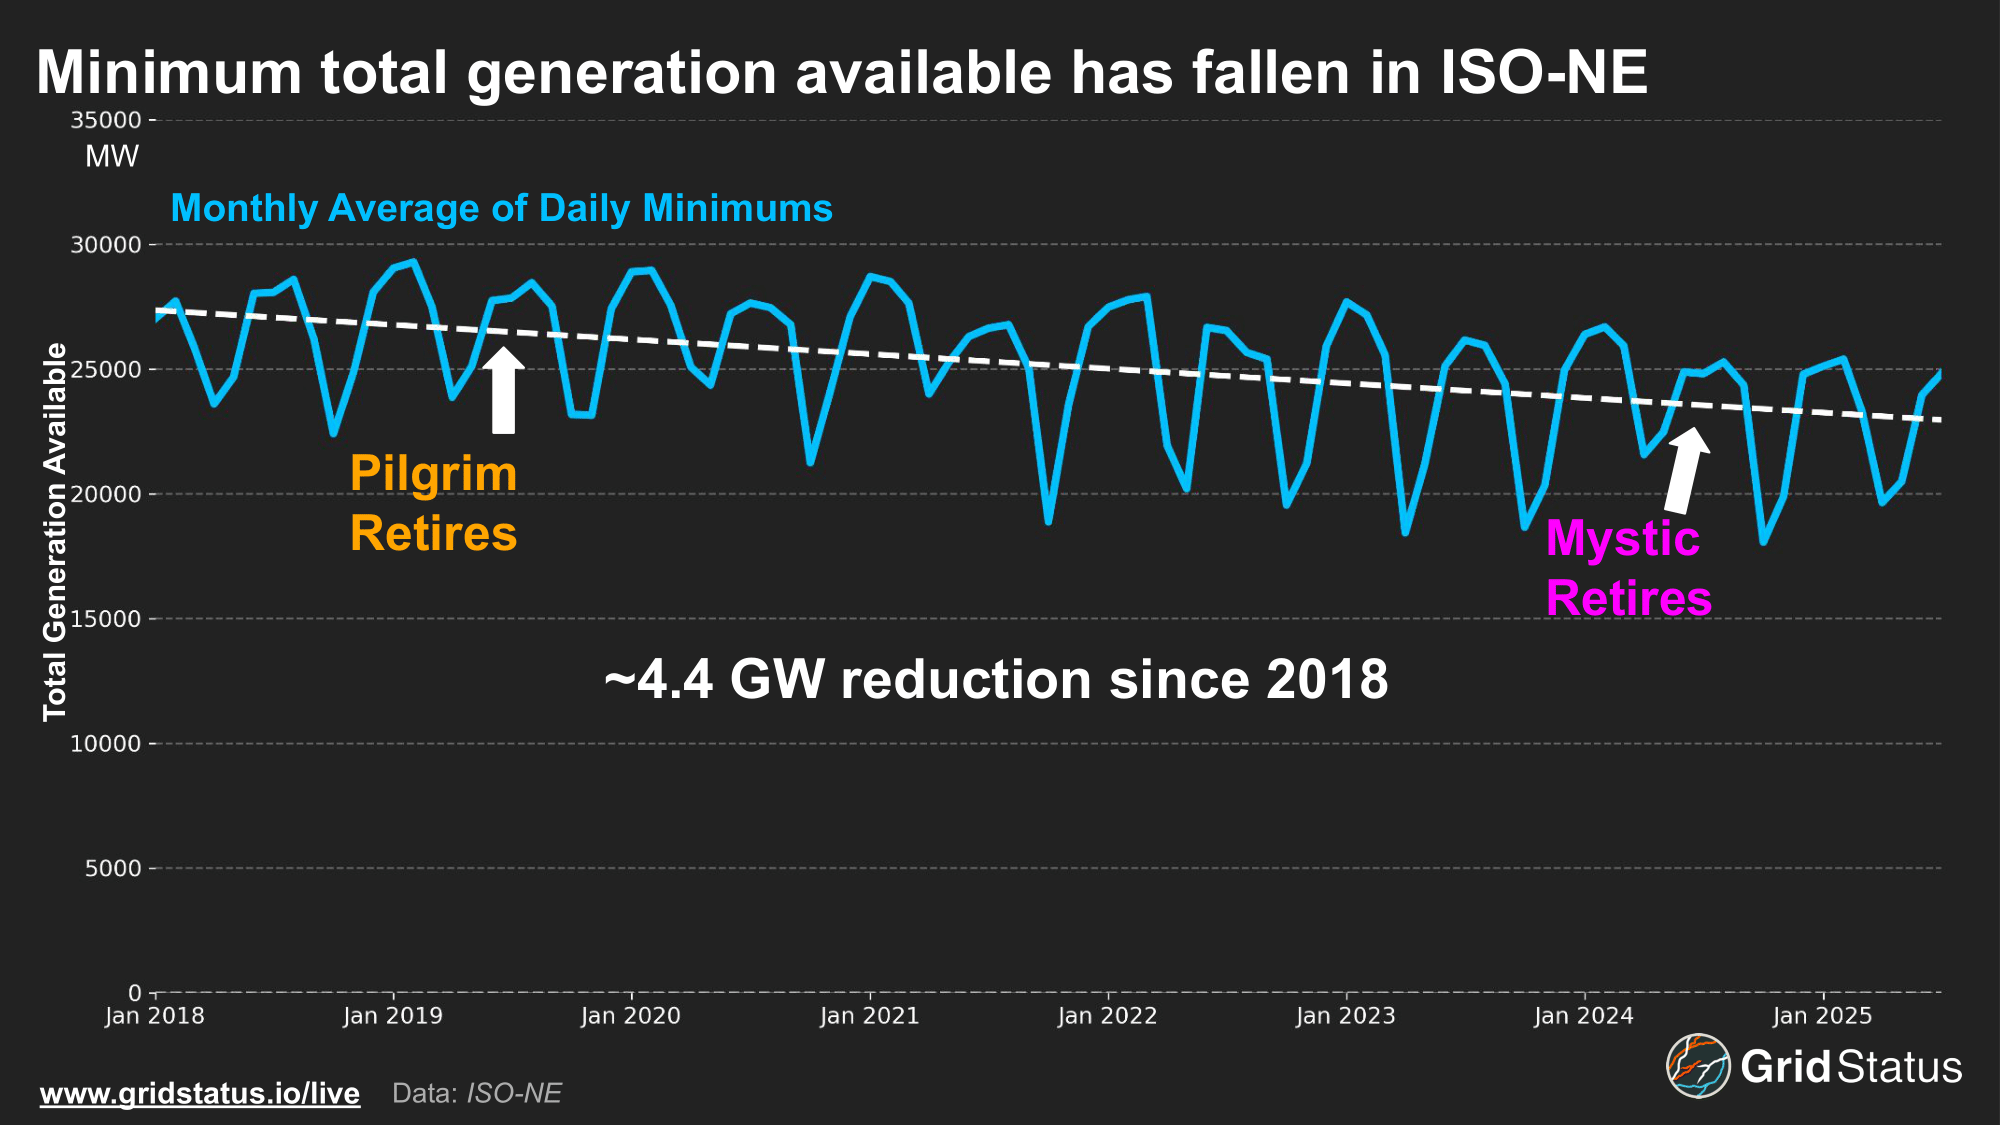
This week’s heat wave came at a challenging period for ISO-NE. In May 2024, Constellation retired units 8 & 9 of the Mystic Generation Station. These units were originally scheduled to retire two years earlier, but were kept online due to a unique feature: they burned liquified natural gas (LNG).
Given ISO-NE’s geographic location, pipeline limitations are a major concern, particularly during the winter months. Mystic’s ability to store fuel onsite and generate 1,400 MW next to a major load center provided a reliability cushion for grid operators, but it was at the mercy of increasingly global competition for LNG and unable to import directly from the US due to a lack of Jones Act-compliant ships.
While Mystic is the most notable recent retirement, ISO-NE has been consistently losing thermal generation for years.
ISO-NE anticipated a portion of these thermal retirements to be replaced with offshore wind. One project, Vineyard Wind 1, was expected to reach full commercial operations and begin providing power by 2023.
Since then, the project has faced numerous challenges, including a failure that has resulted in the project replacing defective turbine blades. The project extended its port lease into 2026, a sign that ISO-NE will not see the much-needed capacity for at least another year.
Cutting against the policy of many New England states, ISO-NE has been left to rely on older peaker plants to meet extreme demand. Notable amongst these plants is the summer debut of coal.
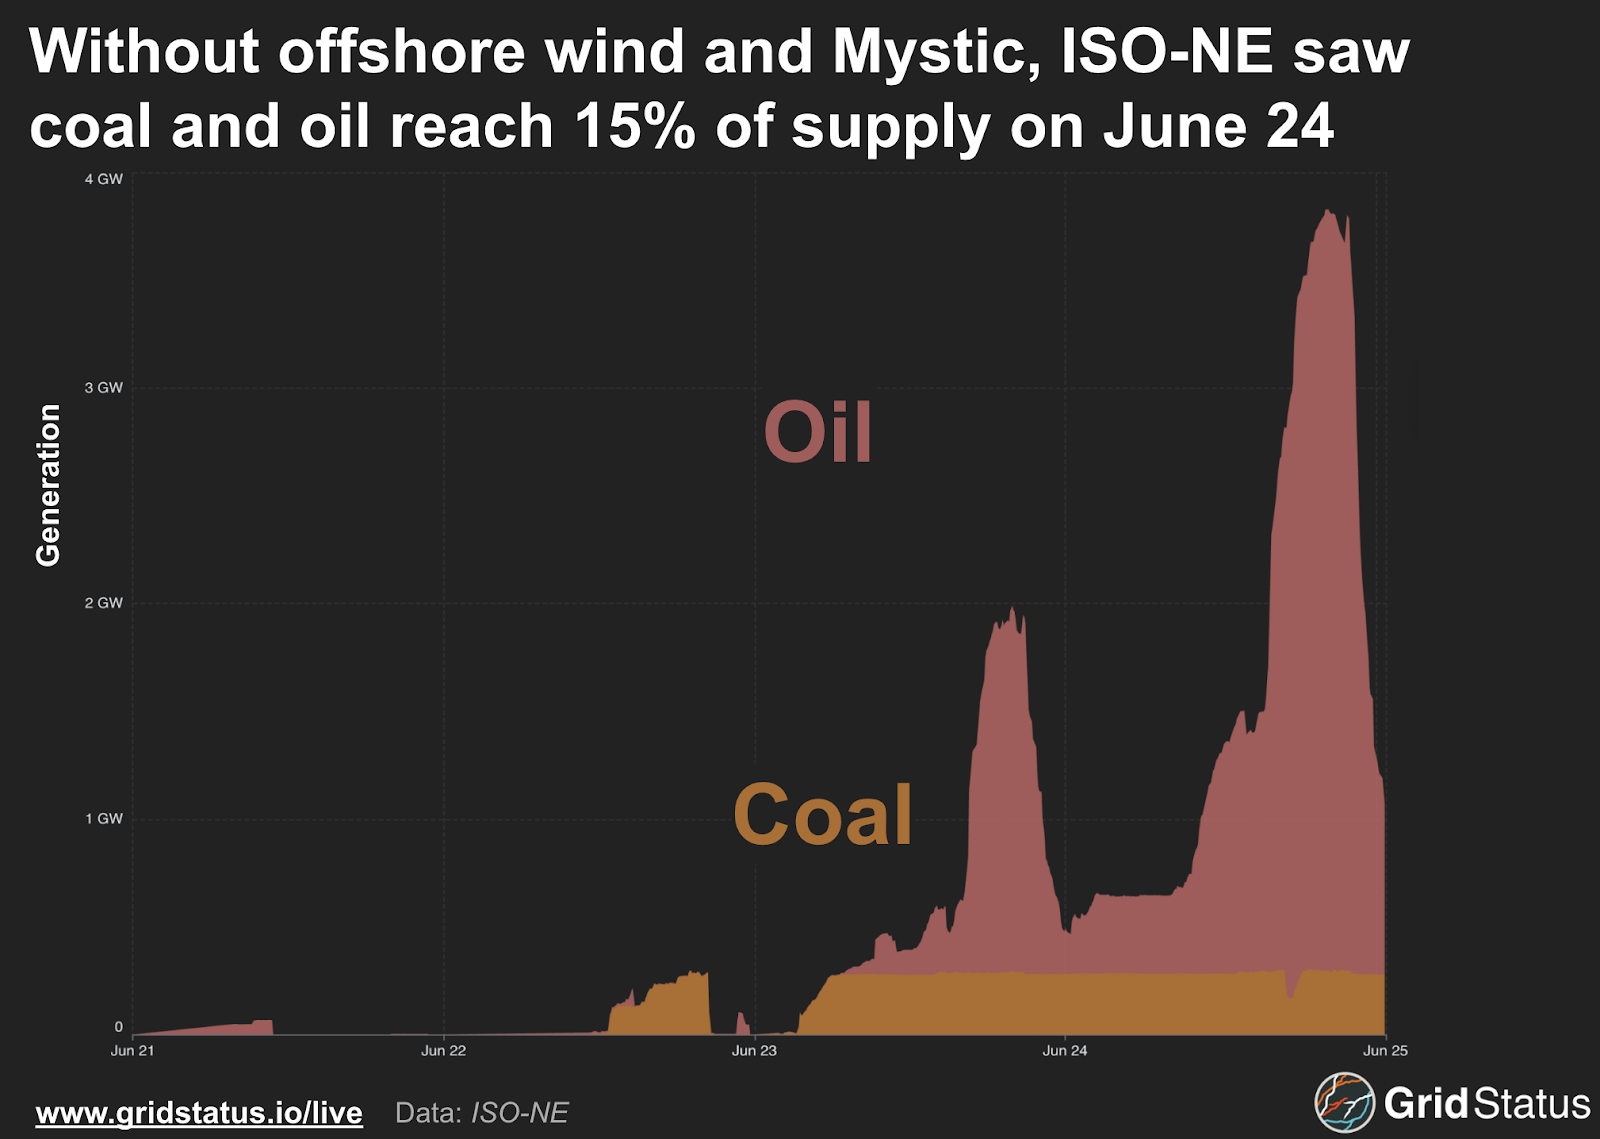
New Hampshire is home to both of ISO-NE’s remaining coal plants, Schiller and Merrimack. The startup and run-time requirements for these plants make them awkward peakers, but their capacity is welcome during the coldest and hottest days of the year. Scheduled to retire in 2028, these units remain a key player in the wider New England market, providing critical megawatts without relying on oft-constrained gas pipelines.
Supply and Demand
With ample warning and several days of hot weather already in the past, June 24th, Tuesday, was shaping up for peak conditions. Day-ahead prices were high across affected markets. ISO-NE LMPs cleared above $400/MWh through the evening peak on Tuesday, reaching $473/MWh. These were the highest day-ahead energy prices seen since at least 2016, and they were still handily outstripped by prices in real time.
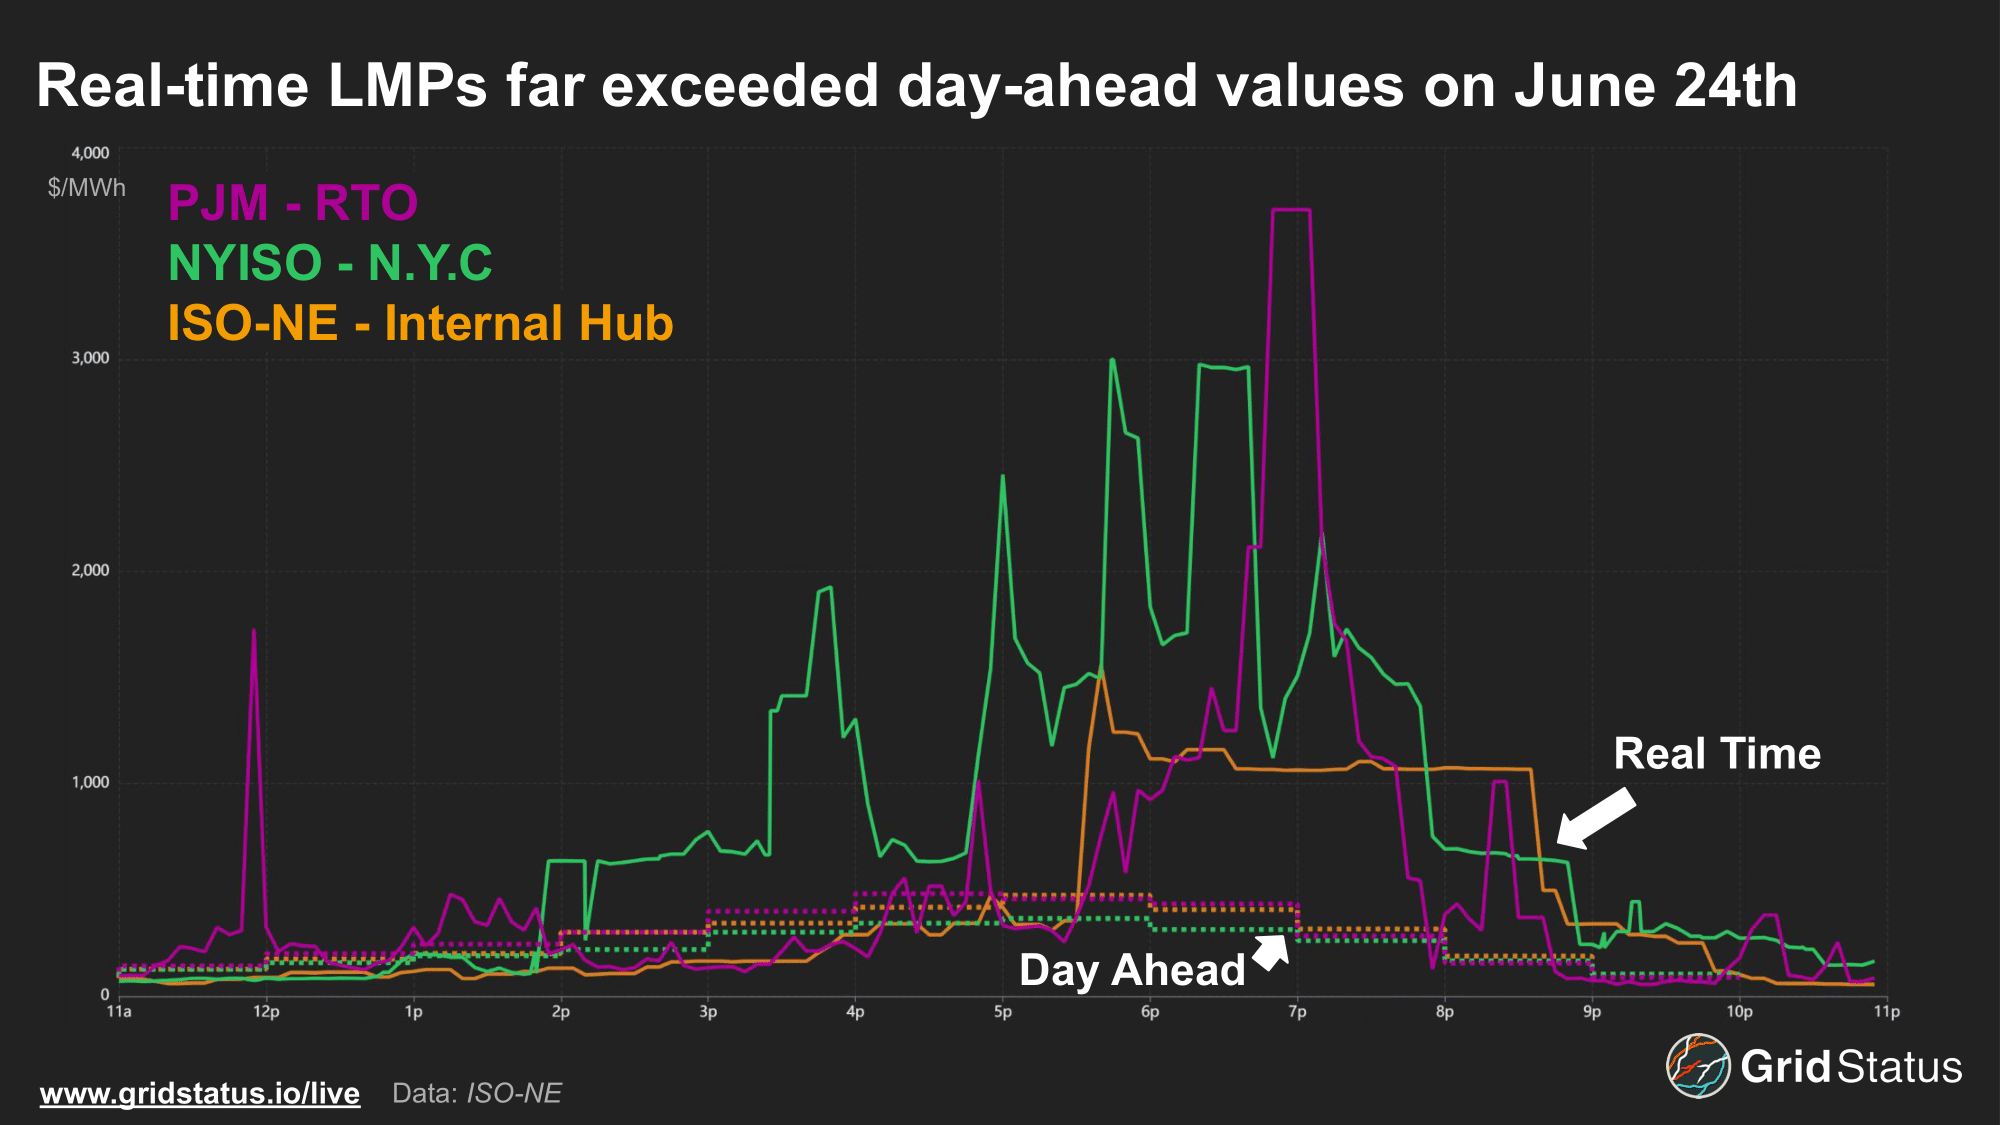
Real-time prices were elevated across the day in New York City, with that zone’s LMP regularly above $1000/MWh. In contrast, PJM and ISO-NE didn’t start to take off until peak load, and then rocketed up as peak net load approached.
Even during extreme events like this week’s heat wave, BTM solar helped tame pricing through the midday. Combined generation between ISO-NE and NYISO peaked at over 10 GW on the afternoon of June 24th. This additional demand-dampening generation helped to suppress prices over the daytime hours.
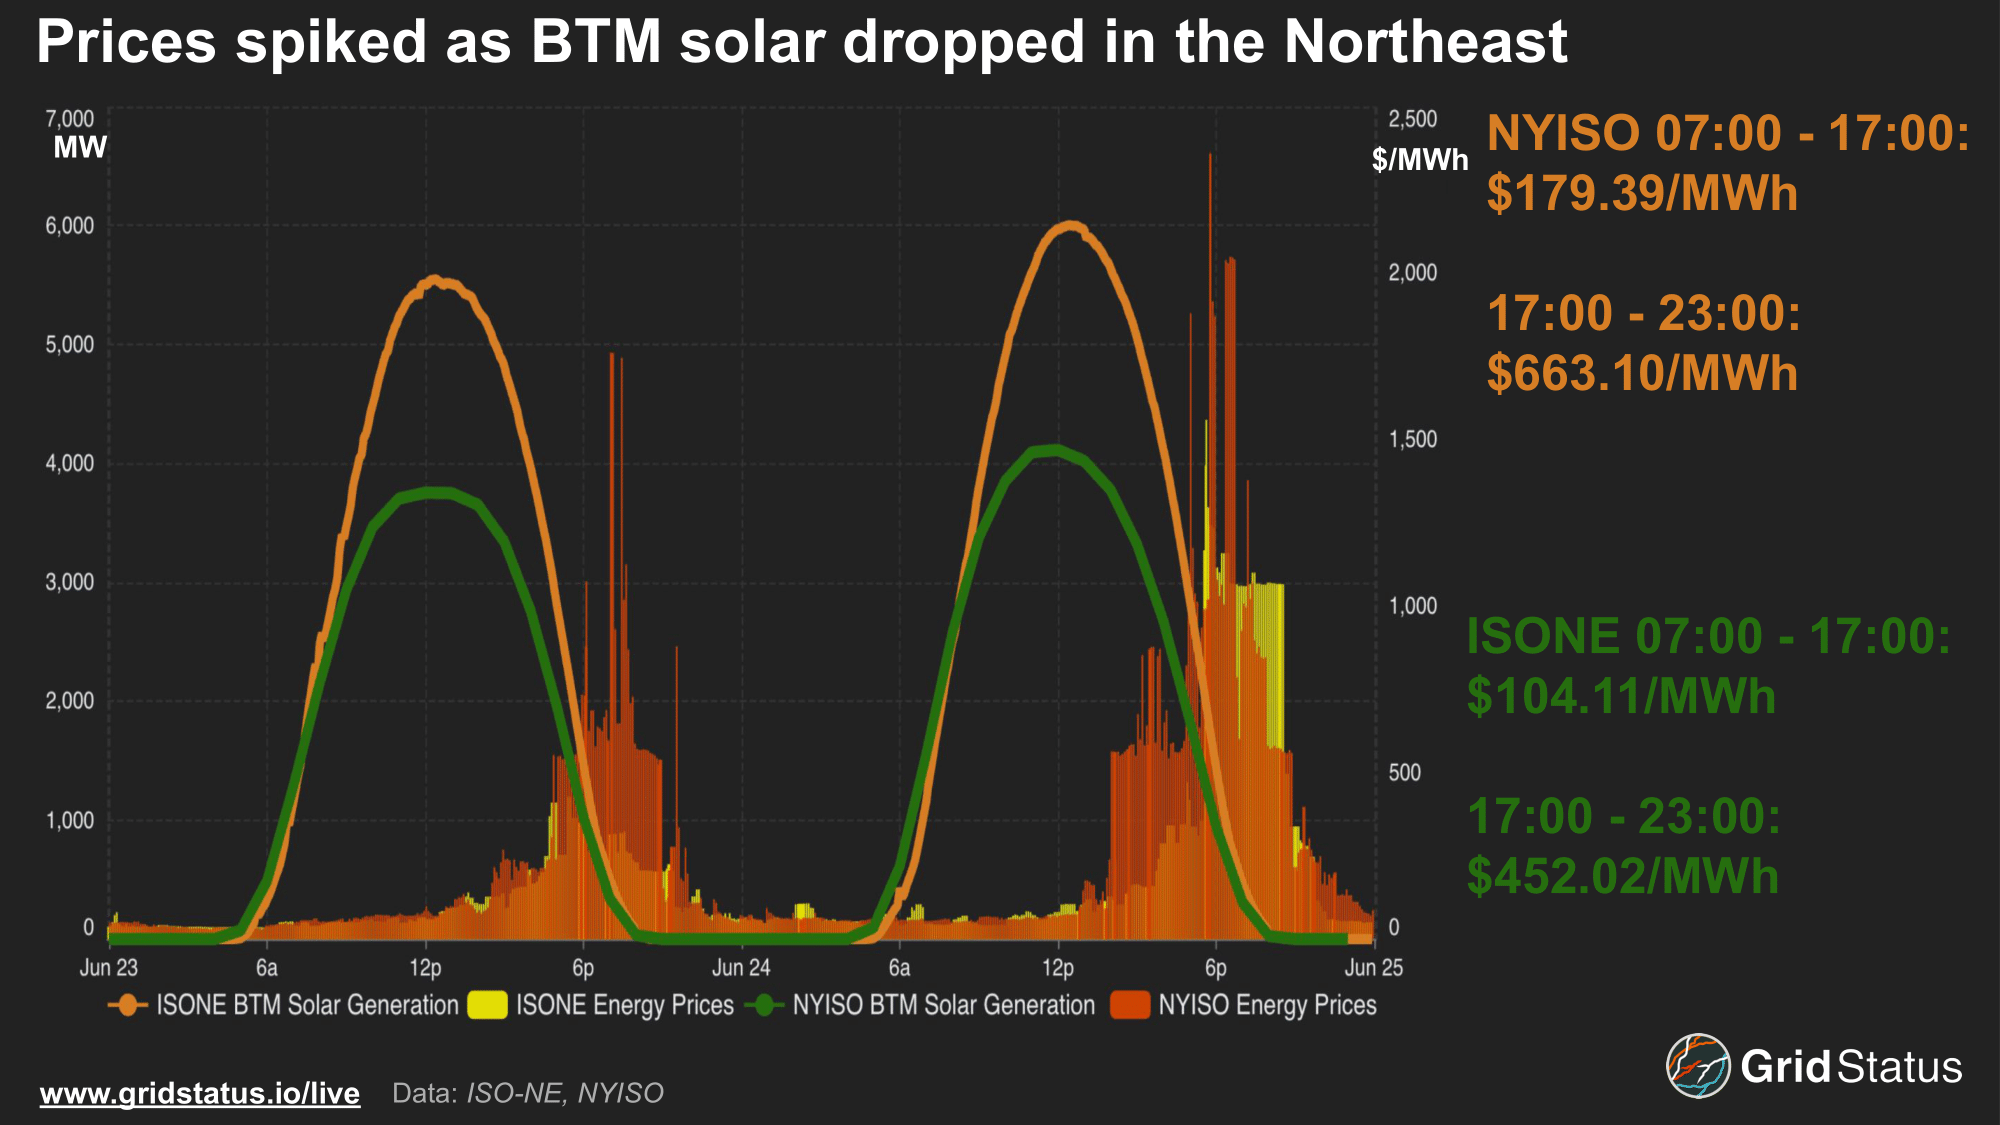
Even as air temperatures, let alone feels like temperatures, in major load centers rose to triple digits, the system energy component of LMPs remained relatively tame, with the expected congestion spikes in hard-to-manage areas, but this didn’t last. As the sun set and solar output dropped, prices began to spike. While the northeast has built out quite the fleet of BTM solar, storage hasn’t kept up. Thermal units filled in this gap, but with the strength of the load peak, combined with load overperformance, prices quickly spiked across the East.
Similar trends were observed in PJM where the net load peak drove the highest level of price volatility. On both Monday and Tuesday, load peaked during HE 18. While PJM does not have the level of BTM solar as New England and New York, utility-scale solar installations have risen in recent years, shifting risks towards the HE 20 net load peak.
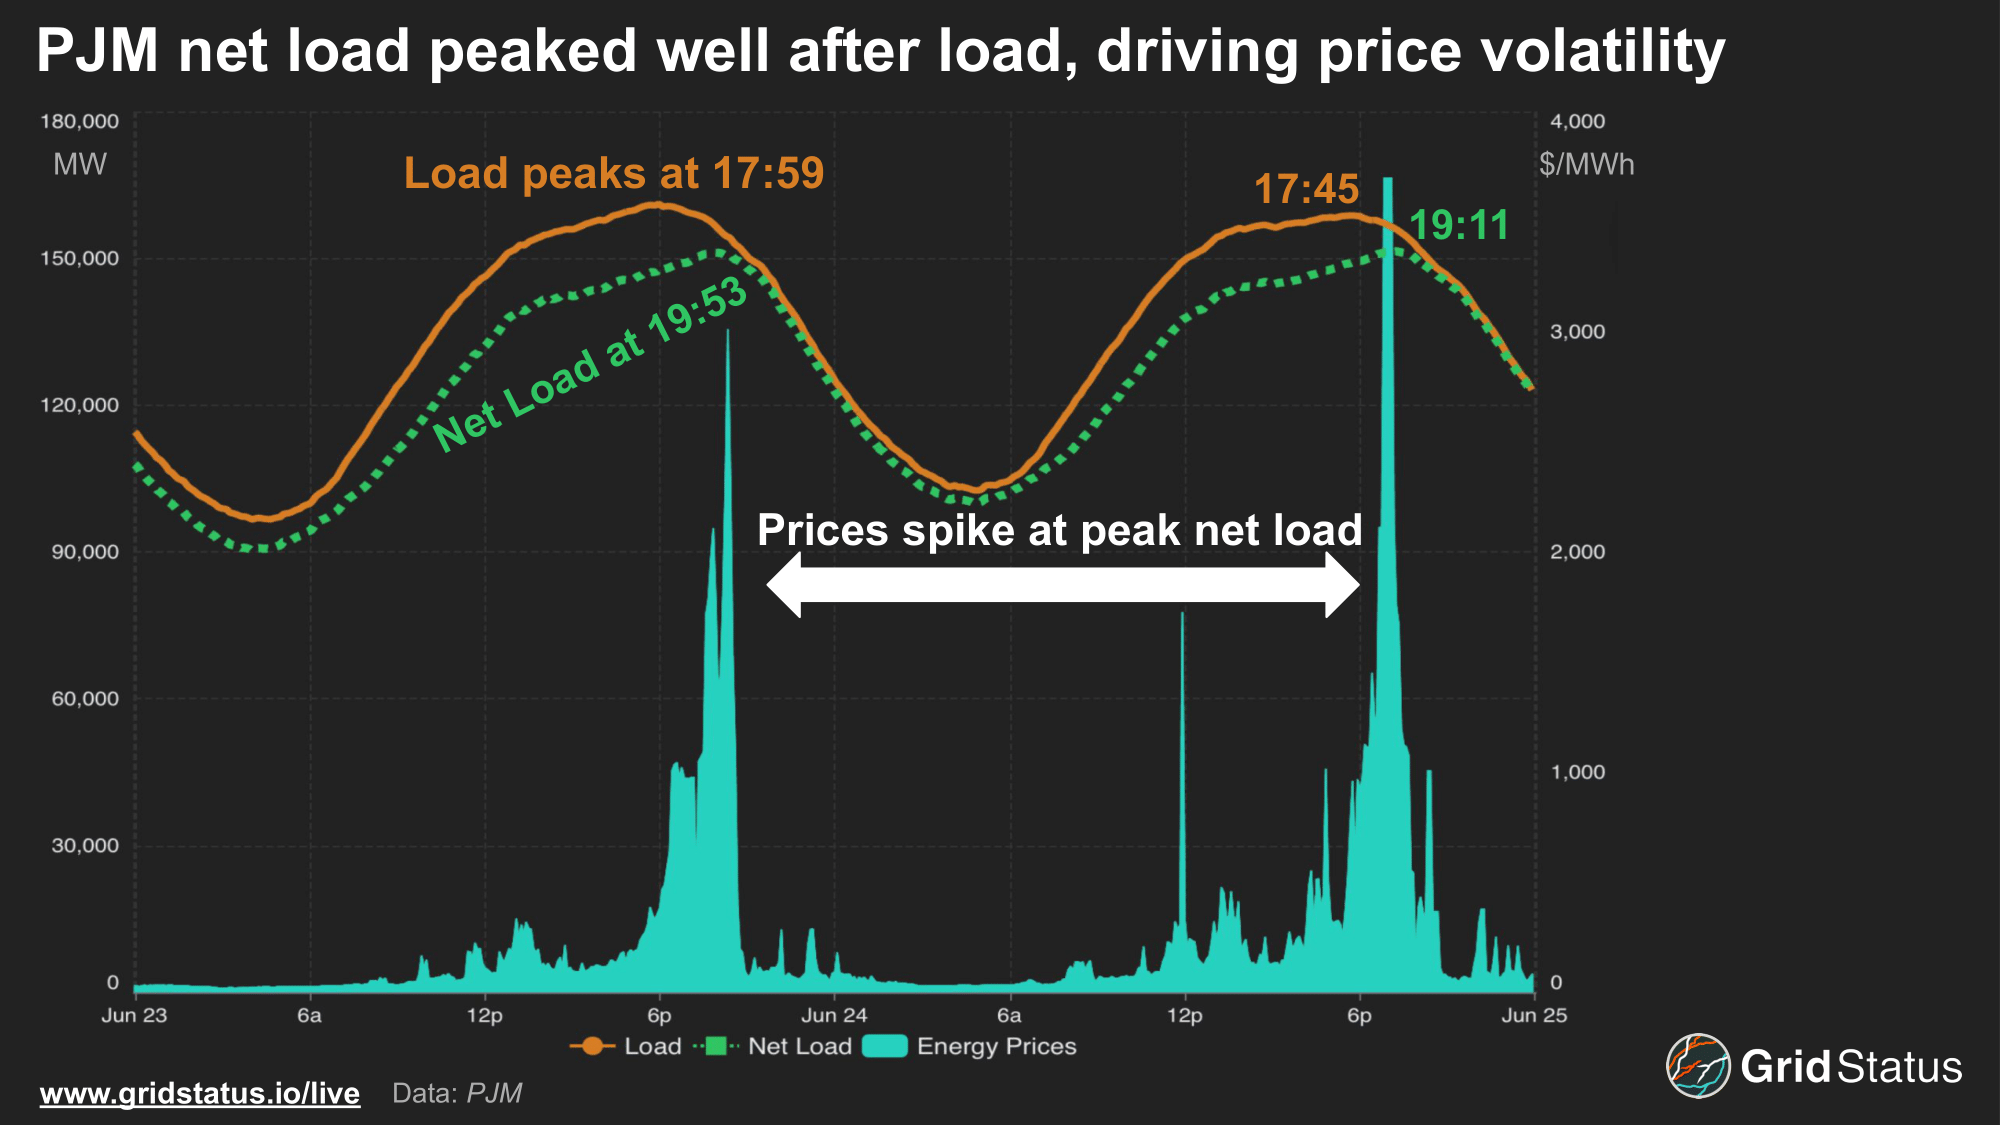
Energy prices were elevated during both load peaks, but the net load peak saw the highest level of volatility. Tuesday’s net load ramp even triggered reserve pricing as energy prices hit $3,700/MWh, exceeding the $2,000/MWh offer cap.
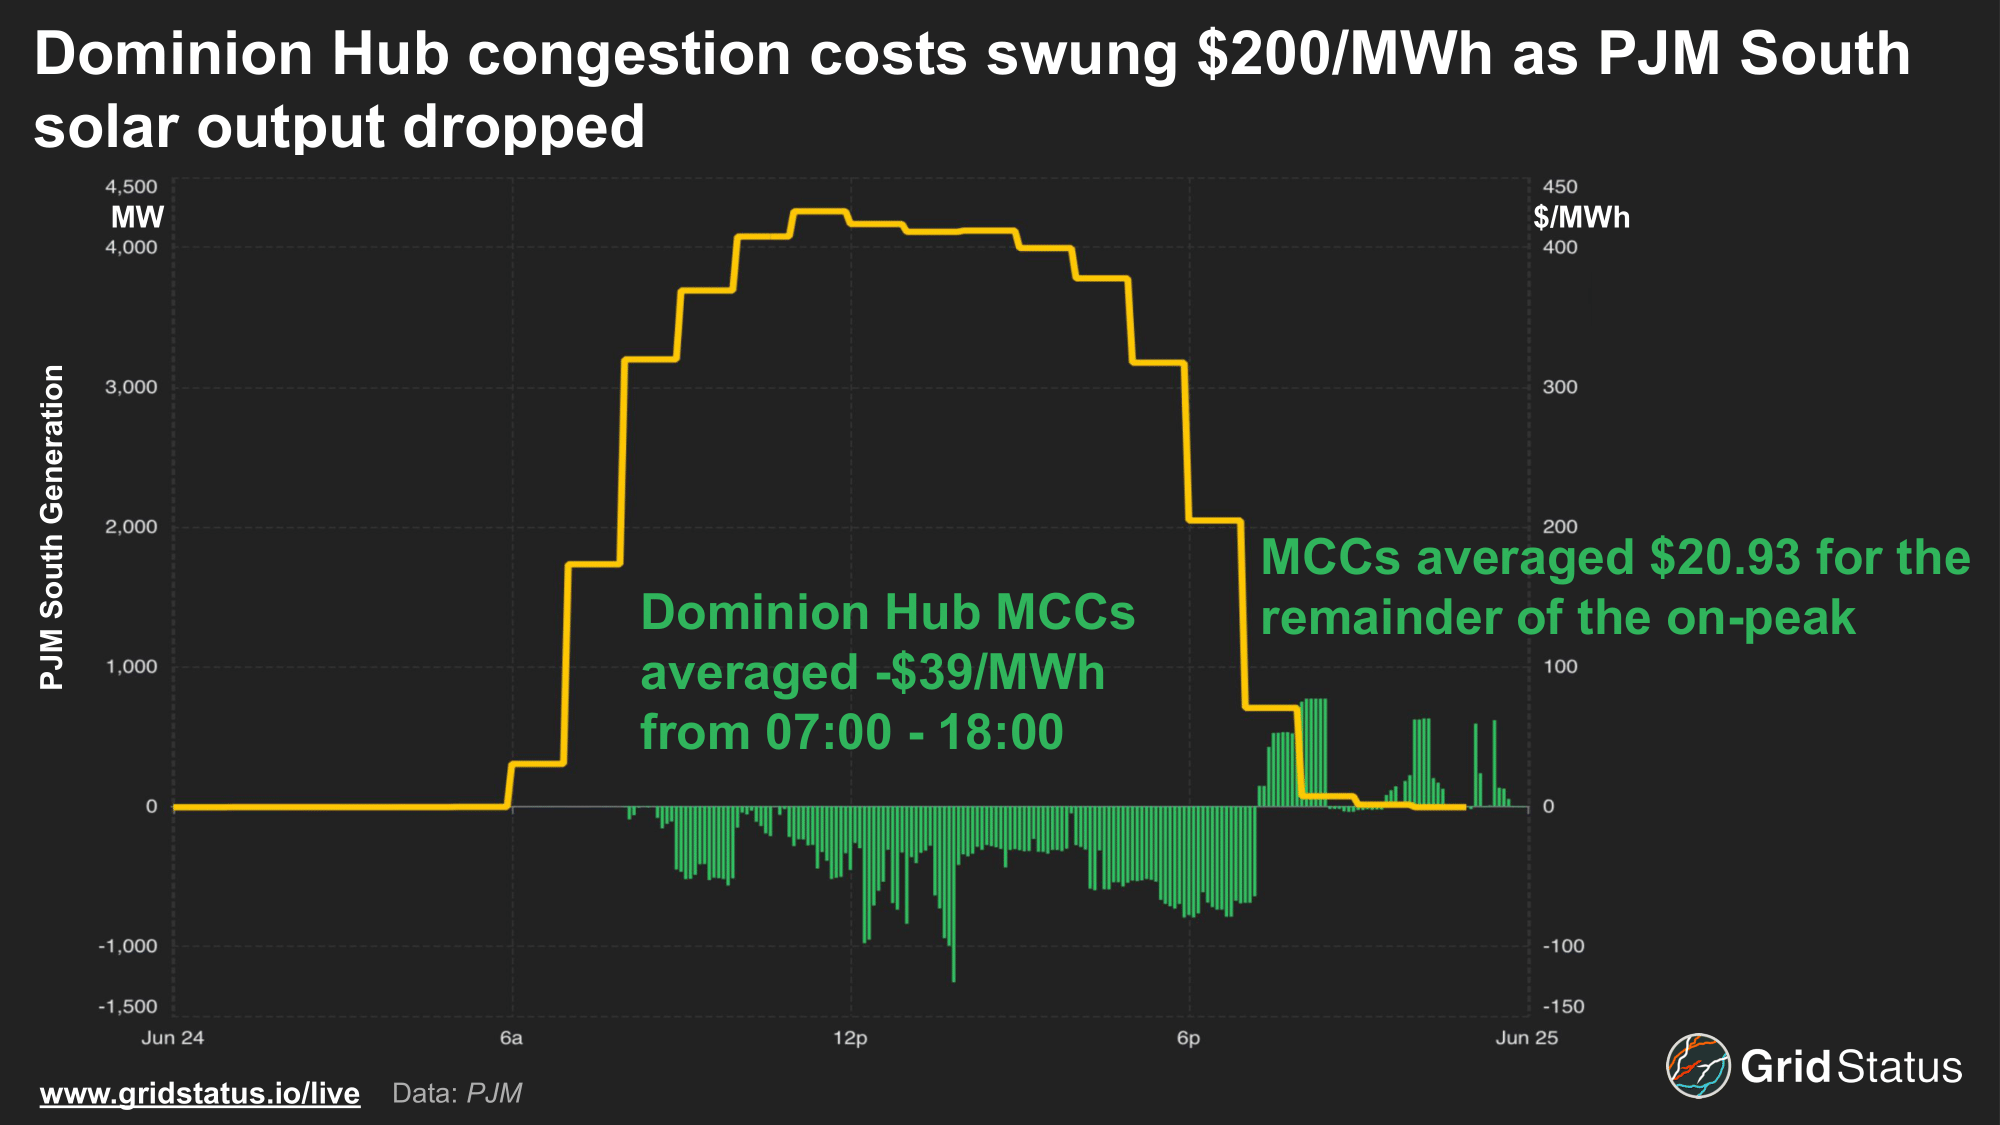
Similar impacts were seen on congestion prices, particularly those associated with solar generation in Virginia. The Dominion Hub aggregation is heavily correlated with solar assets, particularly those along the Virginia/North Carolina border. Congestion costs were negative over the afternoon as power struggled to flow into the Richmond area. As production fell, congestion swung positive at the same time as energy prices RTO-wide spiked.
Similar levels of volatility were observed in NYISO, particularly on Tuesday night, as load outperformed the ISO’s forecast.
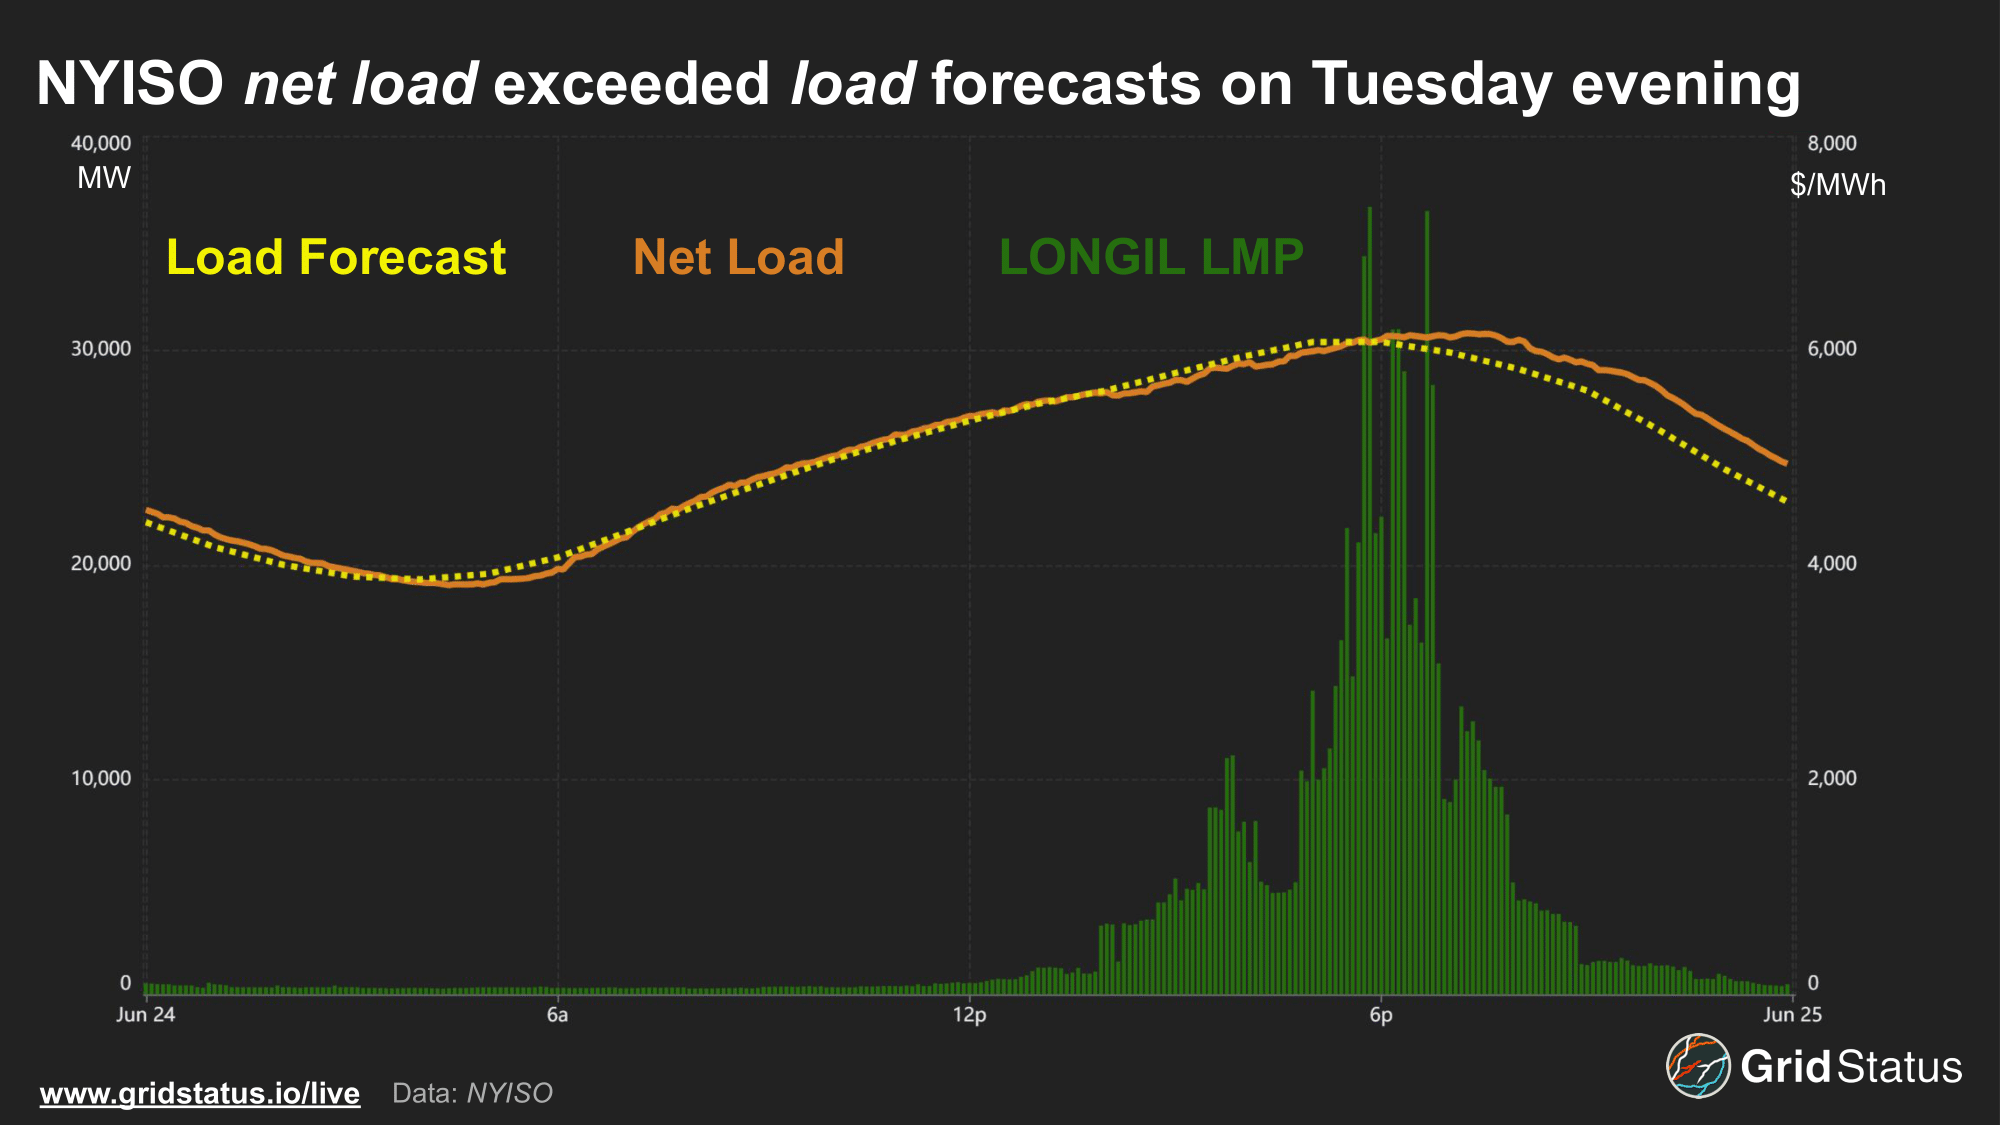
NYISO load overperformed so heavily that even net load exceeded the demand forecast. As a result, real-time prices spiked well above day-ahead clears, particularly in Long Island.
This region, Zone K in NYISO, saw extreme congestion as limited thermal capacity and high temperatures put added strain on the grid. Some nodes peaked at over $9,000/MWh while the zone as a whole exceeded $7,000/MWh. The highest-priced nodes were at Barrett, but not all of Barrett.
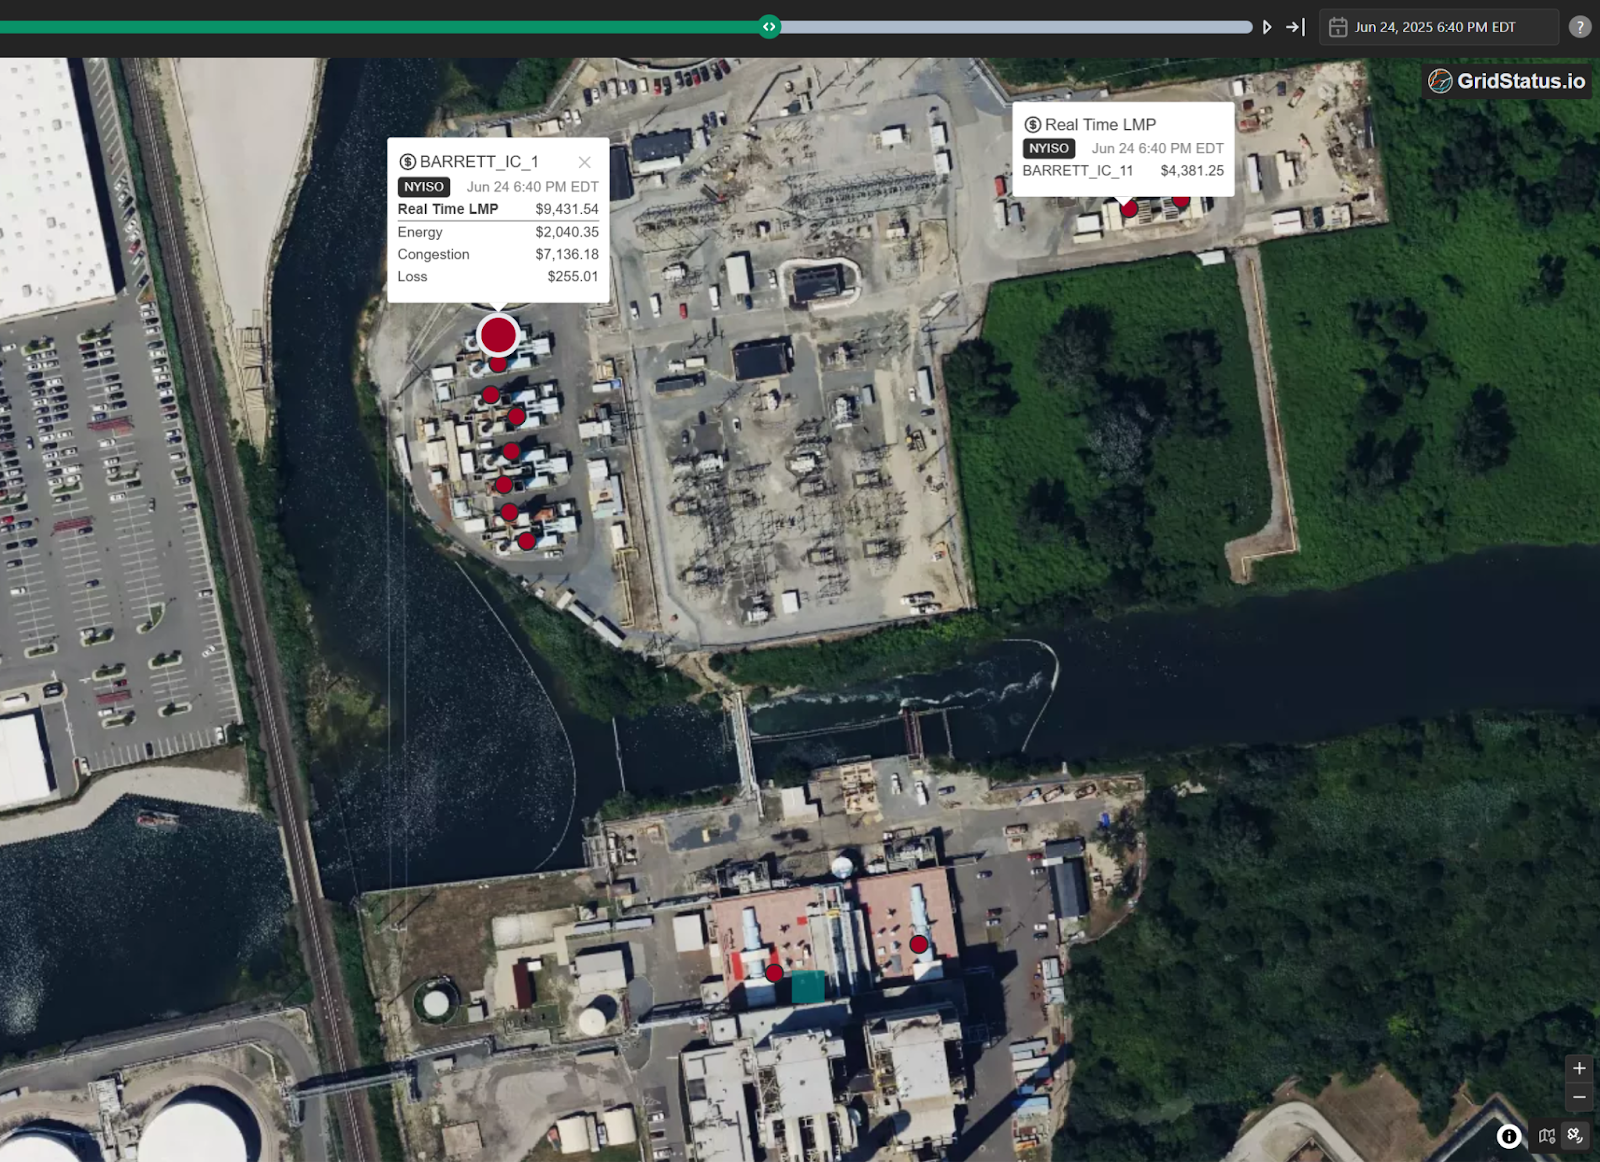
The Barrett facility is one of the largest power plants on Long Island. Its oldest units, Steam 1 and 2, were constructed in the late 1950s and early 60s, while 8 gas turbines and 4 jet engine generators were added at the beginning of the 70s. Management of power in this congested area is complicated, multiple lines leave Barrett in different directions, and modeling to account for this mix of generators and transmission can lead to wide divergences during tight conditions.This divergence can take some of the nodes into the negative as well. In the first week of May, the lower-priced Barrett nodes sank to $-3,000/MWh multiple times, while the higher-priced locations went in the opposite direction, albeit without the same velocity, ranging from $200-$900/MWh.
New Market, Same Old Demand
This heat wave was the strongest test of Ontario’s renewed market to date. Unlike prior heat waves, prices were not limited to the HOEP and MCP. With the launch of a nodal market in May, the true costs of generating and consuming power across the province were revealed.
As noted in our deep dive into the Market Renewal Program, Ontario’s population and demand are heavily concentrated in the Greater Toronto area. As we expected, the combination of highly concentrated load far away from the province’s vast hydroelectric resources triggered bouts of extreme congestion as load peaked on June 24th.
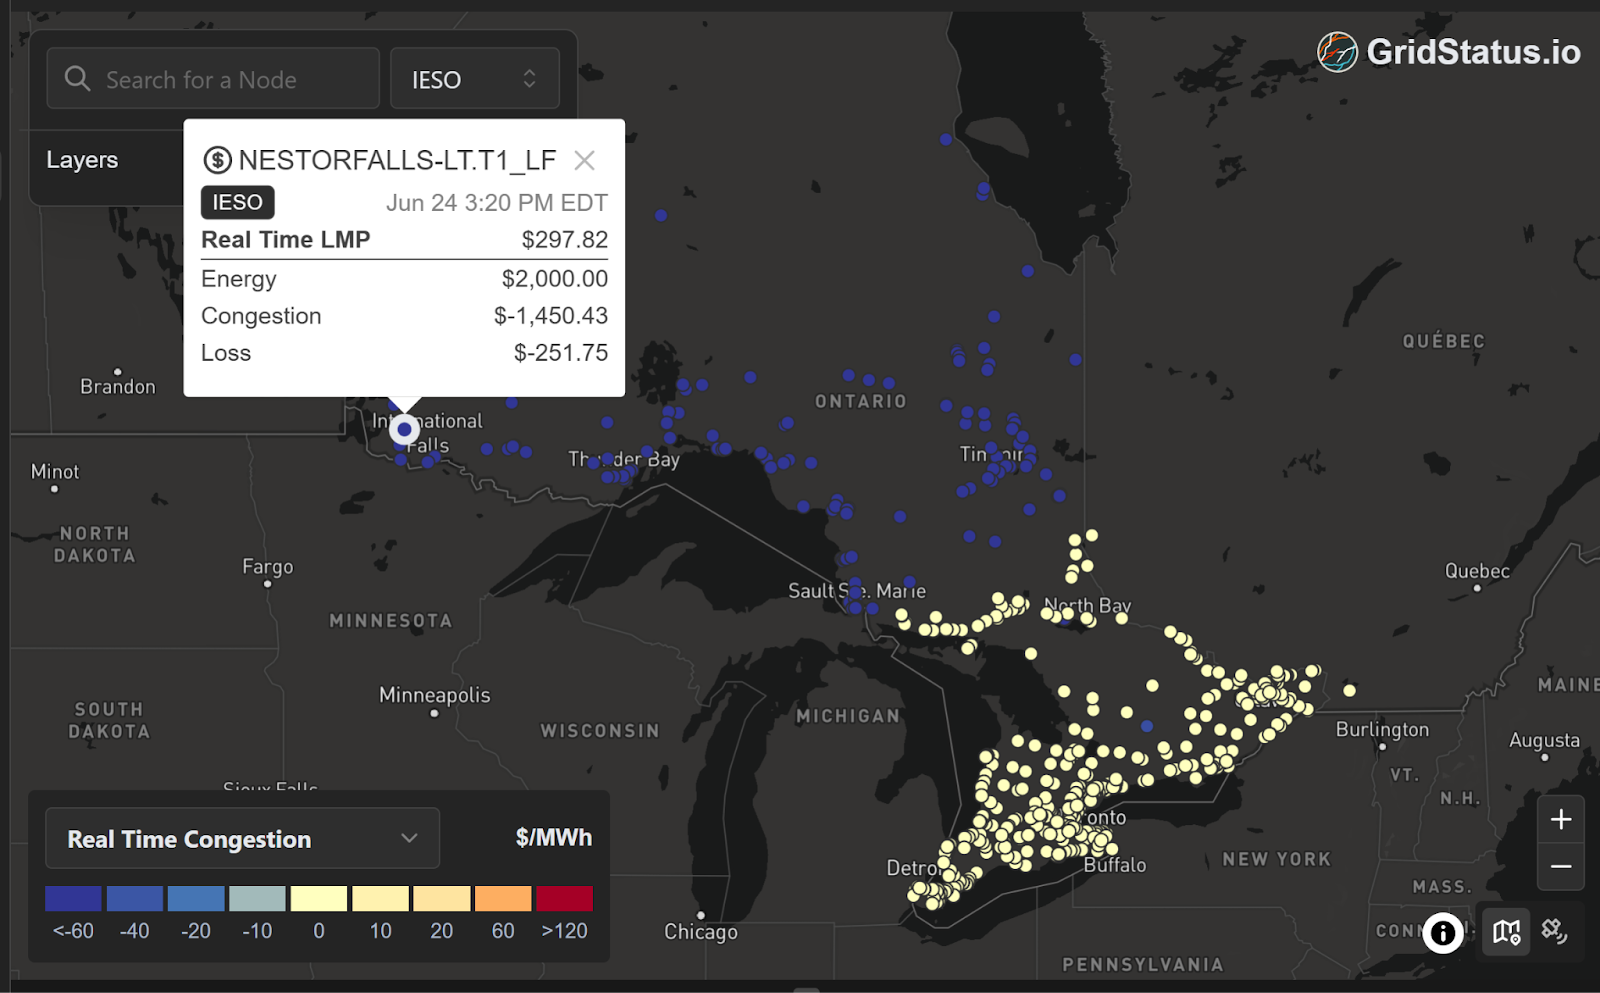
During the midafternoon, generators in Northern Ontario saw considerable price separation compared to nodes near Toronto. During this specific interval, energy prices reached the price ceiling of $2,000/MWh while congestion and loss costs plunged to less than -$1,800/MWh.
In addition to population density and the proximity to hydroelectric resources, the load shape of “Up Province” zones, Northwest and Northeast, helps to explain such bearish market outcomes.
While relatively sparsely populated, these zones are home to energy-intensive industries like mining. As load climbed into the afternoon, these facilities, hoping to avoid global adjustment charges related to demand during peak intervals, began to curtail or switch to backup generation.

Load in the Northwest and Northeast exhibited a much flatter curve and dipped over the afternoon of the 23rd and 24th, indicating curtailment and load management actions. At the same time, load “Down Province”, dominated by the Toronto metropolitan area, followed a much more traditional ramp, putting pressure on flows and exacerbating congestion heading into the evening peak.
With a Little Help From Your Friends
The Eastern Interconnection is heavily interconnected, with a variety of interchange transaction methodologies. Each ISO also has their own twist on reporting as well as naming for the different ties.
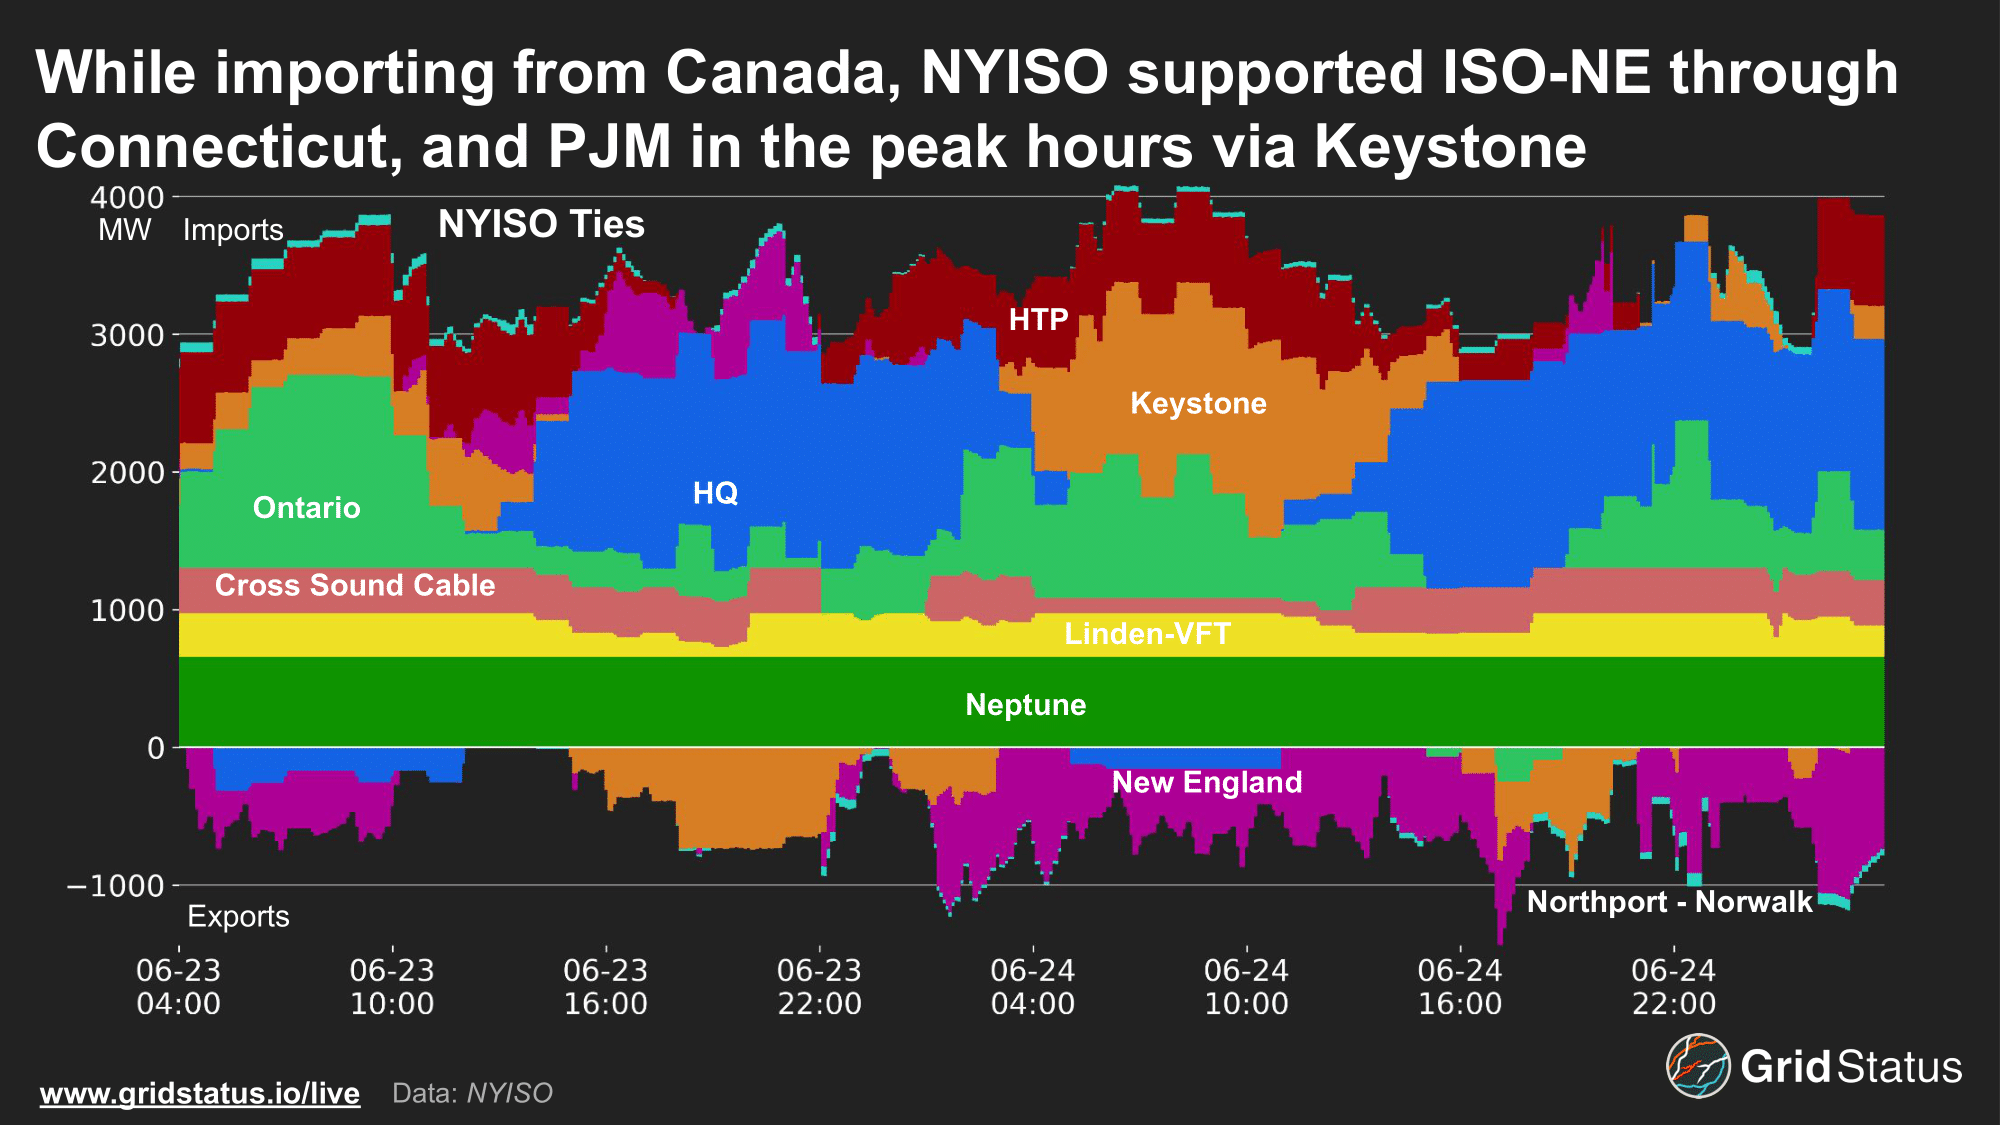
NYISO has two ties with ISO-NE that interconnect at Long Island, and a bundle of lines further upstate into Connecticut. The Cross Sound Cable (CSC) and Northport-Norwalk (1385) lines tend to flow towards NYISO because Long Island is often constrained. Meanwhile, the lines further upstate tend to export into ISO-NE. PJM tends to be more one-sided, often supporting NYISO. Neptune, Linden-VFT, HTP, and Keystone are PJM proxy buses. The first three are more of individual direct connections into the city area, not fully flexible connections in both directions. Keystone is different, supporting exports from NYISO when the conditions work out in that direction.
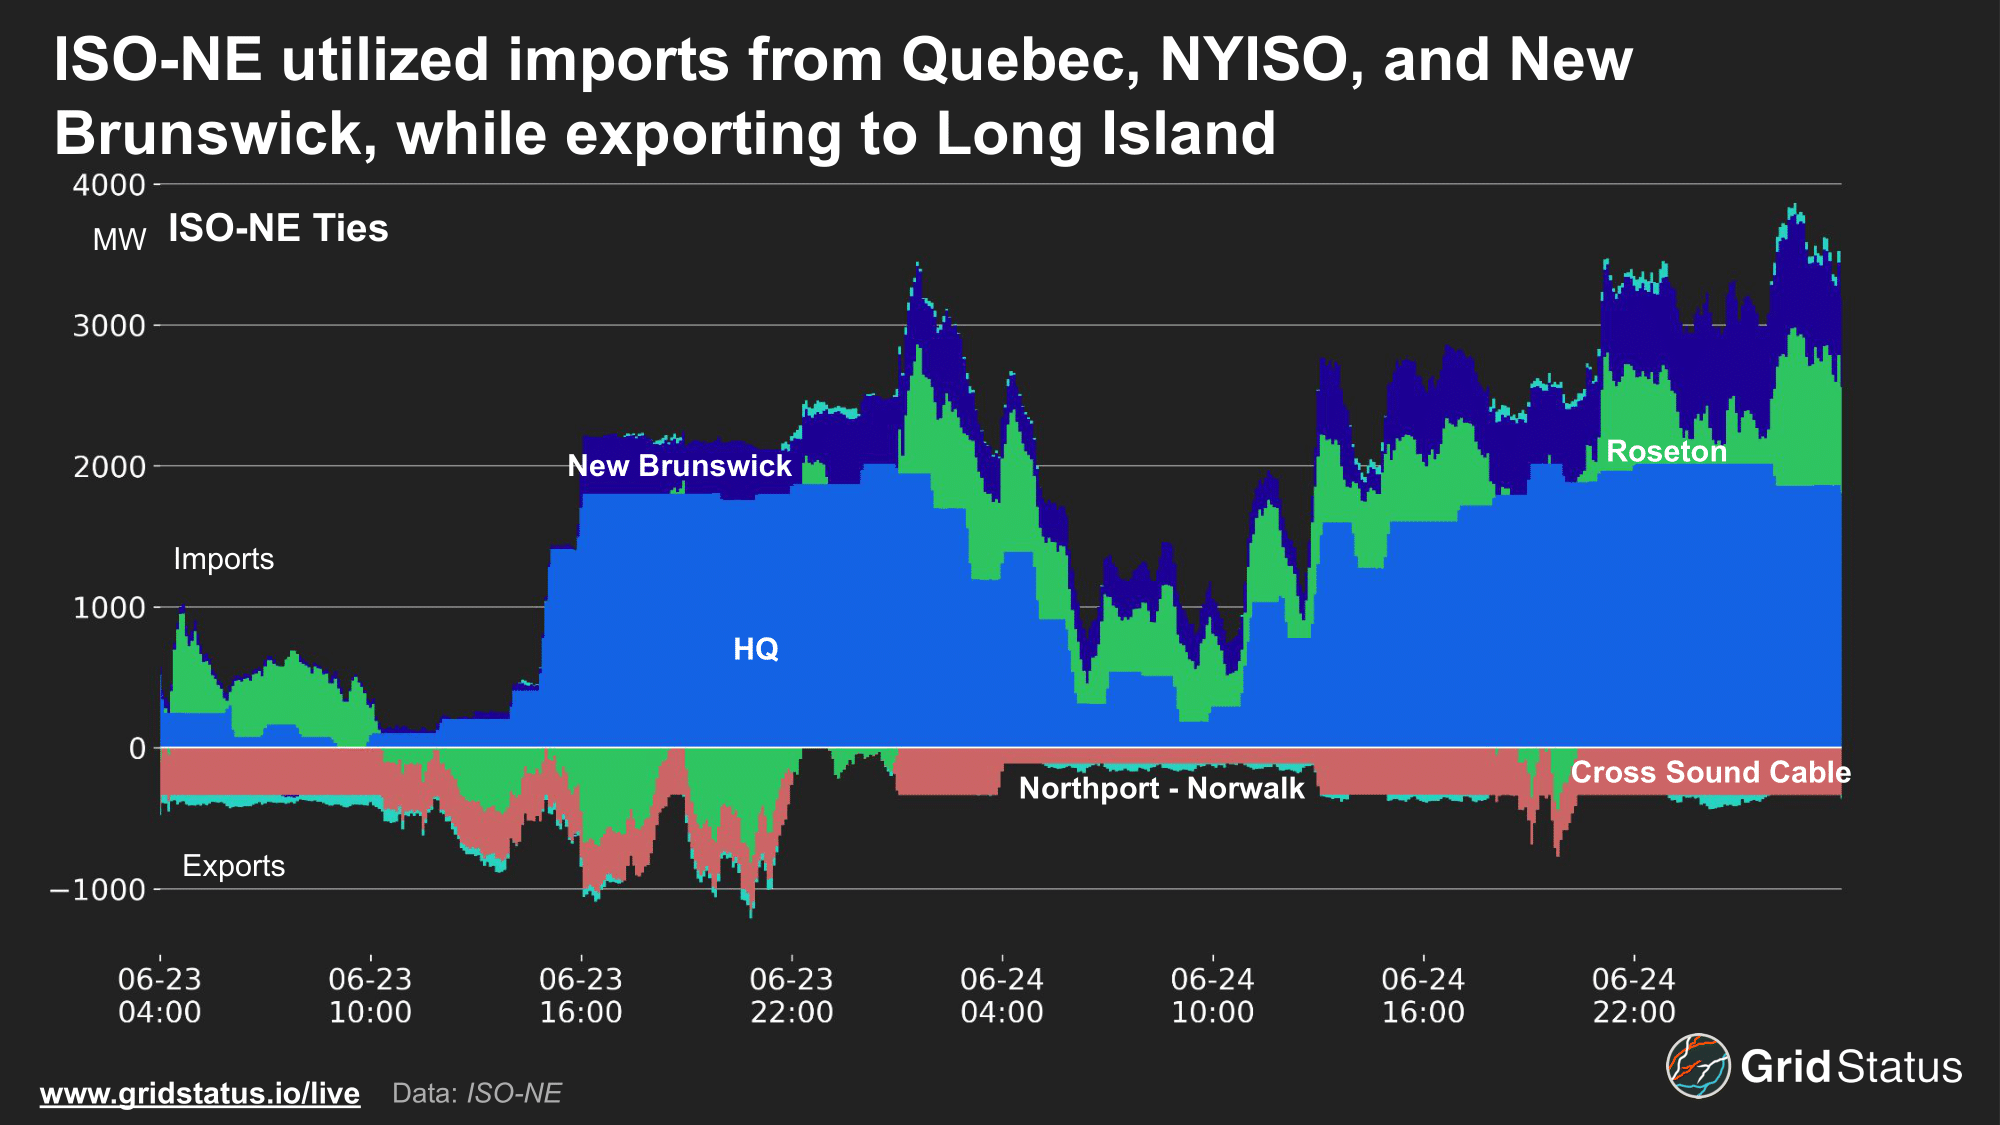
ISO-NE was its typical net consumer, with substantial imports from Canada as well as New York, although it continued to support Long Island via the Cross Sound Cable and the 1385 for much of the event. Imports from both Hydro-Quebec and New Brunswick picked up substantially compared to shoulder season operations, returning to the levels regularly seen during summer high load conditions.
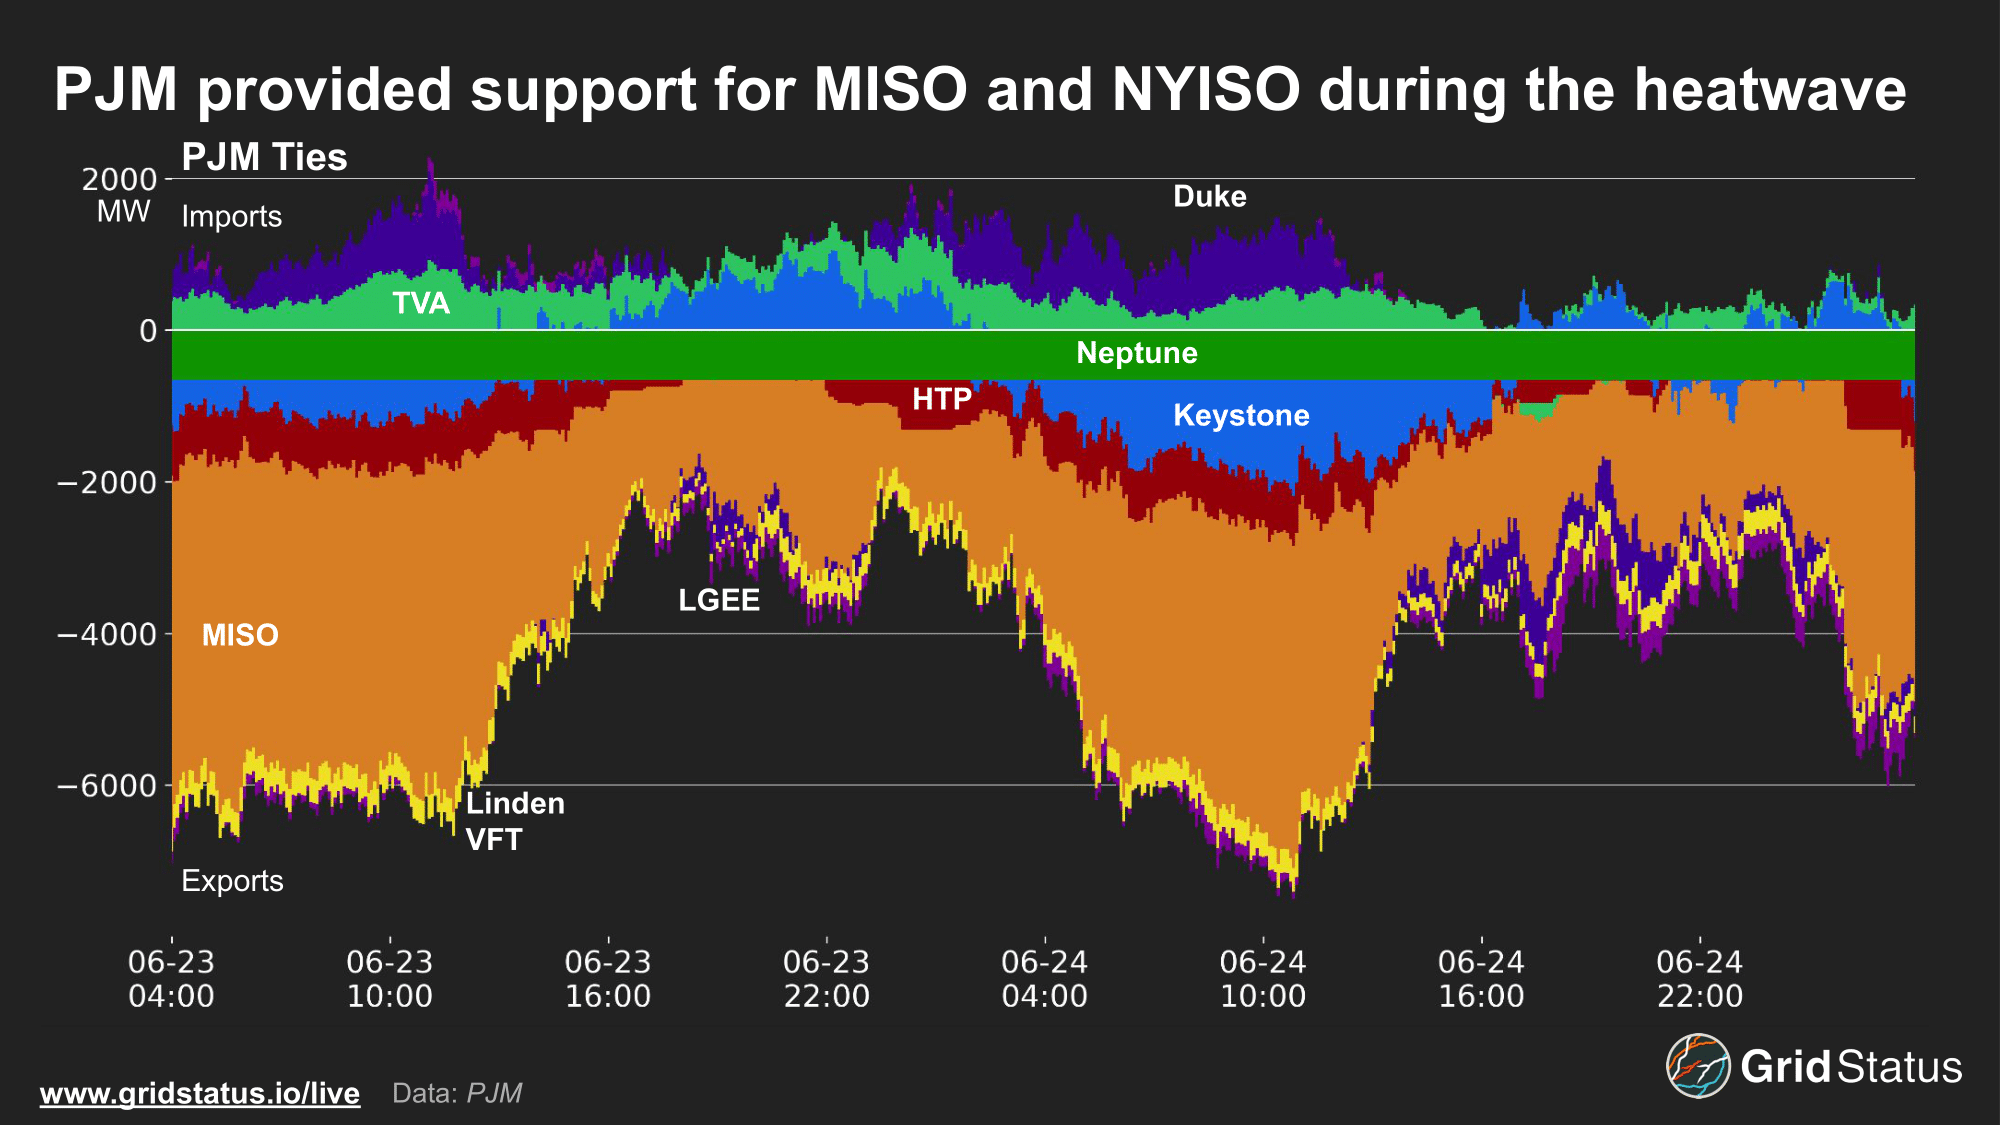
PJM is the non-Quebec summer workhorse of the region, exporting large amounts of power into MISO, and to a lesser extent NYISO, while also receiving flows from some non-market areas and dealing with wheelthroughs across the RTO’s split territory. One interesting note are the imports from NYISO via the Keystone interface around the peak demand times on each day, flipping from the typical exports.
In terms of the non-market authorities, during the morning periods PJM was importing from Duke balancing authorities, but in the evening shifted to exports. While limited in terms of data, Duke’s system stress was evident from its receipt of an emissions-limit waiver from the Department of Energy in anticipation of declaring EEA2 during the event.
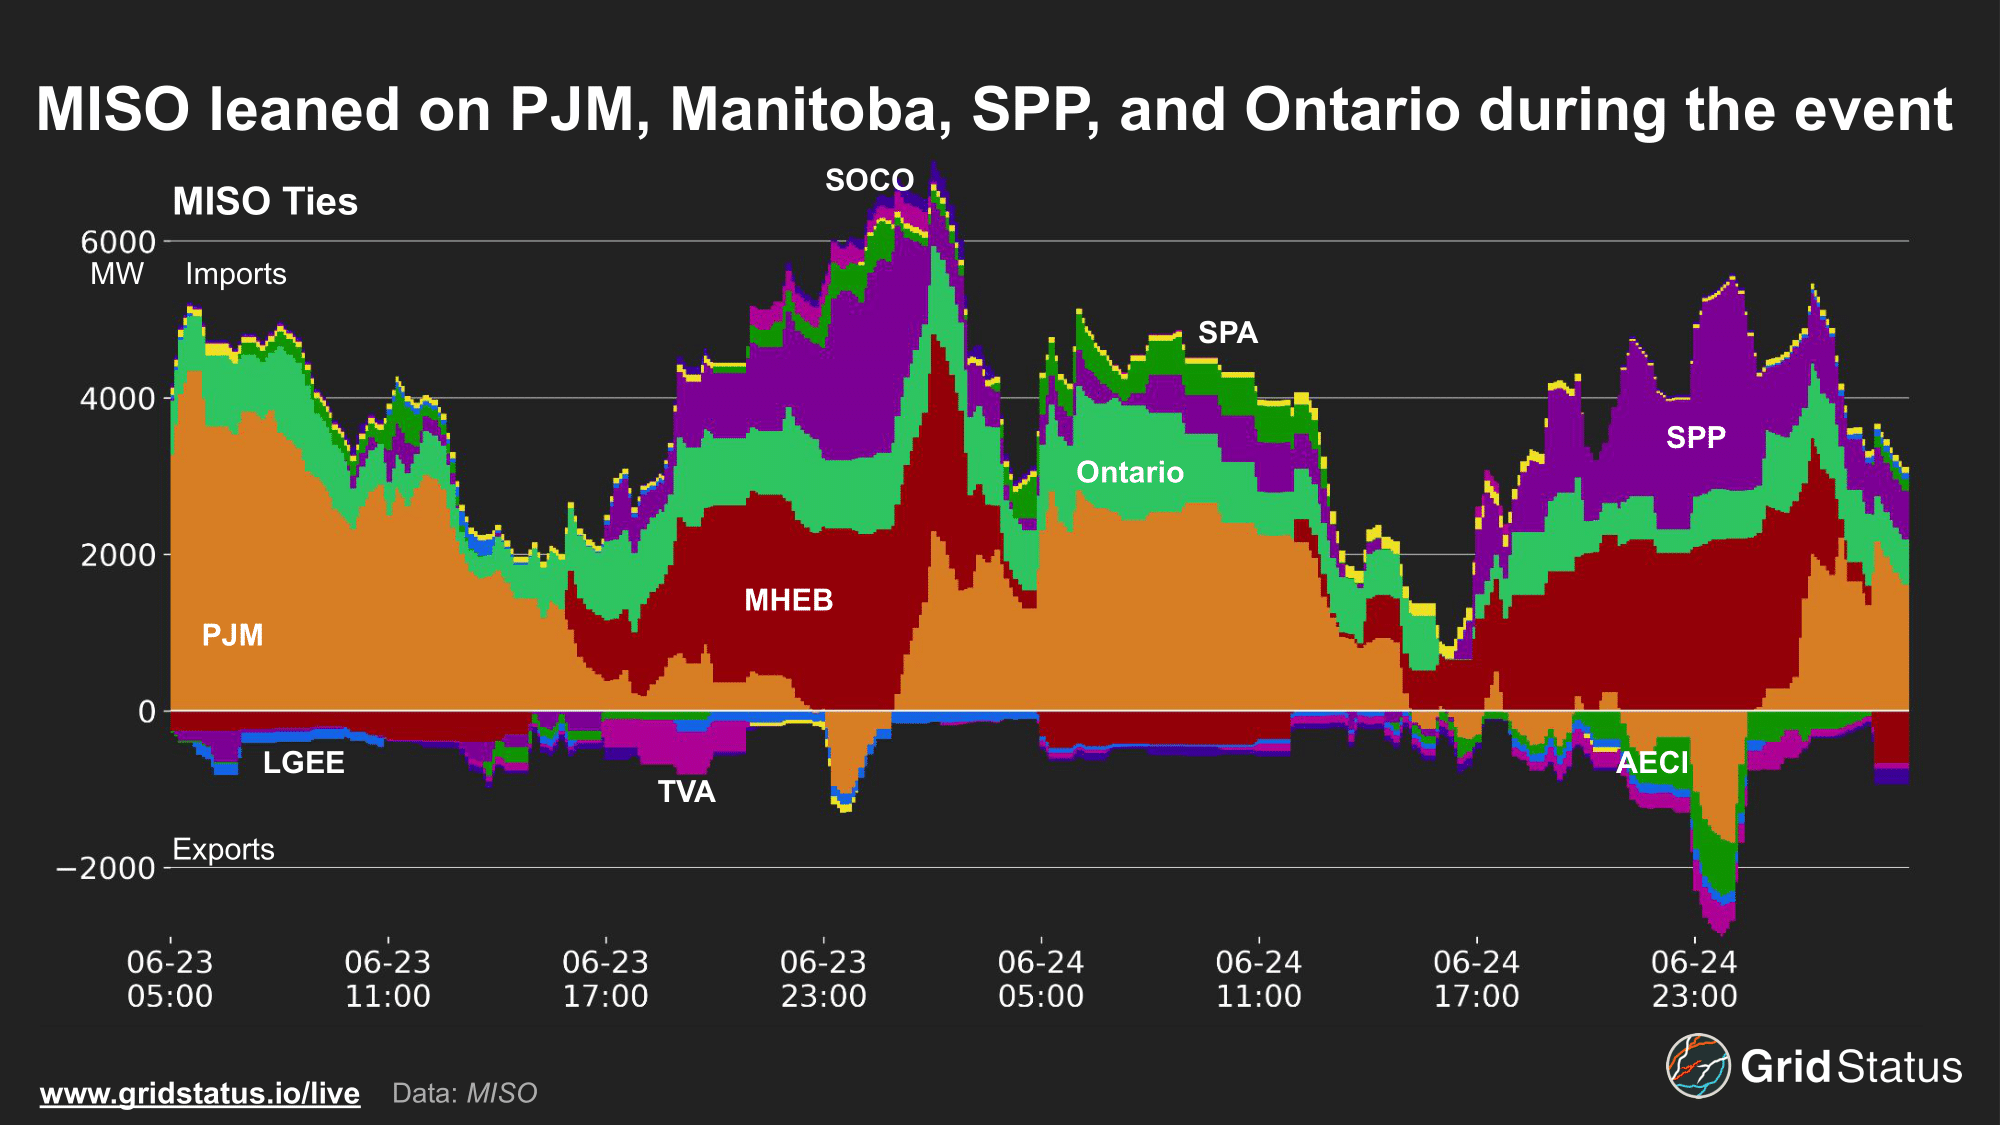
MISO imported substantial amounts of power throughout the event, particularly from PJM during off-hours. SPP, Manitoba (MHEB), and Ontario also supported MISO, particularly when imports from PJM dried up during the RTO’s own peak conditions. MHEB is Manitoba Hydro, which is utilized as an External Asynchronous Resource (EAR). Like PJM, MISO is also interconnected with non-market regions such as TVA and Southern Company (SOCO).
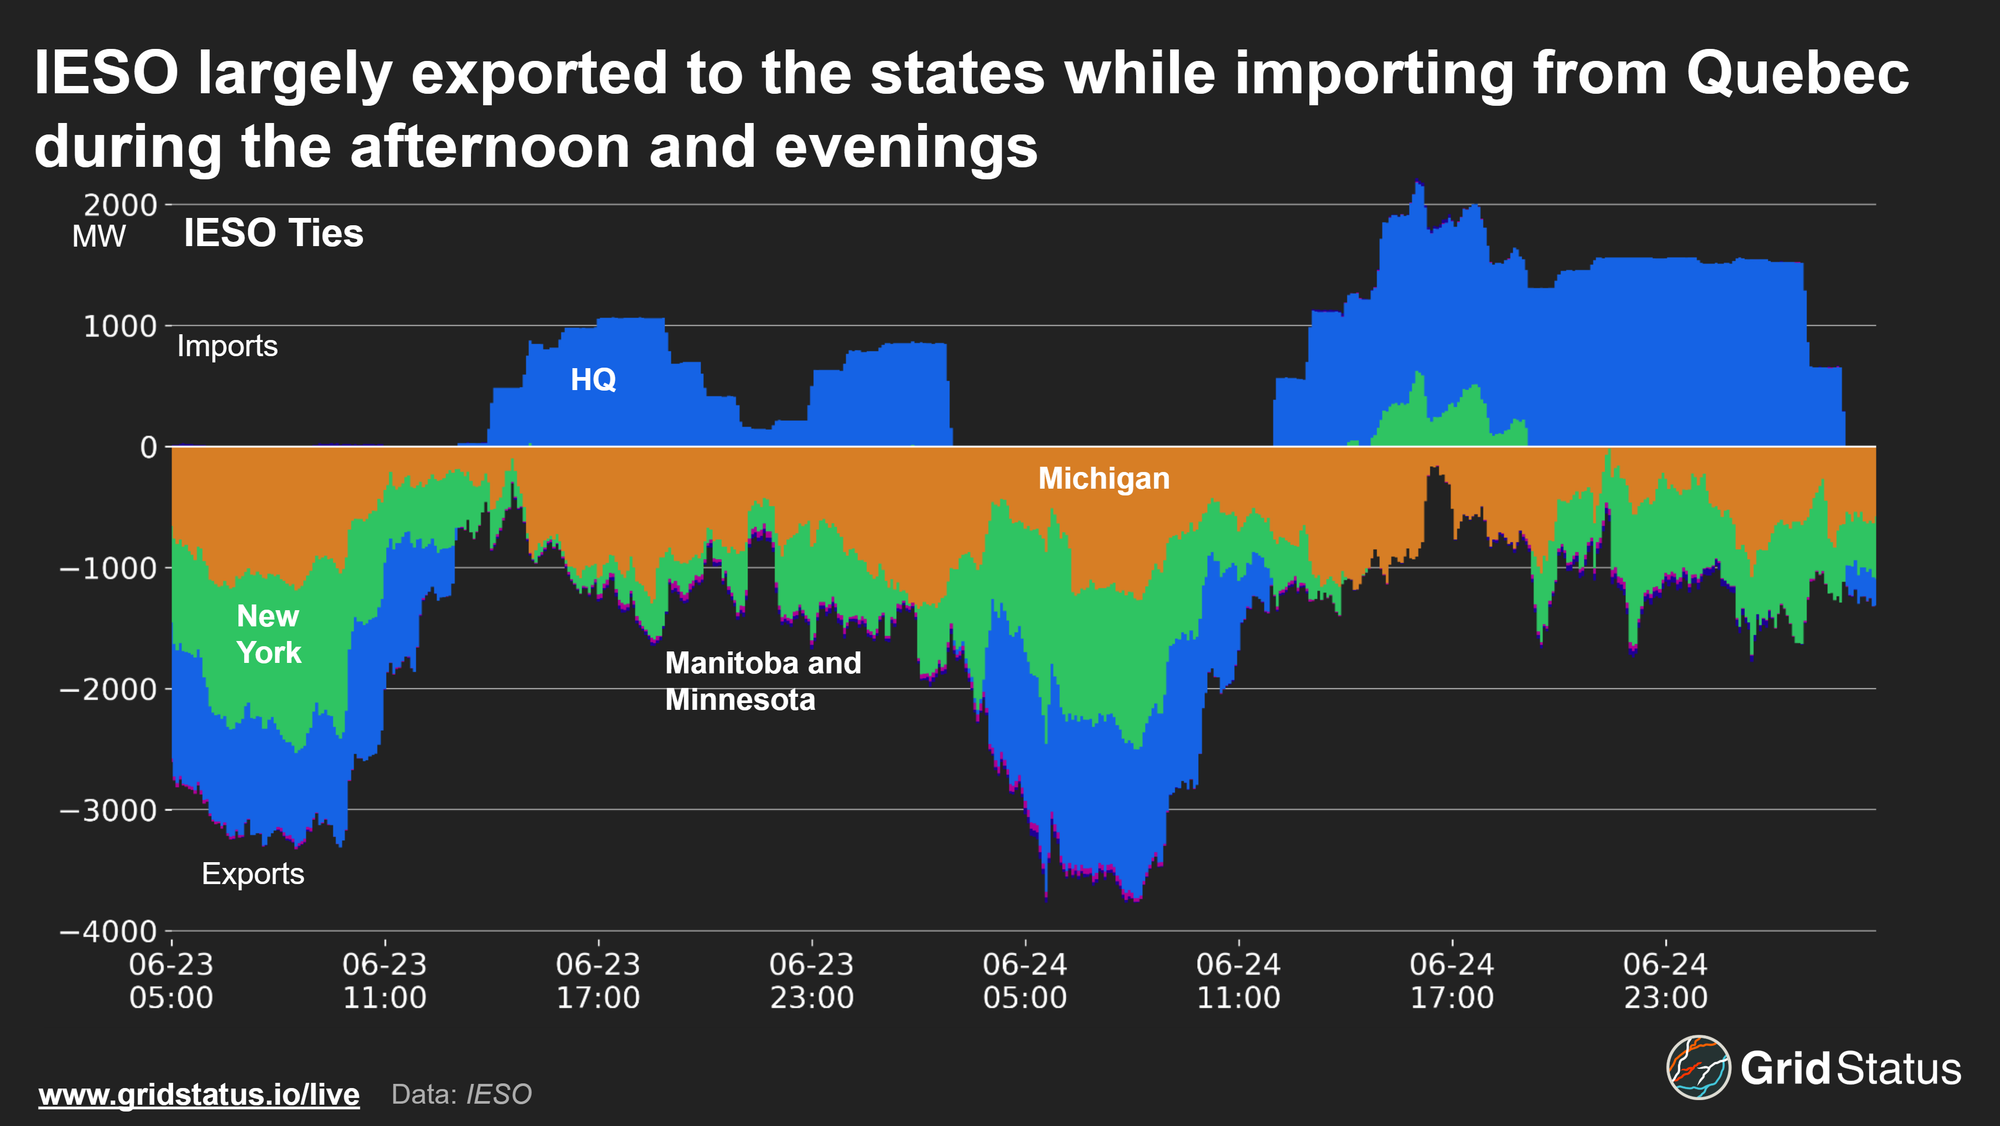
IESO (Ontario) fulfilled its normal role of exporting to the USA despite heat that pushed demand past a “normal” summer peak load forecast. This did flip on one occasion, as the evening of the 24th saw imports from NYISO. IESO also exported to Hydro-Quebec from off-peak hours into the late morning, while importing during the afternoon and evening. The Manitoba and Minnesota interfaces are fairly small, but do help to supply some fairly remote regions.
Sounding the Alarm
Given the relatively accurate long-range forecasts, grid operators had ample time to prepare for this week’s strong demand. As confidence in the severity increased, operators began issuing advance notices and taking emergency actions.
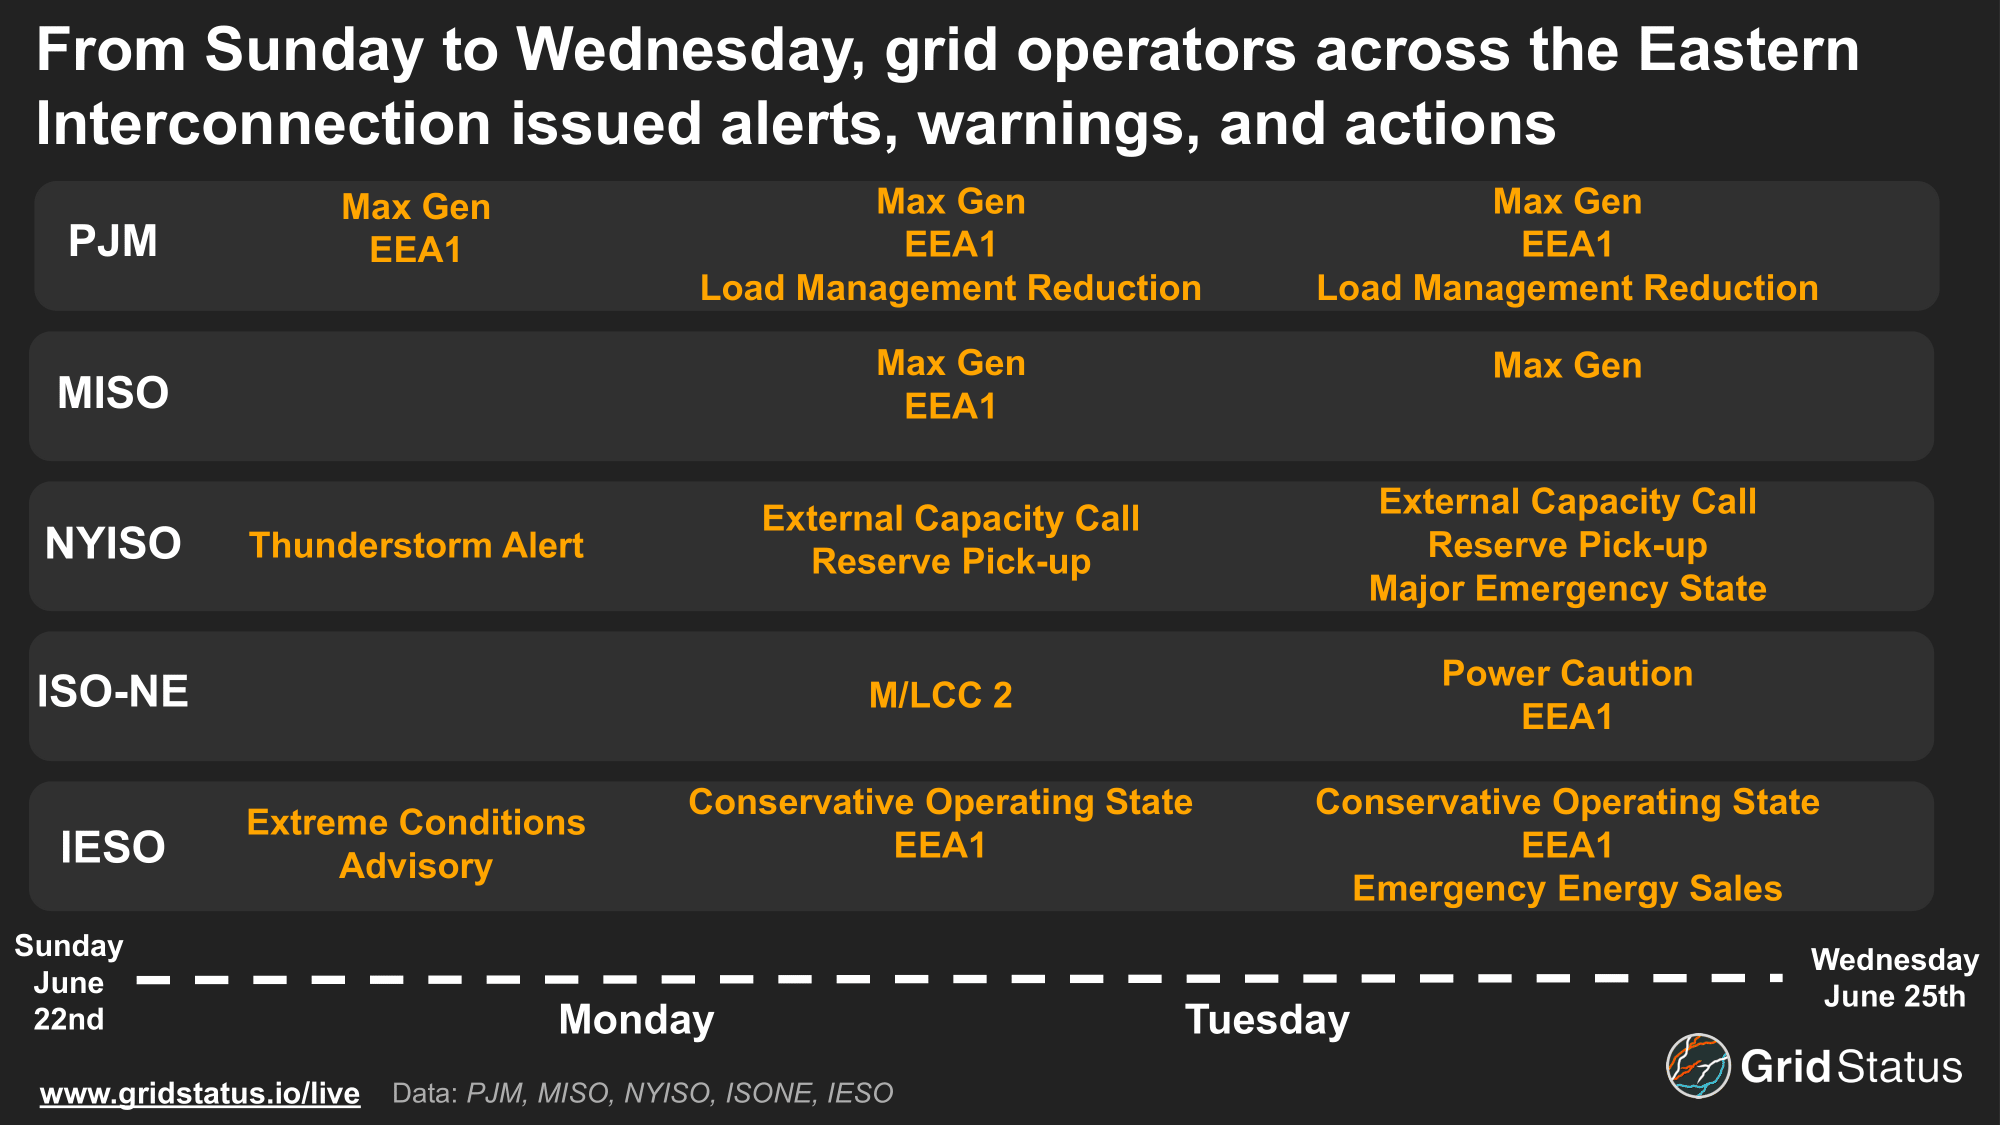
In addition to the above, multiple ISOs reached into their load management bag to quell the highest peaks. PJM activated demand response programs across the RTO on the 23rd and 24th, limiting it to eastern areas on Monday, but issuing DR notifications for more than 10 zones leading into the evening peak on Tuesday. NYISO also activated its Special Case Resources (SCRs), a class of demand response assets that participate in the ISO’s capacity auctions.
We’ve broken down the timeline of actions taken by operators in this drop-down section.
PJM
06.18.2025 08:22- Maintenance Outage Recall: This specific alert commits generators to return from maintenance outage ahead of a set deadline, specifically 12:00 on 6/21/2025. If a generator does not return as scheduled, its outage would be classified as a forced outage.
06.19.2025 11:00- Hot Weather Alert: Generators update unit-specific requirements ahead of extreme heat, specifically unit start-up lead times and eco min+max. Additionally, this alert encourages transmission outages to return to service. This alert is in place from 6/22/2025 00:00 to 6/25/2025 23:59 for the entire RTO.
06.22.2025 12:00- Maximum Generation Emergency/Load Management Action: Generators must alert PJM of their timeline to return to service from a planned outage. This action also placed PJM in an EEA1 from 6/23/25 07:00 to 6/23/2025 23:59.
06.23.2025 09:30- Hot Weather Alert: PJM extends the hot weather alert from 6/26/2025 00:00 through 6/26/2025 23:59.
06.23.2025 11:30- Maximum Generation Emergency/Load Management Action: PJM extends EEA1 through 6/24/2025 07:00 - 6/24/2025 23:59.
MISO
06/19/2025 10:12 Hot Weather Alert: MISO issues a hot weather alert for the Central and North regions from 06/21/2025 06:00 EST until 06/24/2025 23:00 EST.
06/19/2025 10:20 Conservative Operations: High temperatures and low expected reserve margins are expected system-wide from 06/21/2025 06:00 EST until 06/24/2025 23:00 EST. Generators and transmission operators are expected to bring capacity online and prepare for extreme conditions.
06/19/2025 10:29 Capacity Advisory Initiate: This alert was issued for the entirety of the ISO as a result of high temperatures. Generators are expected to notify MISO of fuel limitations and prepare for emergency conditions.
06/22/2025 13:05 Max Gen Warning: A combination of forced outages, limited transfer capacities, and high temperatures led to this being called for MISO North and Central on 6/23 16:00 - 22:00.
06/23/2025 05:15 Max Gen Event - Step 1b: This additional level of warning brought MISO to EAA1 status.
06/23/2025 12:39 Max Gen Warning: A combination of forced outages, limited transfer capacities, and high temperatures led to this being called for MISO North and Central on 6/24 16:00 - 21:00.
NYISO
Sunday Thunderstorm Alert: This alert is activated when there is or is a risk of thunderstorms in downstate New York that threaten transmission.
Monday: External Capacity Call Reserve Pick Up: NYISO activates this alert in order as a call for external regions to increase flows into New York.
Tuesday:
External Capacity Call Reserve Pick Up; NYISO activates this alert in order as a call for external regions to increase flows into New York.
Major Emergency State: This emergency posting indicates abnormal voltage, frequency, or other notable threats to the transmission system that require actions in order to maintain system reliability.
ISO-NE
Monday
M/LCC 2: ISO-NE issued a Master Local Control Center Procedure No. 2 indicating the potential for extreme conditions. Market participants were urged to limit any actions, such as maintenance, that could impact system reliability ahead of heat.
Tuesday
EEA1: ISO-NE declared an EEA1 event ahead of Tuesday’s demand peak.
Power Caution: An unexpected loss of generation was observed on the ISO-NE grid, which, based on fuel mix data, appeared to be coal and gas. This loss of supply triggered the Power Caution activation and activated reserves.
IESO
Sunday: Extreme Conditions Advisory: IESO issued this warning ahead of high heat, alerting market participants to threats ahead of taking any actions.
Monday: Conservative Operating State/EEA1: Due to high heat, IESO may cancel transmissions and generation outages due to expected peak load.
Tuesday: Conservative Operating State/EEA1: Due to high heat, IESO may cancel transmissions and generation outages due to expected peak load.
Emergency Energy Sales: IESO declared this event as it was selling energy to a neighboring balancing authority in order to maintain reliability. Given the timing, this region in question was likely NYISO.
Conclusion
Overall, grid operators were able to weather the heat. While there was price escalation in both local congestion and system-wide energy as load peaked, the situation never felt quite as dire as recent winter events. The lack of widespread forced outages was a large factor in reducing the overall risk profile; system reliability depends on reliable generators, and without the risk of fuel freeze-offs and unpredictable weather, all resources were able to contribute to meeting demand.
But this is only June. Temperatures typically peak later in the summer, and while this event already stands out against complete summers in recent years, there is no guarantee that we won’t see the return of widespread heat before autumn.
A (likely) new top-five load record in PJM is a big deal for a grid that hadn’t seen a top-ten summer peak in over a decade. Additionally, with the continued growth in new electric demand, more challenges will likely arise, even without once-in-a-decade weather. PJM, like ERCOT, is in the process of building out the regulatory structure to better understand and manage the Large Electronic Loads (LELs) now reshaping their grids.
Long-range transmission dreamers use the aspirational phrase “a grid bigger than the weather” to describe the complementary effects an interconnected region can unlock in terms of reliability. Events like these provide a great example of these benefits. The Eastern Interconnection is not entirely interconnected, and certainly limited in terms of transfer capability, but it’s closer to that phrase than any other part of North America, with neighbors leaning on each other and their ability to wheel power through interconnected regions.
As we look to the future, there is hope for certain transitional pains to be ameliorated. Few of these systems have an appreciable amount of energy storage, and the ability to smooth out the net load ramps should, eventually, shift net load peak pricing back down the merit order. For new demand, stricter rules on consumption and active management are likely to come into effect. For now, it’s an attempt at business-as-usual in a rapidly changing world.