In CAISO, Solar Generation Jumps Again While Batteries Reshape Demand
April 2025 saw another round of record solar and storage participation in CAISO. We’re taking a look at how these resources, on both sides of the meter, continue to reshape market dynamics across the Golden State.


For years, California has led the country in record-breaking solar adoption, both on rooftops and across grid-scale farms. But the dynamics of the state’s power system are once again changing fast. As solar matures, it’s no longer the sole story—battery storage is stepping in to redefine grid operations.
Balancing supply and demand is a core responsibility of ISOs and RTOs, and nowhere is the changing nature of that challenge more evi dent than in CAISO. Widespread behind-the-meter (BTM) solar, electric vehicle adoption, and a growing share of home battery systems have further complicated the delicate task of managing the dynamic grid of the world’s 5th-largest economy.
While gas generation provides immense flexibility, these units lose their marginal position as solar comes online and drives wholesale prices down. This leaves CAISO caught between a rock and a hard place: balancing the need to ramp down gas while intermittent solar spikes.
Now, battery systems are central to how the grid manages demand, mitigates curtailment, and handles extreme swings in net load. CAISO’s emphasis on coordinated dispatch has allowed grid operators to adapt to conditions that were once the subject of headlines: negative net load.
From shifts in grid-scale solar operations to changes in California’s BTM bonanza and CAISO's expanding role in the West, we’re continuing our annual tradition of breaking down how California continues to bring the grid of the future to the present day.
What is fueling CAISO’s energy transformation
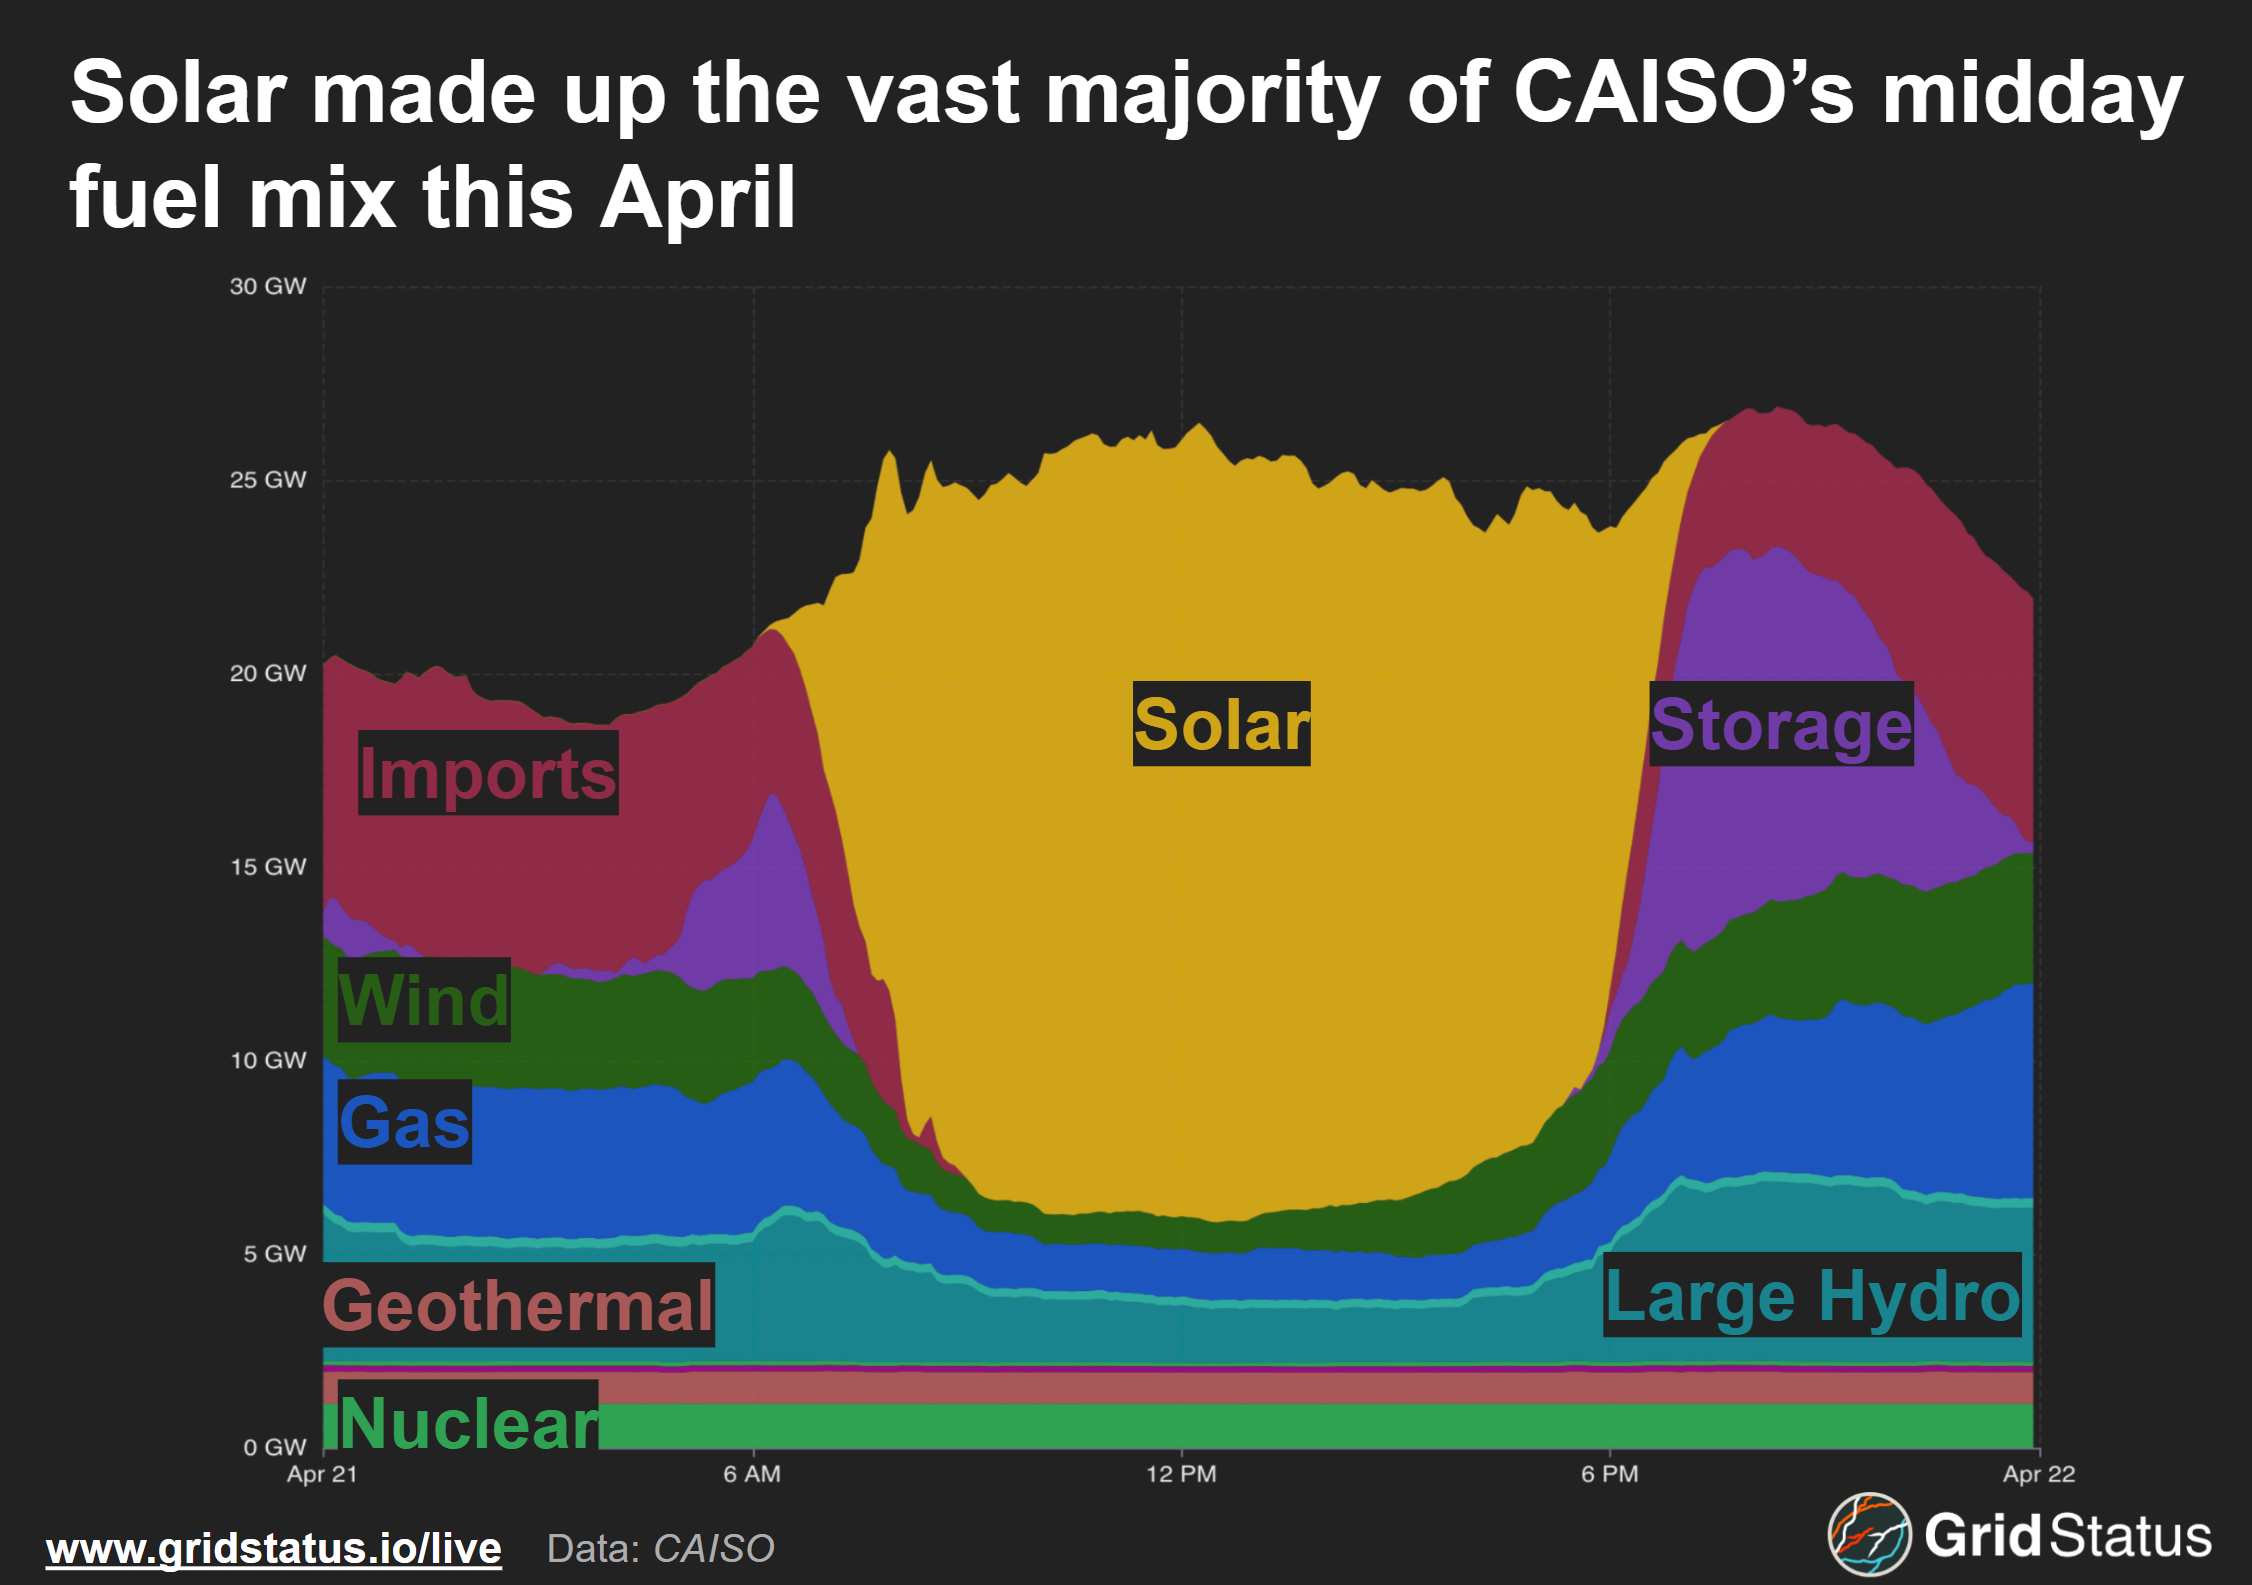
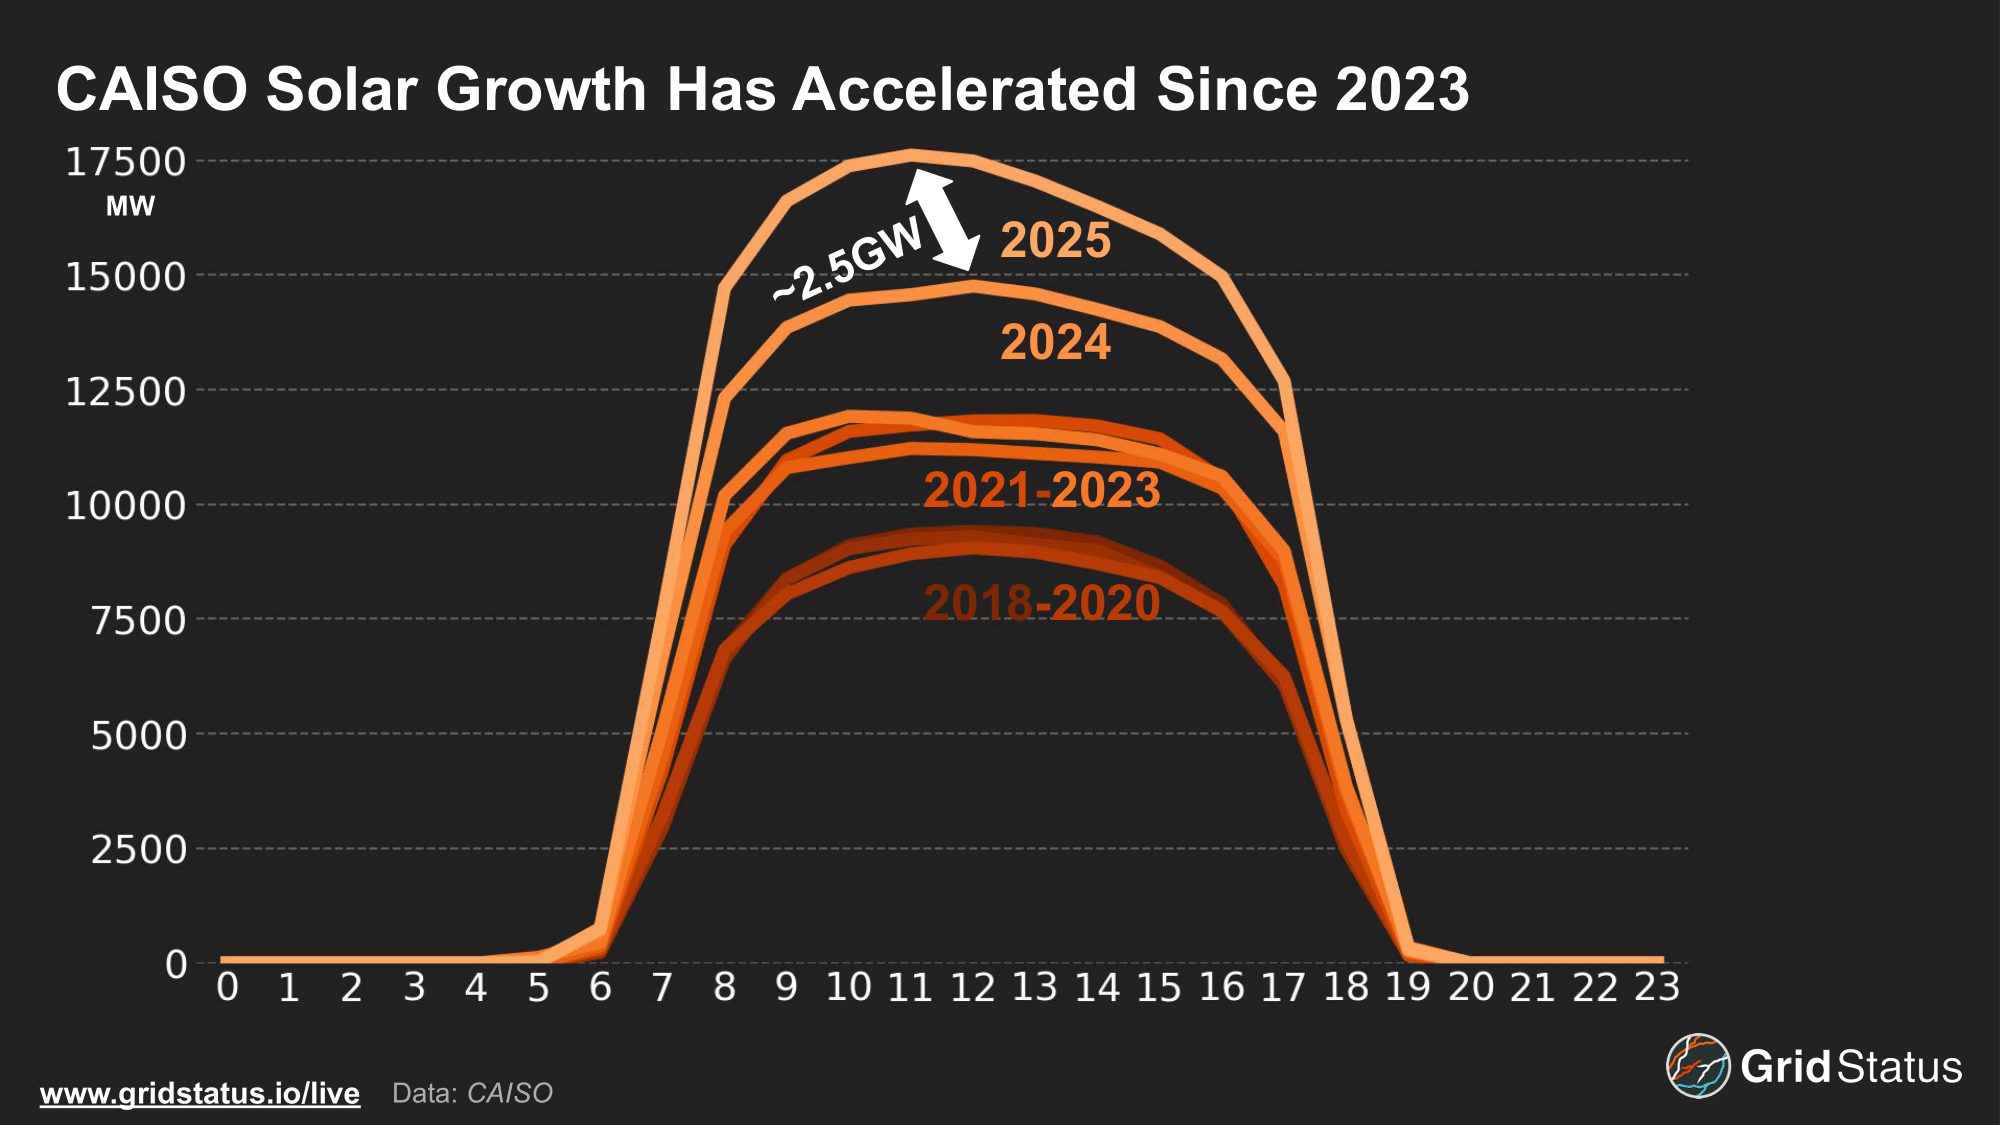
Solar generation continued to increase heading into April, rising 2 GW year over year. Generation levels peaked at 21 GW in April, and made up the majority of CAISO’s April fuel mix at 32%, doubling in less than a decade.
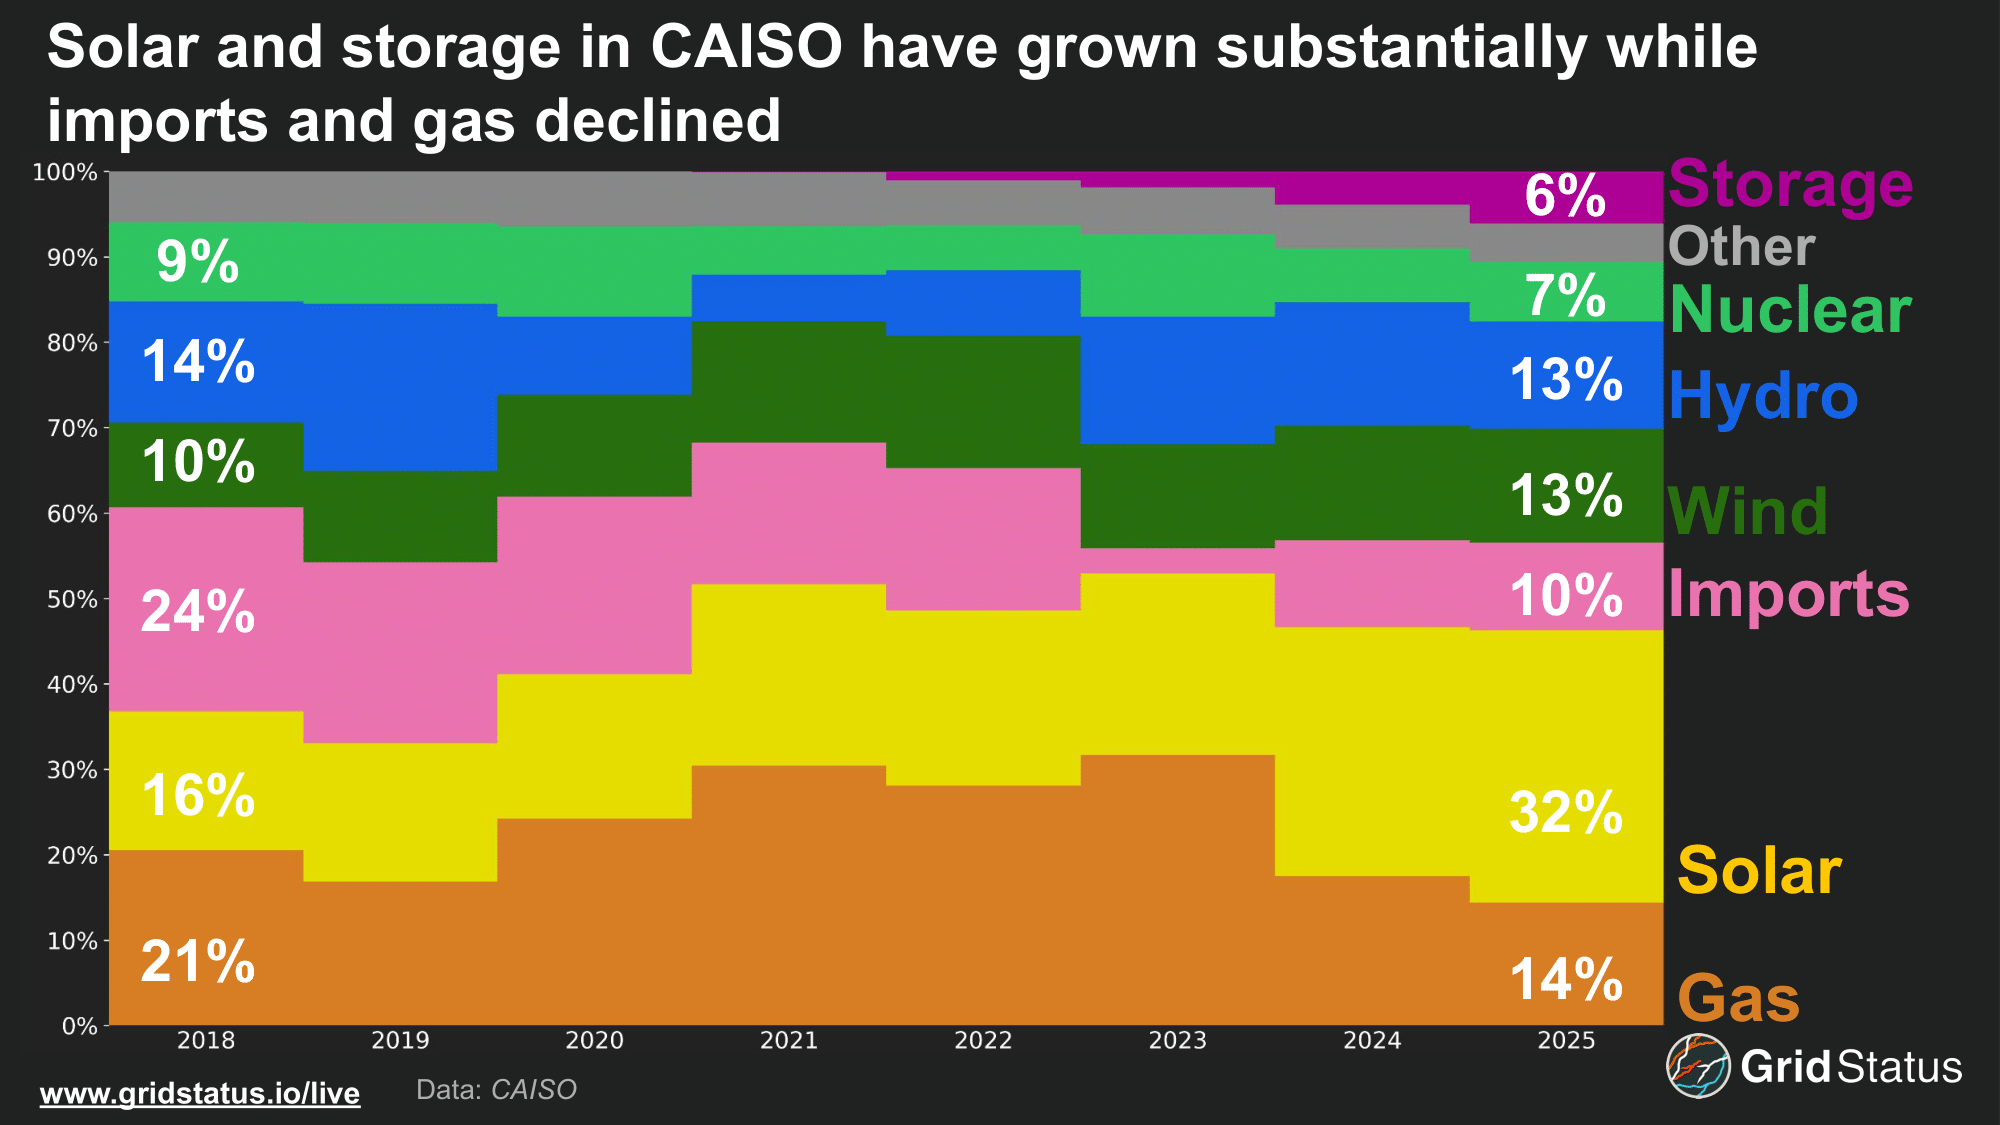
Natural gas saw a small but meaningful decrease from the previous year, but overall, the largest decline since 2018 has been imports. One of the biggest successes in California’s solar buildout has been a reduced reliance on imports (assisted by changing rules around resource adequacy). Less visible in the bulk monthly generation above is that solar and storage have driven wide daily swings in import behavior. That same storage now rivals nuclear generation in terms of total output, although it is important to keep in mind that batteries are net consumers, with an ~85% round-trip efficiency.
CAISO’s status as a single state grid operator gives the state legislature unique levels of involvement in system operations compared to multi-state ISOs like MISO. The CA legislature has a long history of proposing bold climate and energy bills, including one of the nation’s most ambitious energy efficiency codes, mandating that all new cars sold in the state by 2035 meet zero emission standards, and aggressive renewable portfolio standards requiring 60% of the states’s power to come from zero carbon resources by 2030 and 100% by 2045. Compare this to a region like MISO, which stretches partially across 15 states, with wide variation in state policy.
CAISO’s uniform voice, compared to the varying interests of legislatures from St Paul to Baton Rouge, allows operators to, in theory, better plan around statutes that impact current and future operations.
Within the singular voice of California is a cacophony of competing interests, both in front of and behind the meter. As we explore this April and the changes that led to this moment, we’re going to begin away from the wholesale grid, in the photovoltaic place where California still reigns supreme, distributed solar.
Behind the Scenes and Behind the Meter
The state legislature's outsized role in CAISO is not limited to grid-scale projects. Favorable weather, state incentives, and high consumer electricity prices continued to fuel BTM solar growth, albeit at declining rates.
According to the California Public Utilities Commission (CPUC), more than 16 GW of net energy metering (NEM) eligible BTM solar is installed across the state, with total capacity rising over 1600 MW since the previous year.
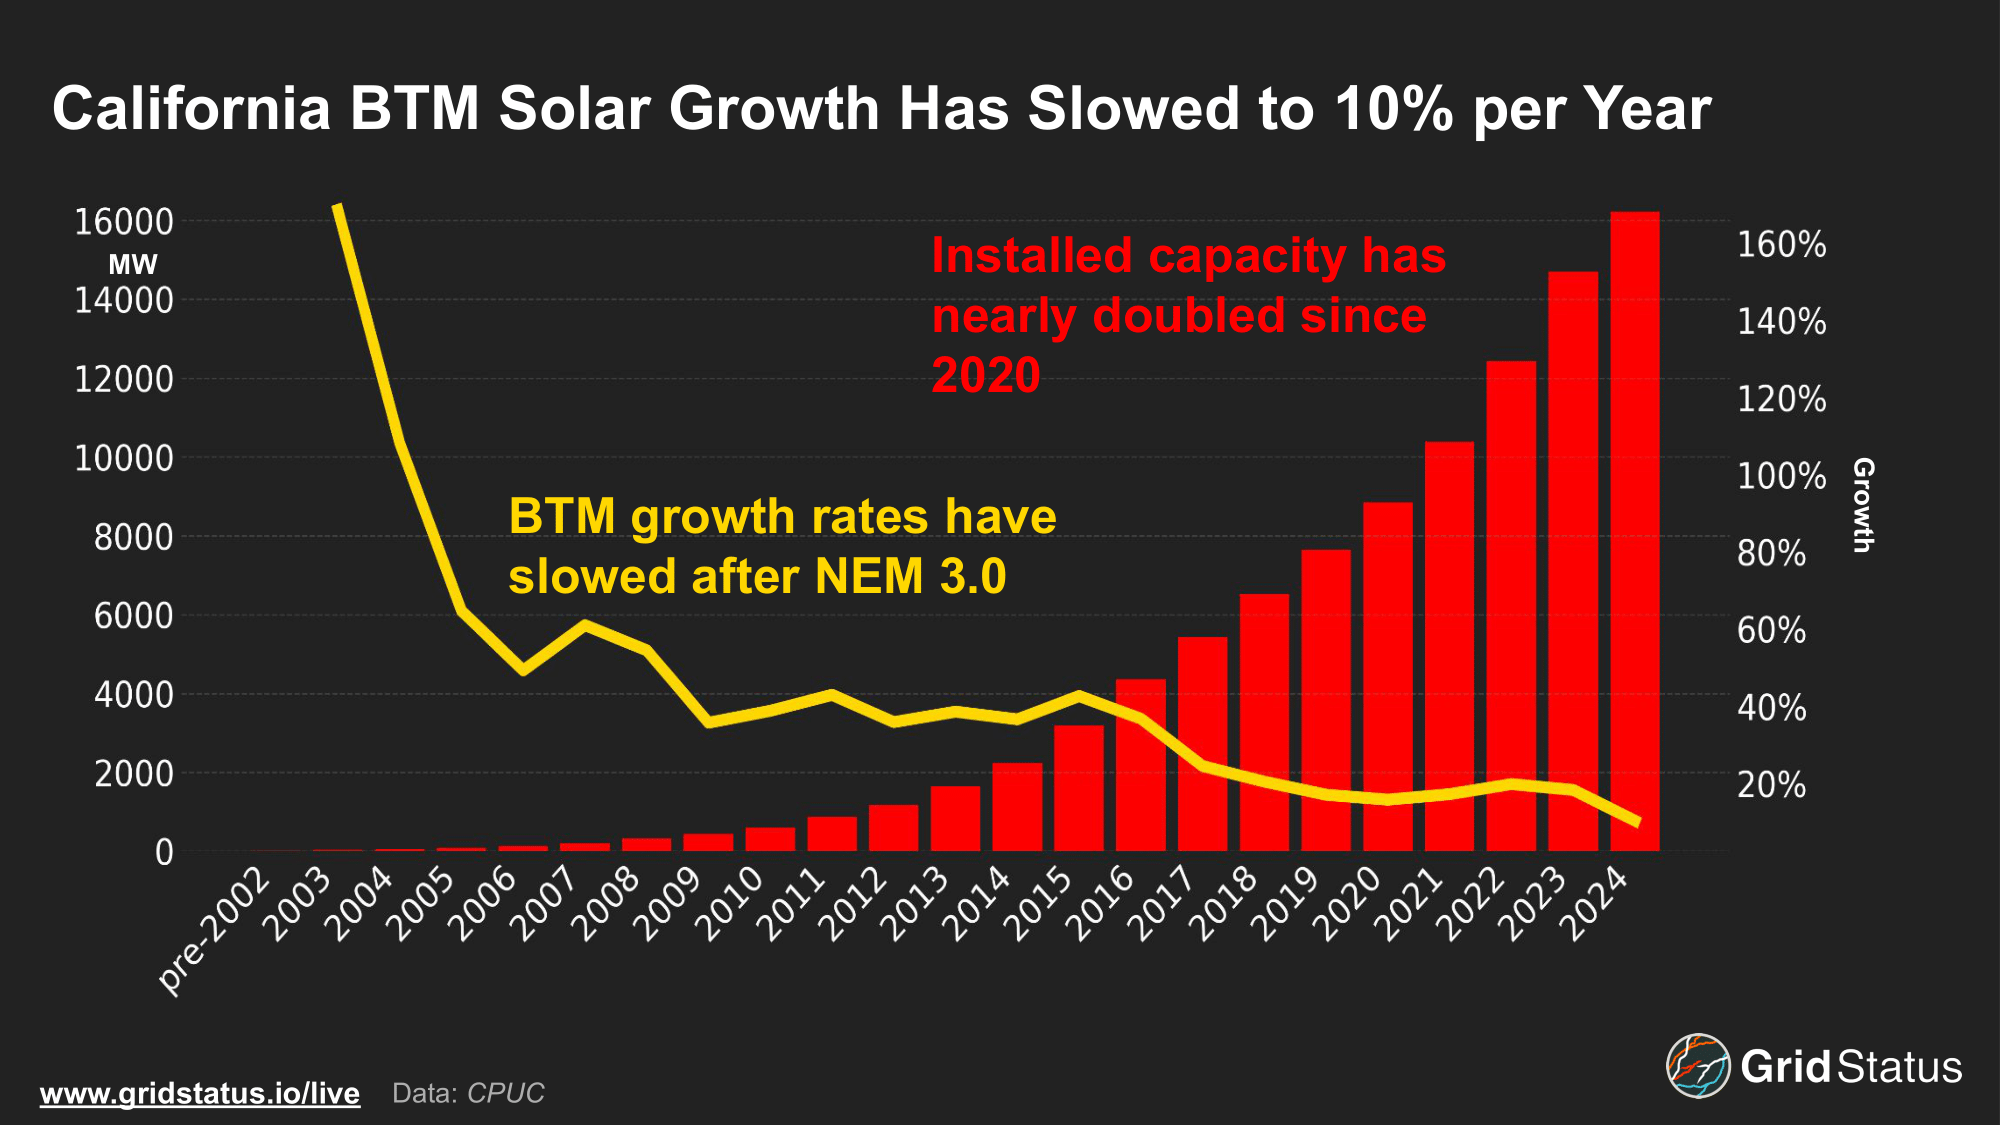
While BTM solar has continued to expand in California, recent policy changes have begun to slow the pace of new installations statewide. Unlike ISO-NE and NYISO, CAISO does not publish estimated daily BTM solar generation, although they have highlighted the need in comments to the CPUC. Melding the CPUC’s BTM growth with CAISO’s reported FTM increases, total solar generation increased by approximately 3.5 GW. This combined value brings total solar growth, adjusted for load levels, to less than the utility-scale increase alone in MISO.
BTM Policy Moves from Carrot to Stick
At the tail end of 2022, the CPUC approved a change in NEM payments for BTM systems. Under the previous system, known as NEM 2.0, energy exported to the grid was compensated at nearly a 1:1 ratio, effectively making the grid a limitless battery from the perspective of NEM 2.0 systems. In April 2023, NEM 3.0 went into effect, which reduced the value of power exported onto the grid for new BTM solar installations.
An intended consequence of this rule change was to incentivize residential battery storage systems, which it handily accomplished.
CPUC estimates nearly 3 GW of combined BTM solar + storage installations are active statewide, with the NEM 3.0 shift leading to a nearly 800 MW increase in BTM storage capacity from 2023 to 2025.
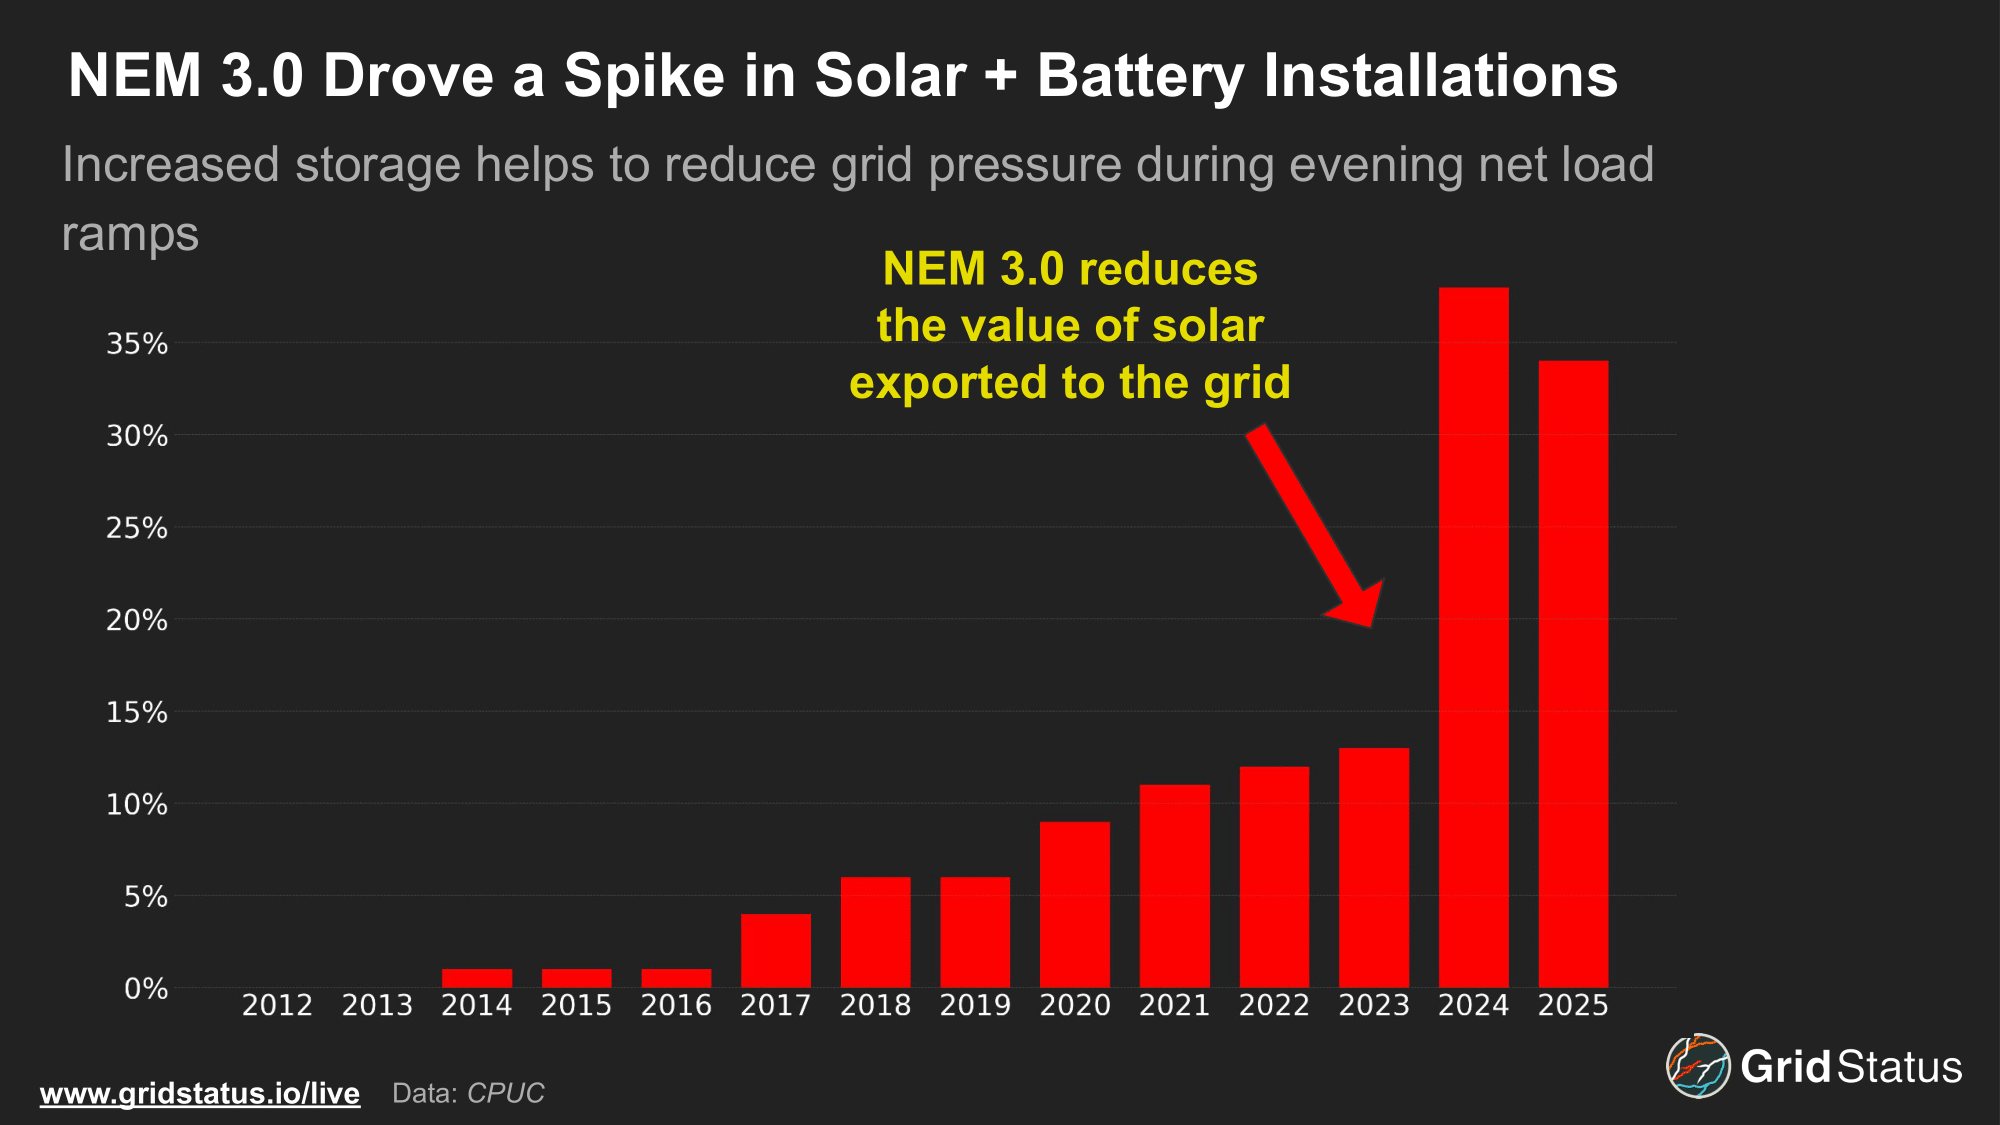
Solar + storage systems as a percentage of all BTM solar installs nearly tripled in the wake of NEM changes, and adoption rates remain over 30%. Importantly, CPUC notes that this data does not include San Diego Gas and Electric, which likely leads to undercounting. NEM 3.0 made the economics of home battery systems more attractive in a region with high rates and substantially reduced net metering incentives on an already solar-flooded grid. Instead, these systems enable users to discharge when their system, and the wider solar fleet, is not producing.
Adding to the economics of these home storage systems is the implementation of time-of-use (TOU) rates by utilities like Pacific Gas & Electric (PG&E) that charge consumers differently based on the time of energy consumption. These rates are highly correlated with the downramp in solar production, similar to MISO’s capacity accreditation.
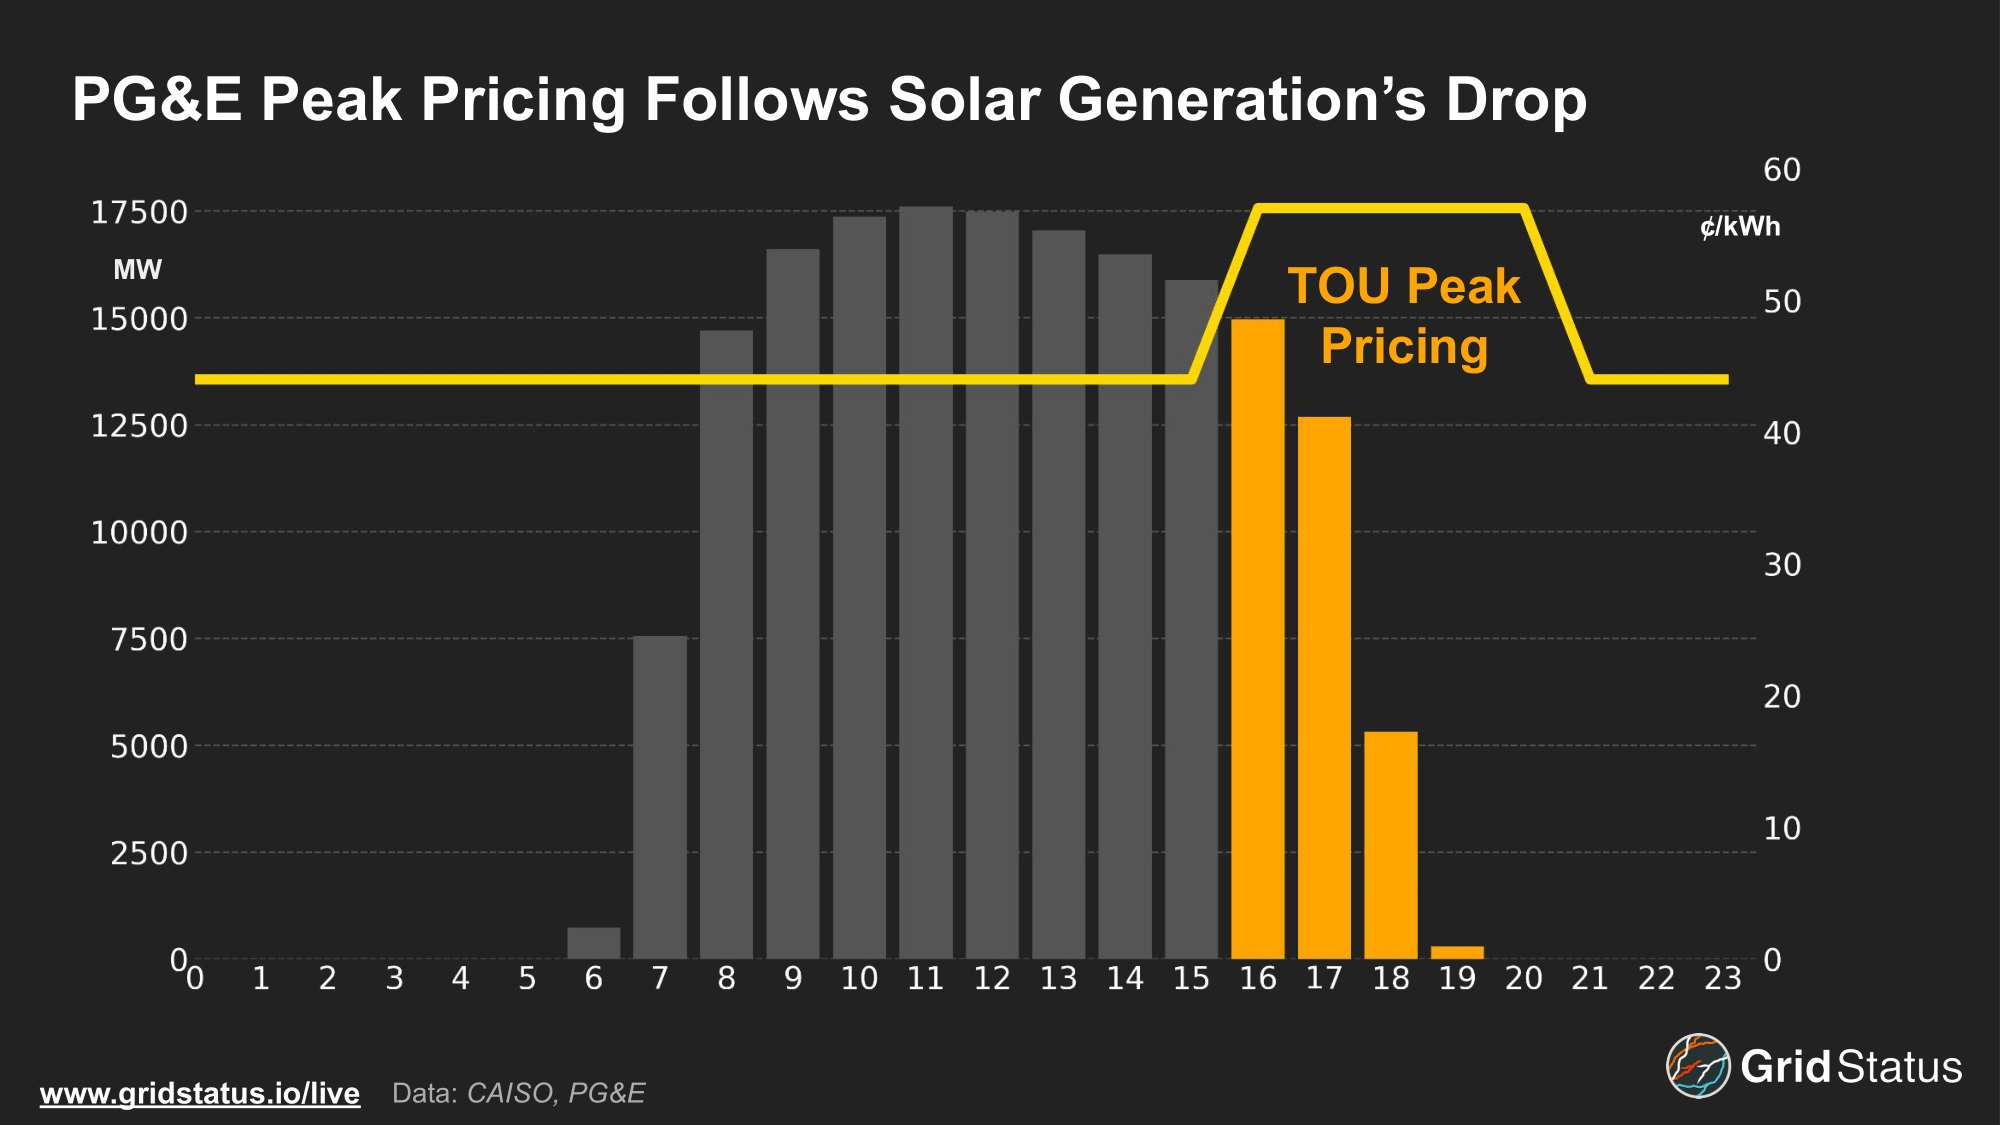
PG&E’s summer TOU rates see weekday pricing rise 13 cents during peak hours,17:00 - 21:00, to 57¢/kWh. Solar generation quickly drops in the hours preceding and during peak pricing, incentivizing home batteries to participate in energy price arbitrage similar to grid-scale storage operators, dispatching when prices and load are highest to maximize ROI, in this case, reducing exposure to higher evening utility rates.
Increased BTM storage capacity will shape grid load in new ways, as customers rely less on the carrot of net metering and instead look to avoid the stick of peak pricing.
From Duck to Loon
The growth of BTM solar is easily seen by looking at the recent history of CAISO’s load curve.
BTM solar carves a deep midday trough, bringing early afternoon demand nearly 6 GW weaker than it was in 2018. While most years saw meaningful load drops, this was not the case in 2025.
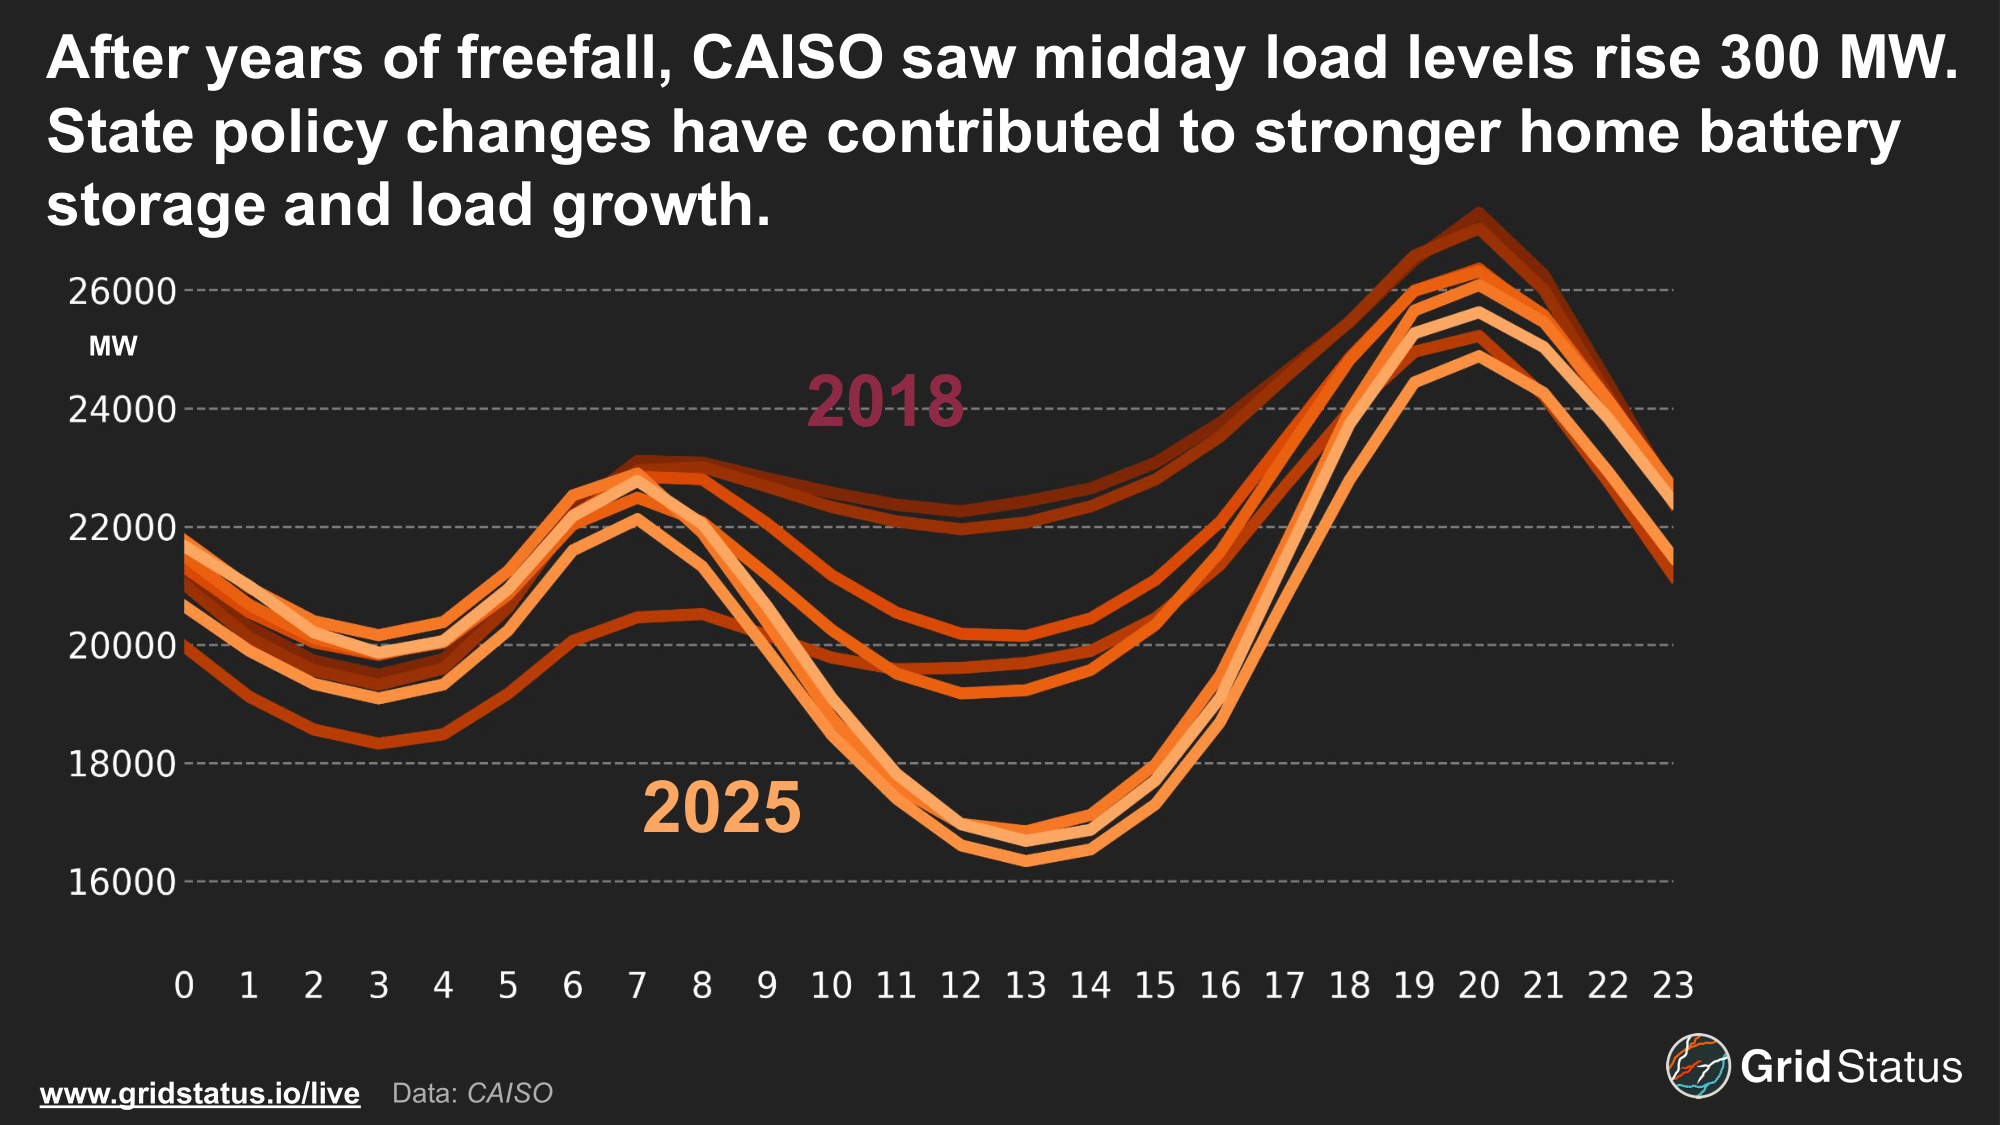
Excluding the immediate impacts of COVID-19, April 2025 was the first year since 2018 when CAISO’s midday load increased, rising ~300 MW this year. Any demand growth in the last decade has been more than offset by new BTM capacity, but with declining installs under NEM 3.0 and the growing need for power, that may no longer be the case.
While tariff changes for customer-owned BTM systems may have helped keep metered load levels flat, net load reveals a more complex picture. This April, rising utility-scale renewable generation pushed CAISO net load to its lowest and most negative level yet.
Net load is a measurement of system load minus wind and solar. This metric provides a clearer view of how much load is met by wind and solar versus thermal generation. In the case of CAISO, negative net load implies a surplus of renewable generation on the grid during the afternoon, which CAISO has in spades.
While the term duck curve was initially coined to describe CAISO load levels in the early 2010s as BTM solar adoption increased, the average net load curve seen this year has sunk below the water line, more akin to a dense-boned loon. CAISO averaged negative net load levels from 10:00 to 15:00 as consumer load was met by utility-scale solar generation.
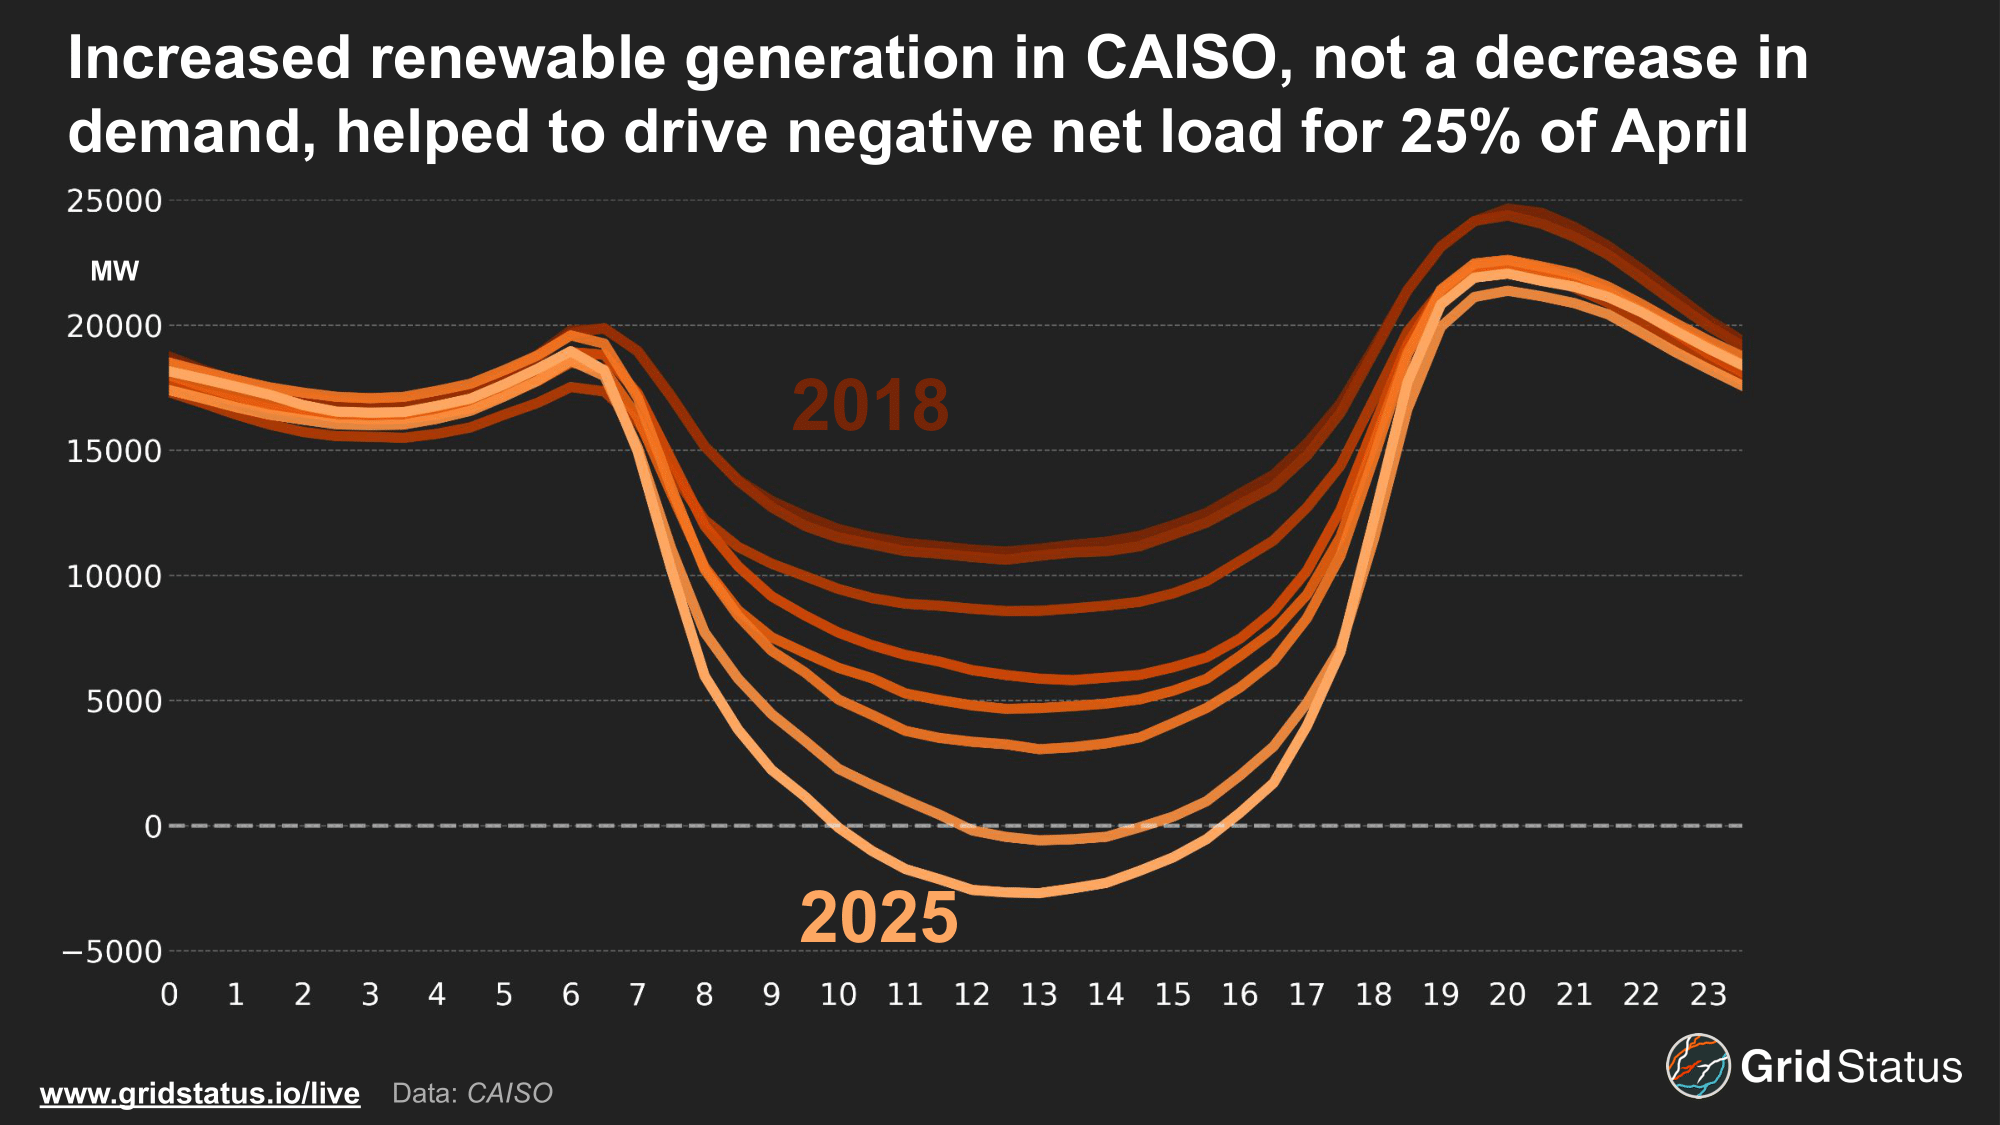
CAISO has seen total load levels fall by 6 GW, with the net load valleys from 2018 to 2025 now over 13.6 GW apart.
Deepening negative net load levels drive wide swings for CAISO operators. The average day in April saw net load levels swing well over 24 GW in 8 hours, putting additional pressure on dispatchable generation. While these swings complicate the already challenging task that is managing the grid, the growth of battery storage has proven to be synergistic for CAISO.
Uplift on the Demand Fault
As CAISO’s fuel mix continues to evolve, battery storage has become an integral tool to manage the state’s unique resource mix. Storage levels increased by ~4 GW heading into this April and each diurnal peak or trough increased by multiple gigawatts over 2024.
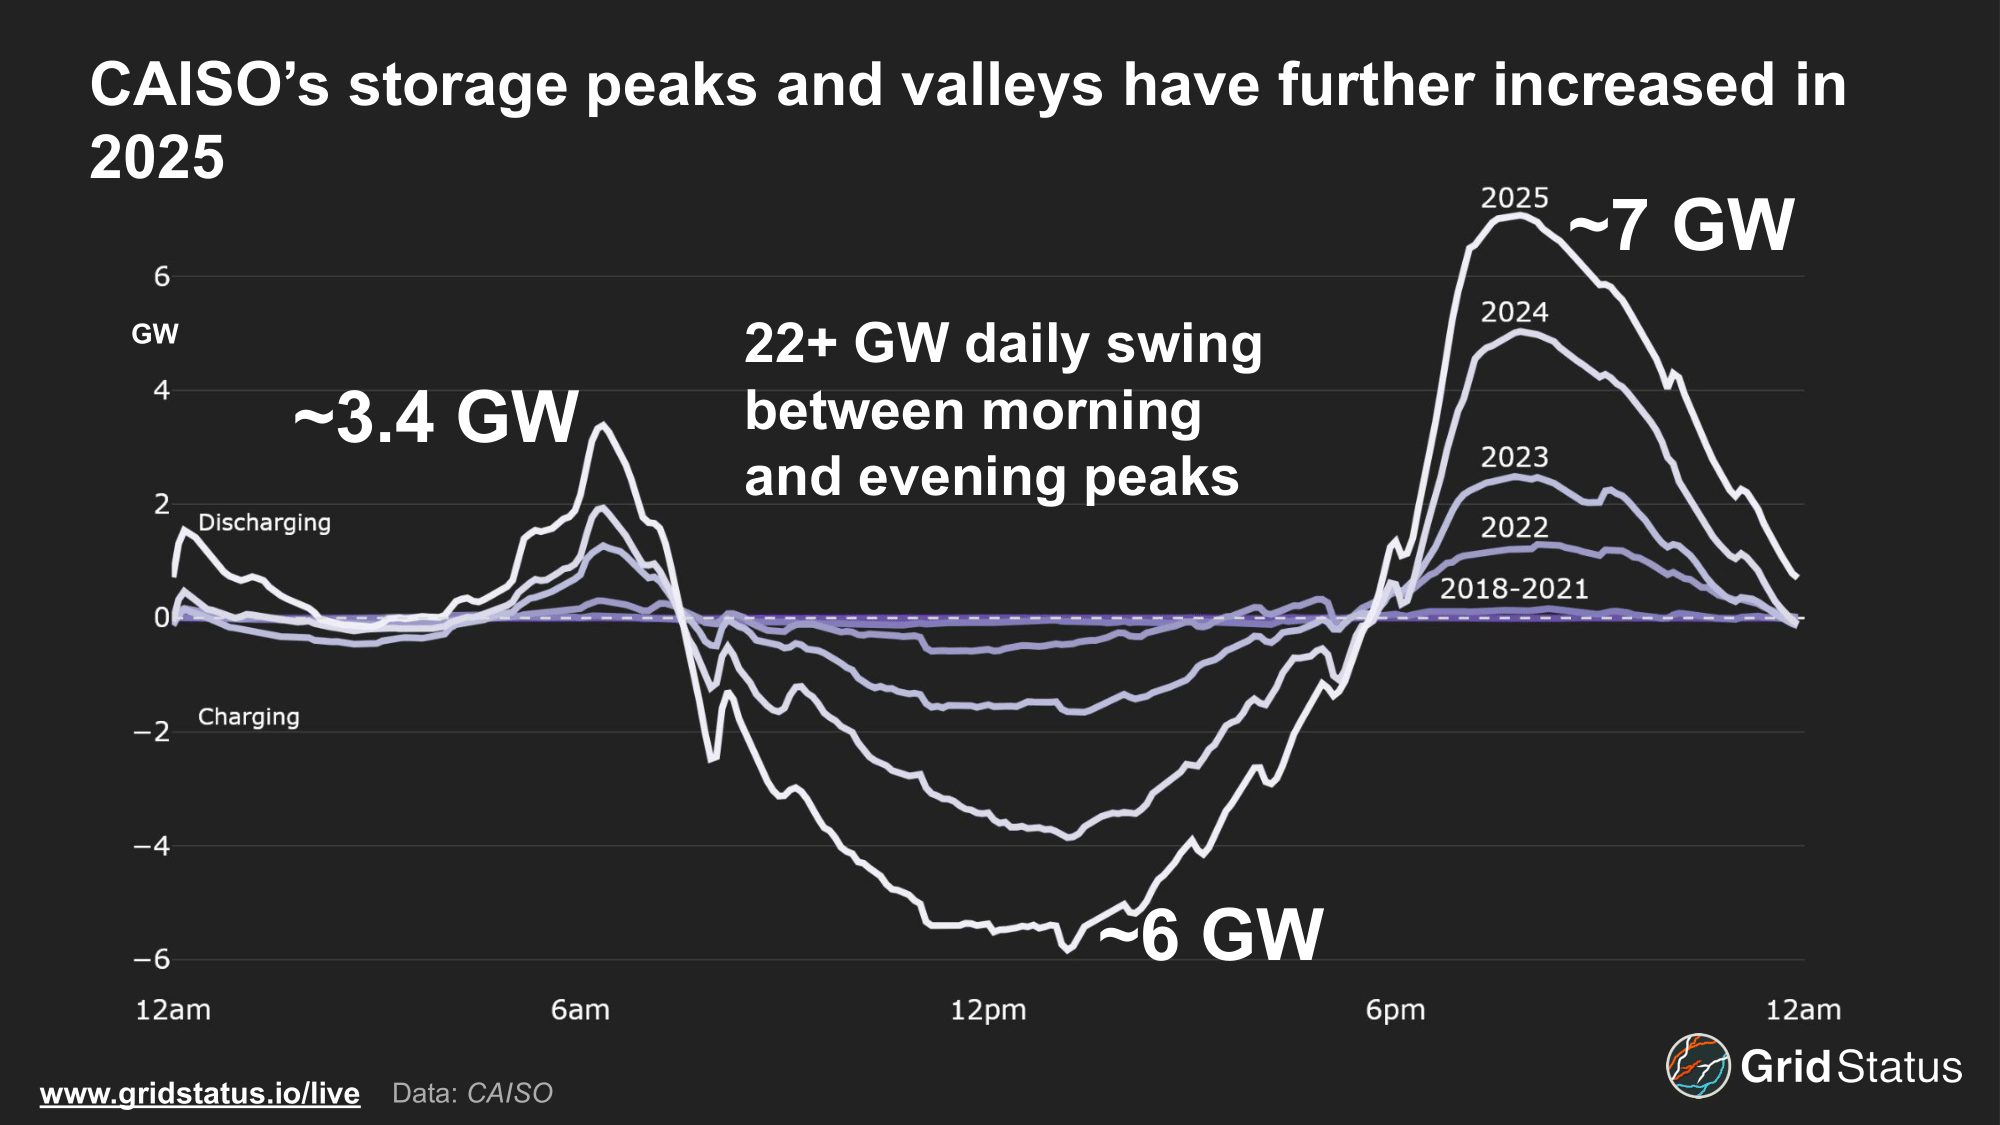
In California, the importance of batteries extends beyond discharge into their demand patterns. While CAISO publishes multiple “load’ datasets, taking a look at the CAISO Load Hourly dataset, which includes charging, paints a fuller picture.
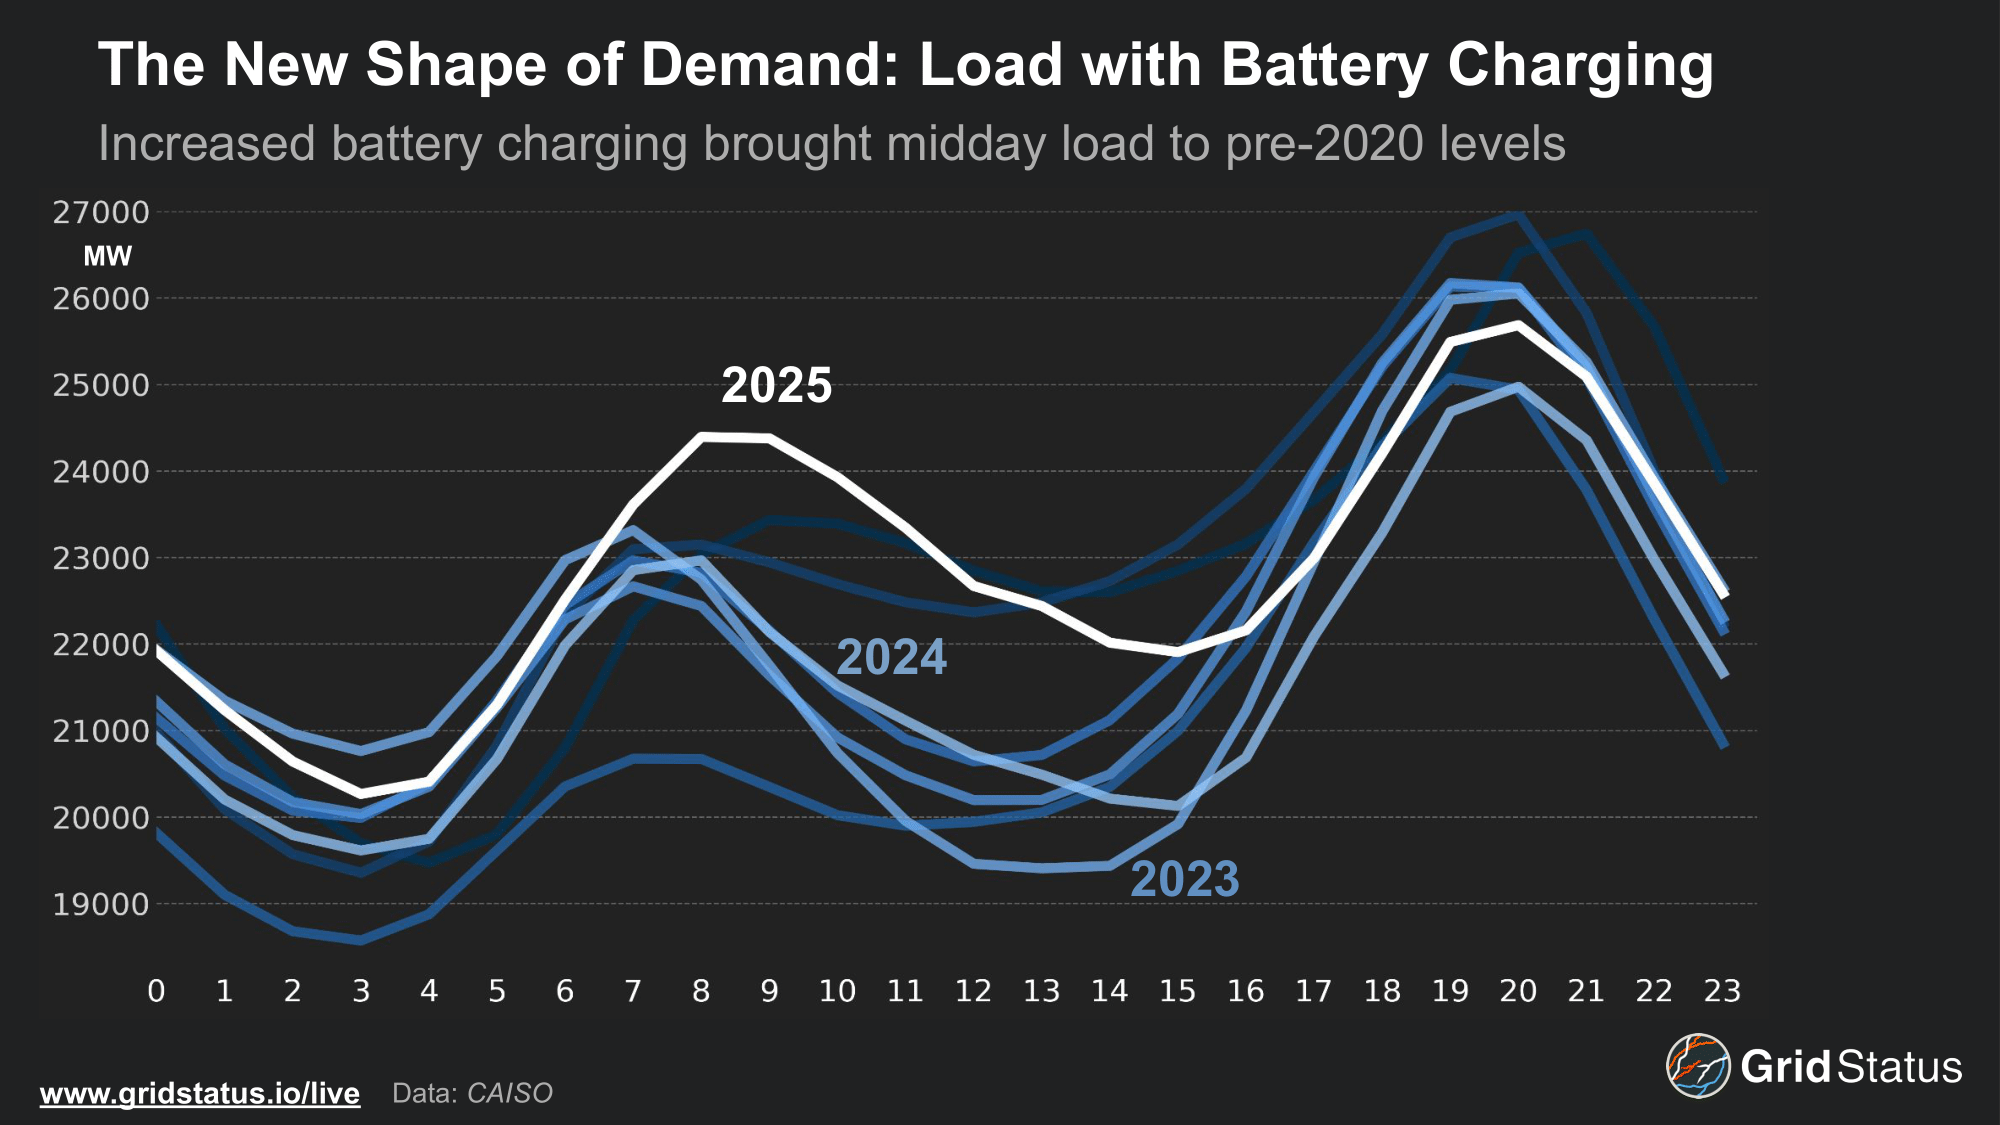
In April 2025, CAISO load including demand from batteries supercharged morning load. The morning peak became even more pronounced, peaking as solar comes online. Midday charging continued the trend we noted last year, with the morning downramp and minimum shifting ~2 GW up year-over-year.
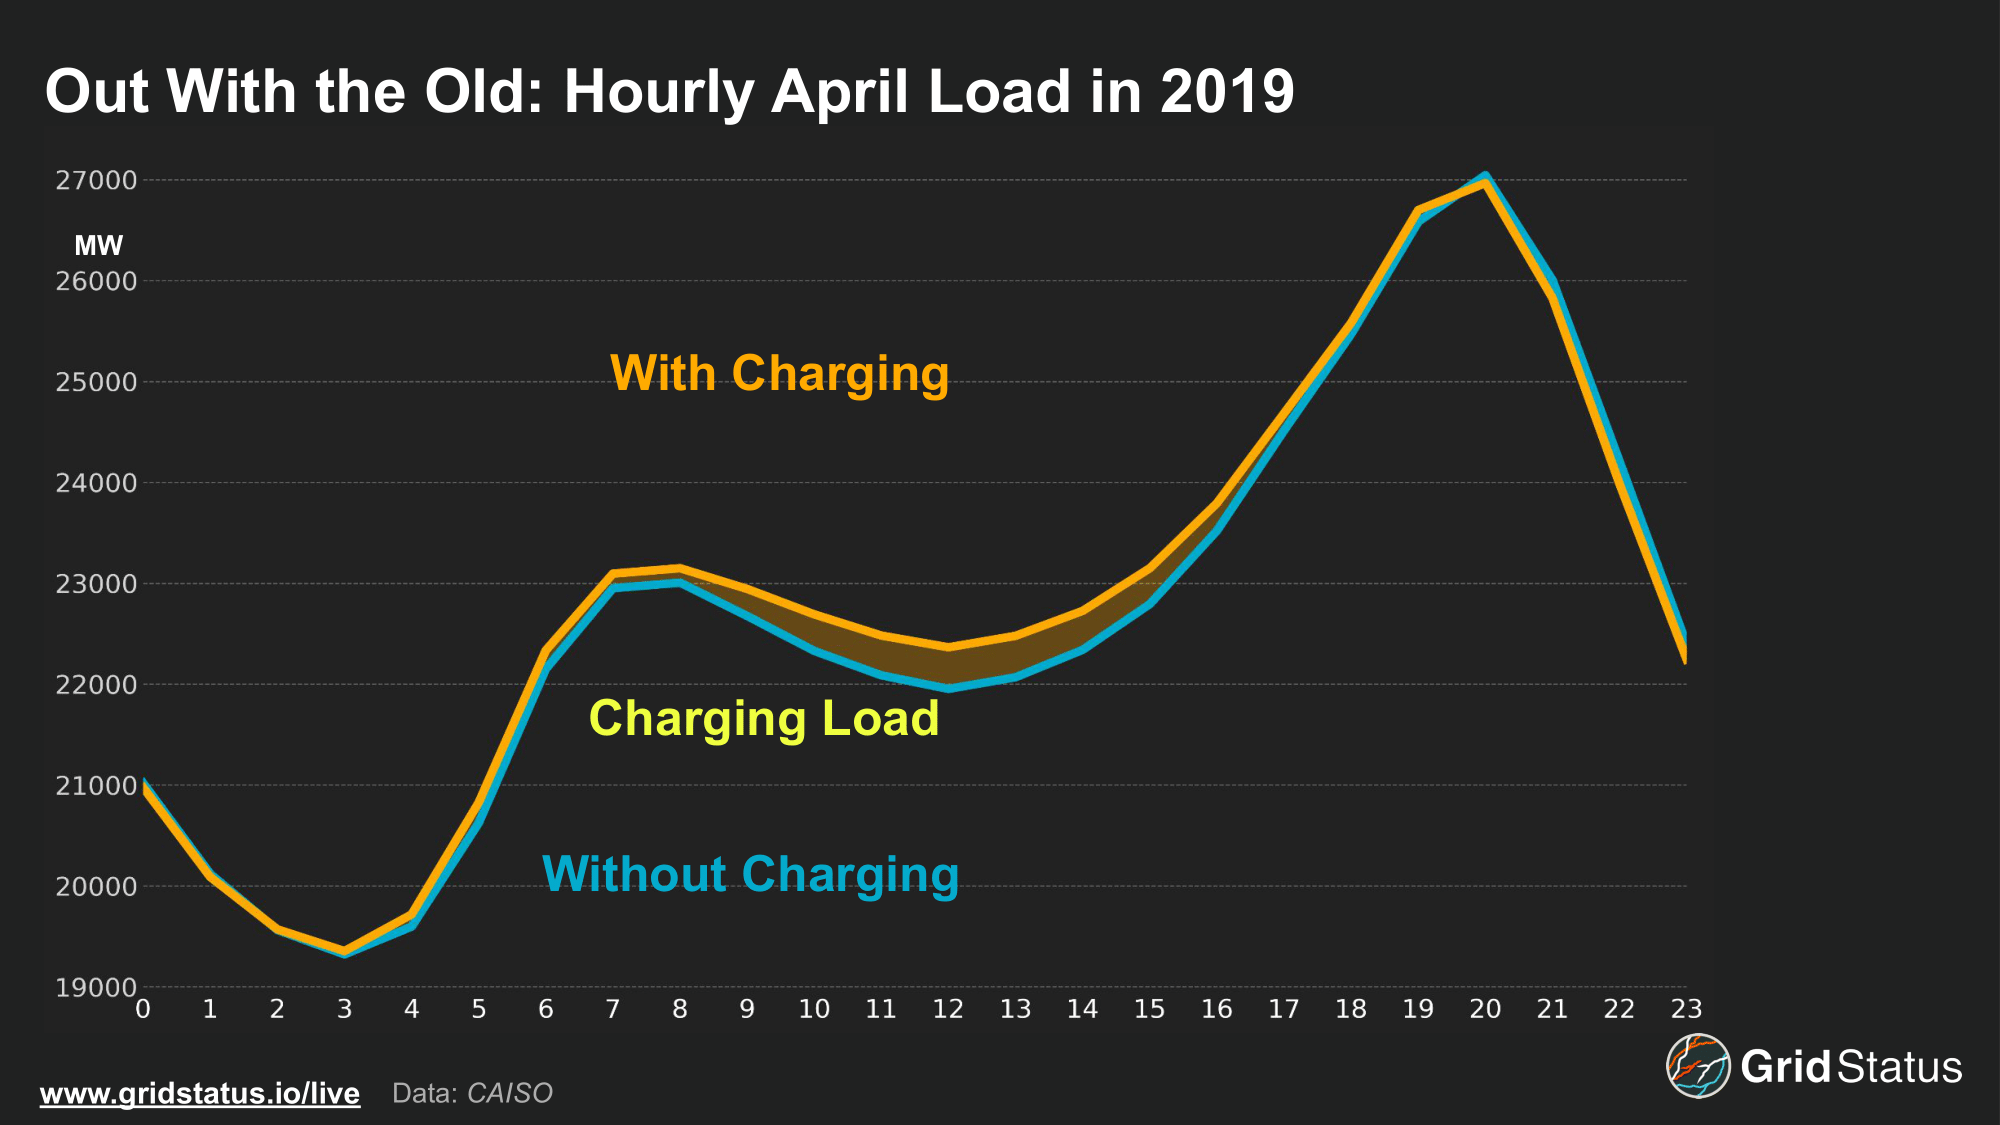
Comparing two full months of data highlights the rapid evolution underway in CAISO. In April 2019, the load curve reveals minimal divergence between scenarios with and without charging. Charging largely mirrored solar availability, ramping gradually with sunrise and peaking in the afternoon, indicating limited grid management behavior and a stronger correlation with solar output than with system needs.
Focusing on April 2025 provides a clearer view of recent dynamics. While some charging begins during the early morning off-peak hours, it ramps quickly after sunrise before leveling off. Charging behavior continues to closely follow solar output, with peak activity aligning with peak solar hours, effectively absorbing energy that might otherwise be curtailed before discharging over the evening peak.
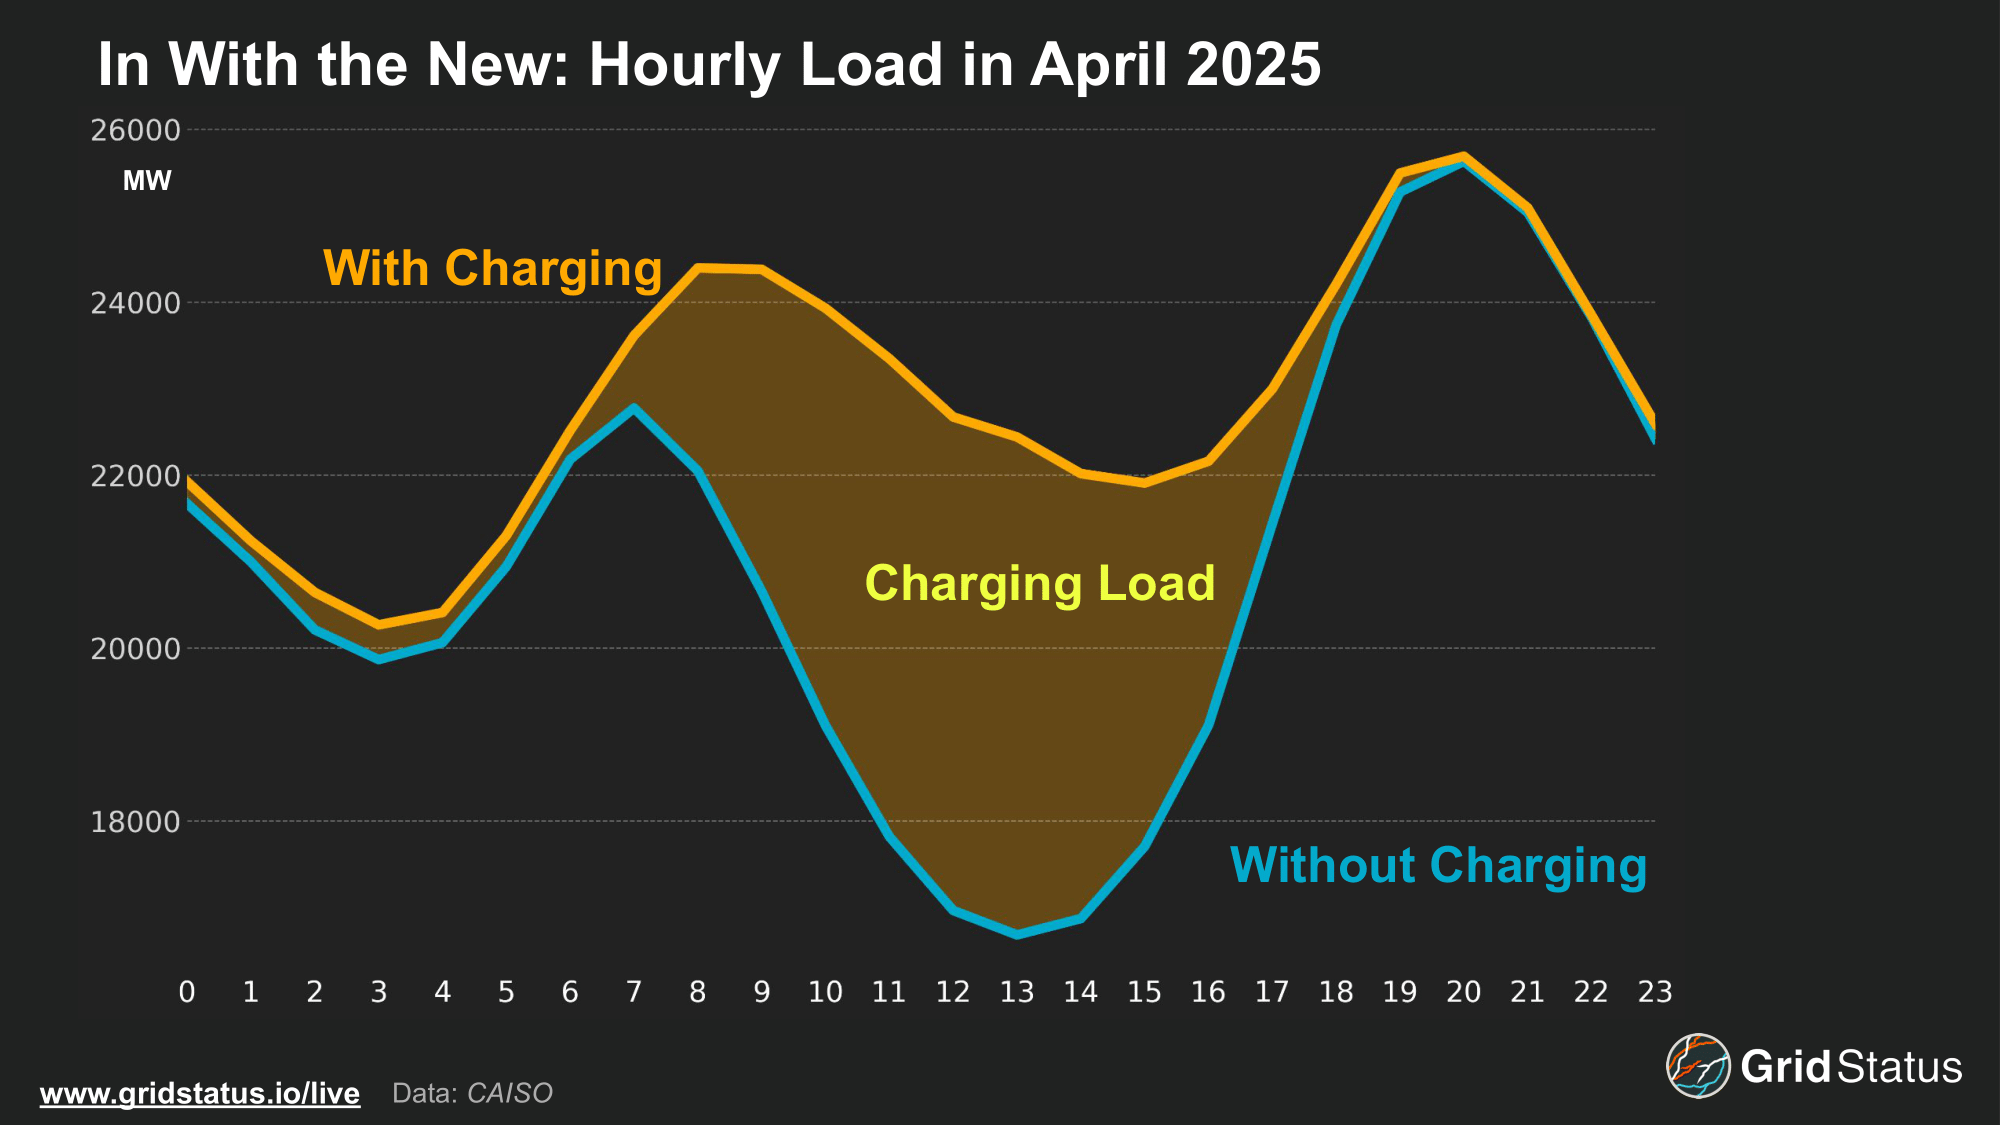
While charging over the morning ramp may not be ideal based on energy prices, this behavior proves critical for CAISO. With a north-south system, solar generation across the grid is highly correlated in a tighter band than other areas. Once the sun has sufficiently risen, around 08:00, both utility-scale and BTM solar floods the grid.
Although gas generation provides immense flexibility for grid operators, these units lose their marginal position as solar generation comes online and drives wholesale prices down. To make matters more challenging, gas units have various ramping capabilities and physical limitations that operators must respect to ensure unit reliability.
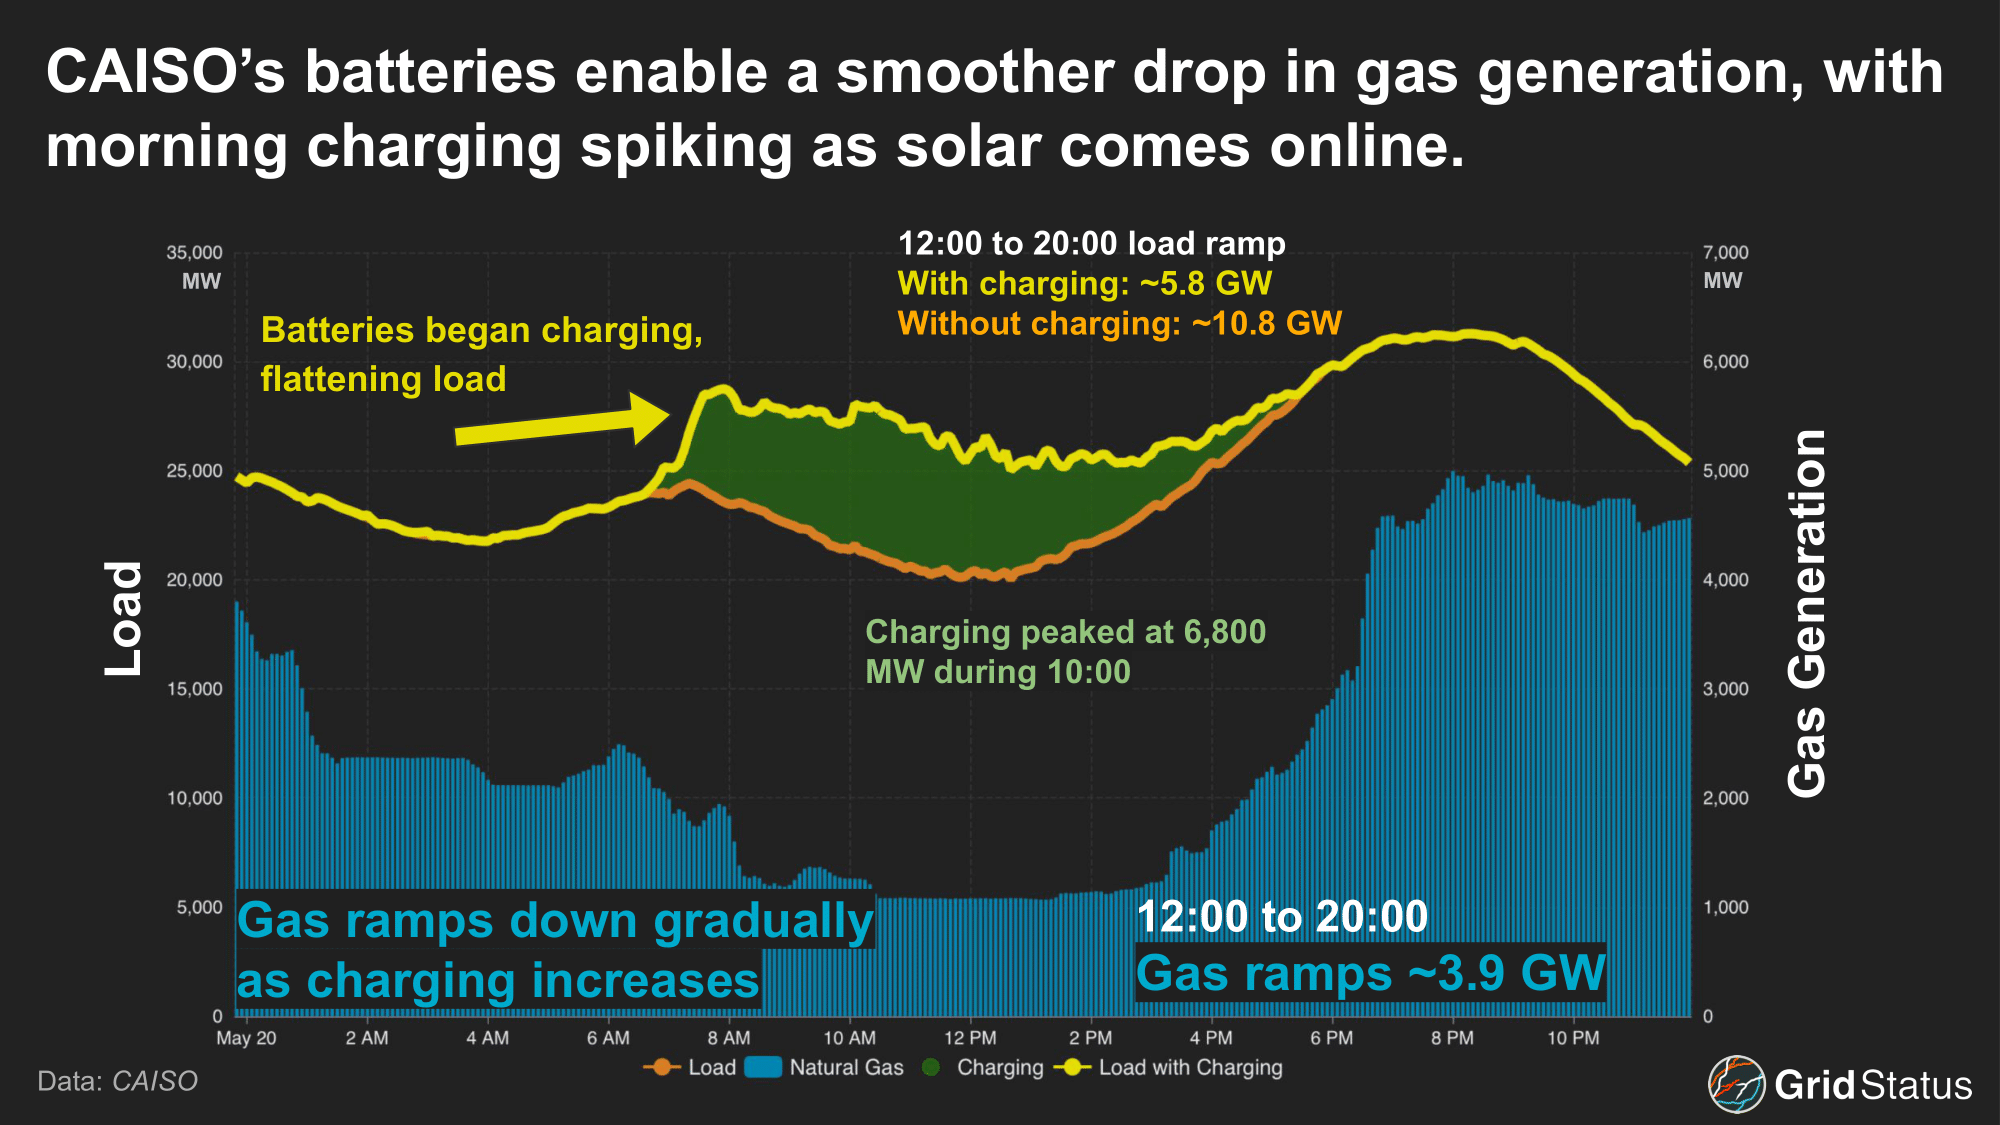
Battery storage helps bridge this gap. Units can begin charging over the morning, artificially inflating load while net load plummets. While this may not be ideal in the context of top-bottom (TB) spreads, it enables a more controlled and gradual ramp-down of gas units. Almost all charging still takes place during solar hours, but units that charge earlier help round out the load curve. In doing so, storage helps align system operations with both broader grid dynamics and the technical limitations of thermal assets.
Down with RegDown
This charging behavior is reflected in ancillary services, specifically CAISO’s RegulationDown (RegD) data. Batteries are uniquely positioned for RegD procurements as units can quickly begin charging to fulfill system needs, such as addressing higher frequency resulting from excess generation.
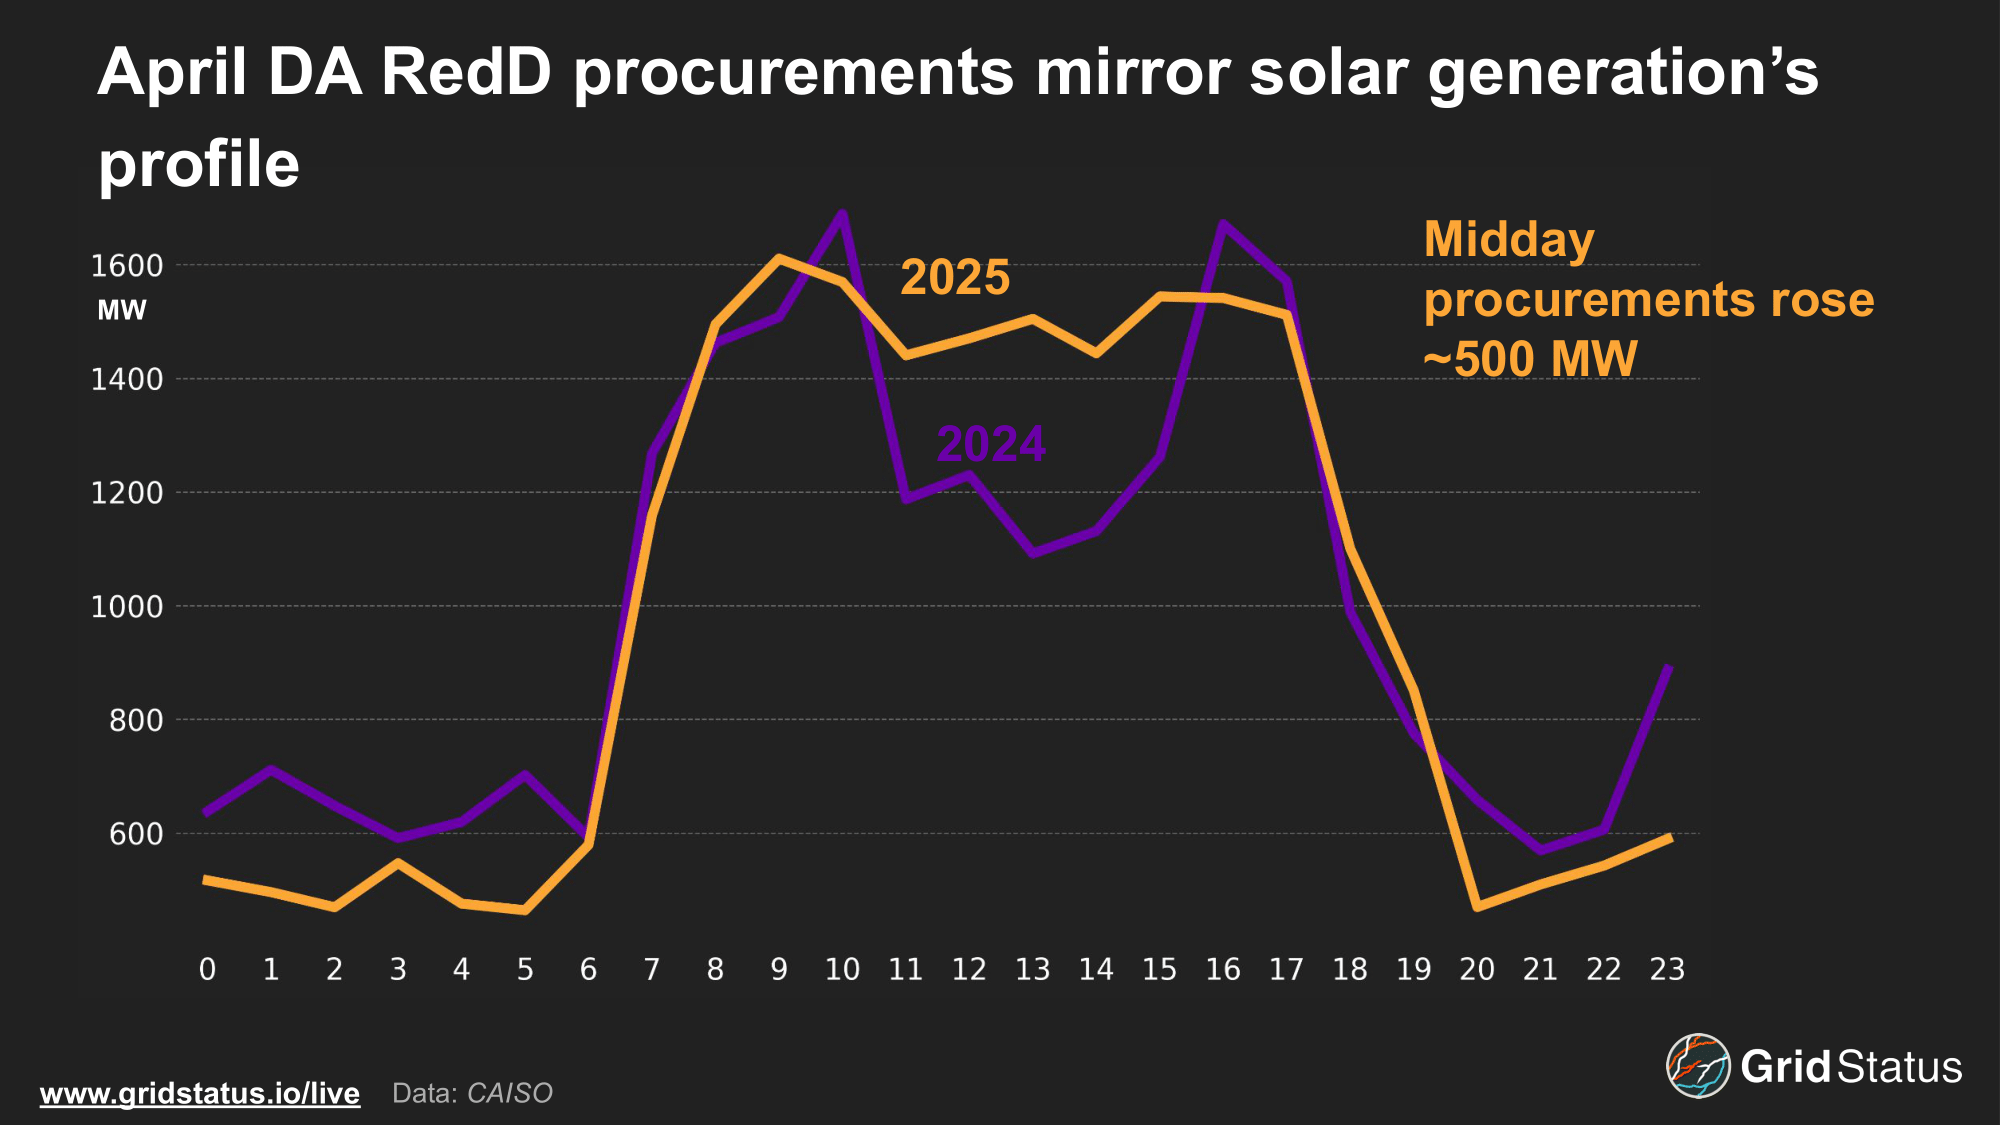
Notably, procurements rise by over a GW from 06:00 to 09:00 following the solar ramp and remain elevated throughout the day, perfectly mirroring solar’s generation profile. The morning peak, where gas units are ramping down, has higher procurement levels than the bottom of the net load curve. Procurements quickly fall into the evening when storage discharging, rather than charging, becomes the grid operator's main concern.
Maintaining Position
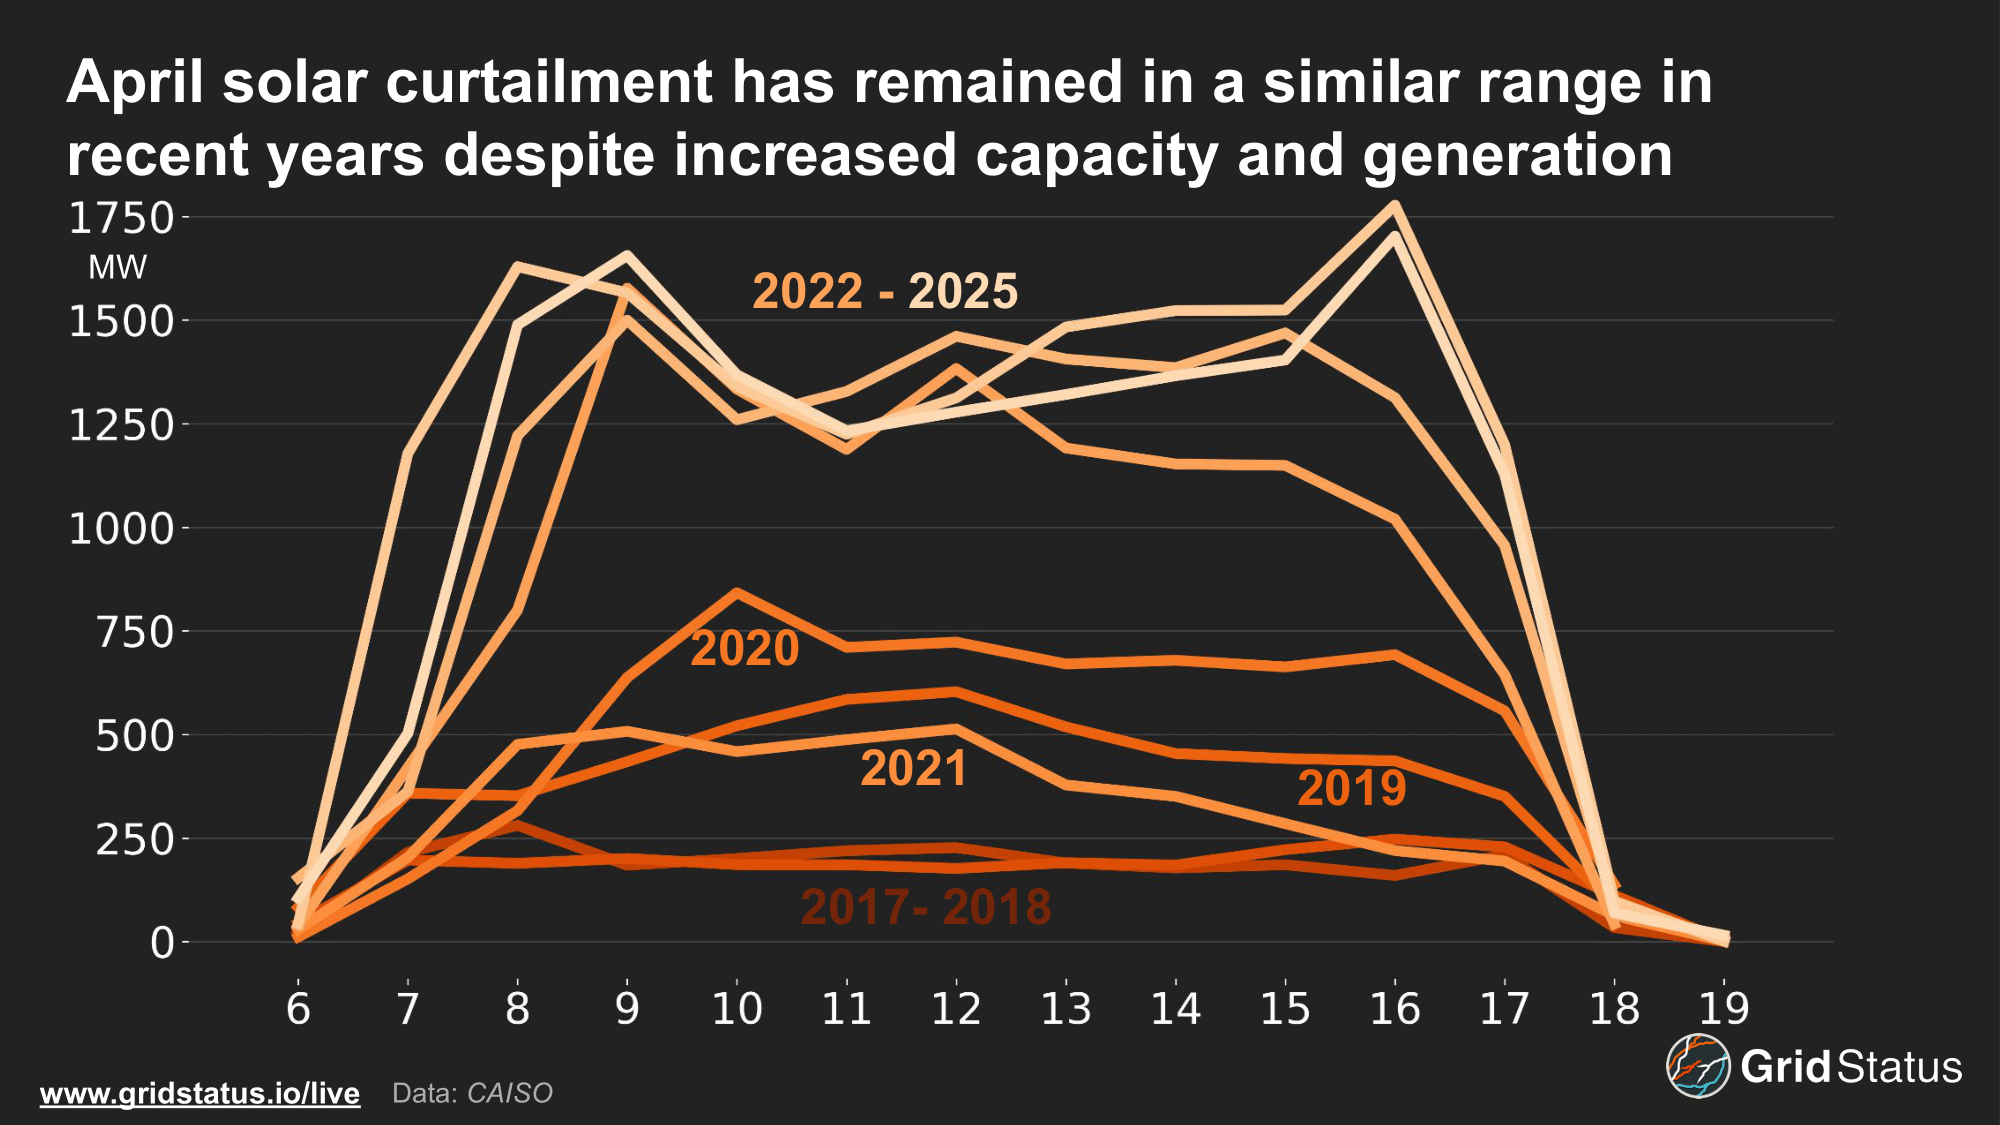
Solar curtailment has remained relatively consistent over the last few years and even declined in 2025 despite another large increase in average generation. Curtailment spikes around the morning and late afternoon when solar sees rapid swings in output, indicating generation may be curtailed to ease challenges resulting from ramping thermal units. The reduction in midday curtailment, even as total generation increases, is likely a result of growing storage charging and increased load.
As solar has become an increasing portion of CAISO’s fuel mix, negative net load levels have pushed CAISO to become a large net exporter in the afternoon. During these hours, CAISO is able to export excess solar power to the wider Western market, helping to limit curtailments.
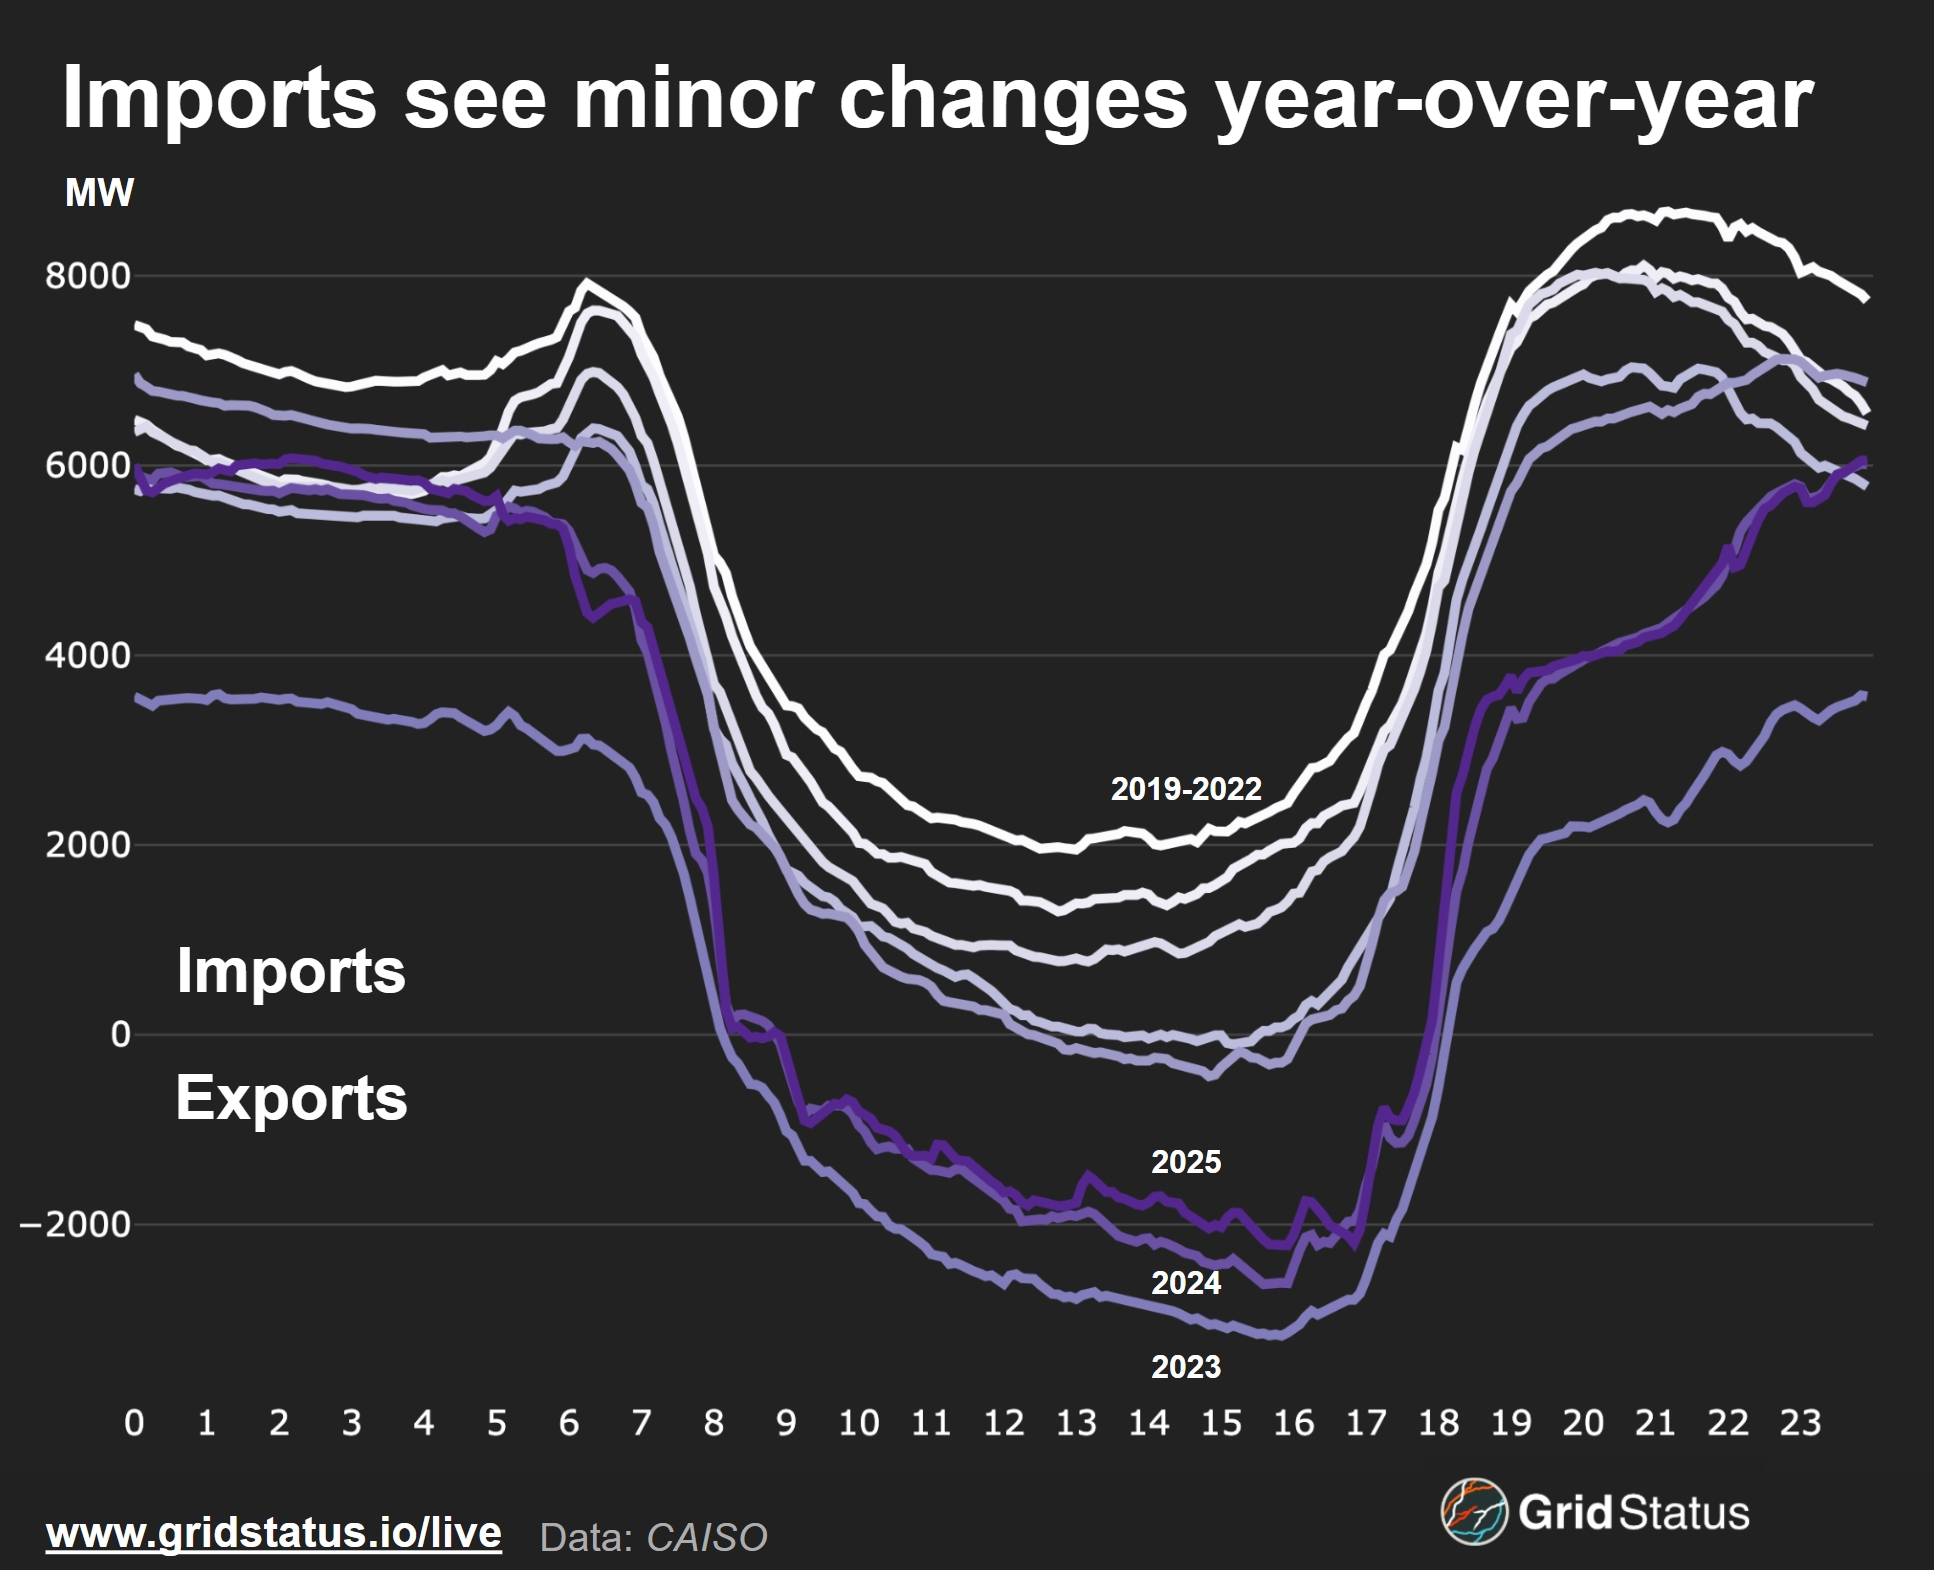
Similar to curtailment, imports in 2025 have no superlative comparison; 2023 stands out due to the extremely weak hydro year in the Pacific Northwest. According to the EIA, April 2023 saw total hydroelectric production in the Northwest and Rockies hit 6 TWh, about half of the 10-year average.
Accreditation Reimagined (Again)
The timing of battery charging has major implications for resource adequacy (RA), particularly under the new Slice of Day (SoD) framework adopted by the CPUC. Under SoD, solar and wind accreditation has shifted from effective load carrying capability to exceedance values, while capacity counting for storage, demand response, dispatchable/non-dispatchable resources, and non resource specific imports did not change. Notably, this framework adds battery charging to the hourly demand requirements.
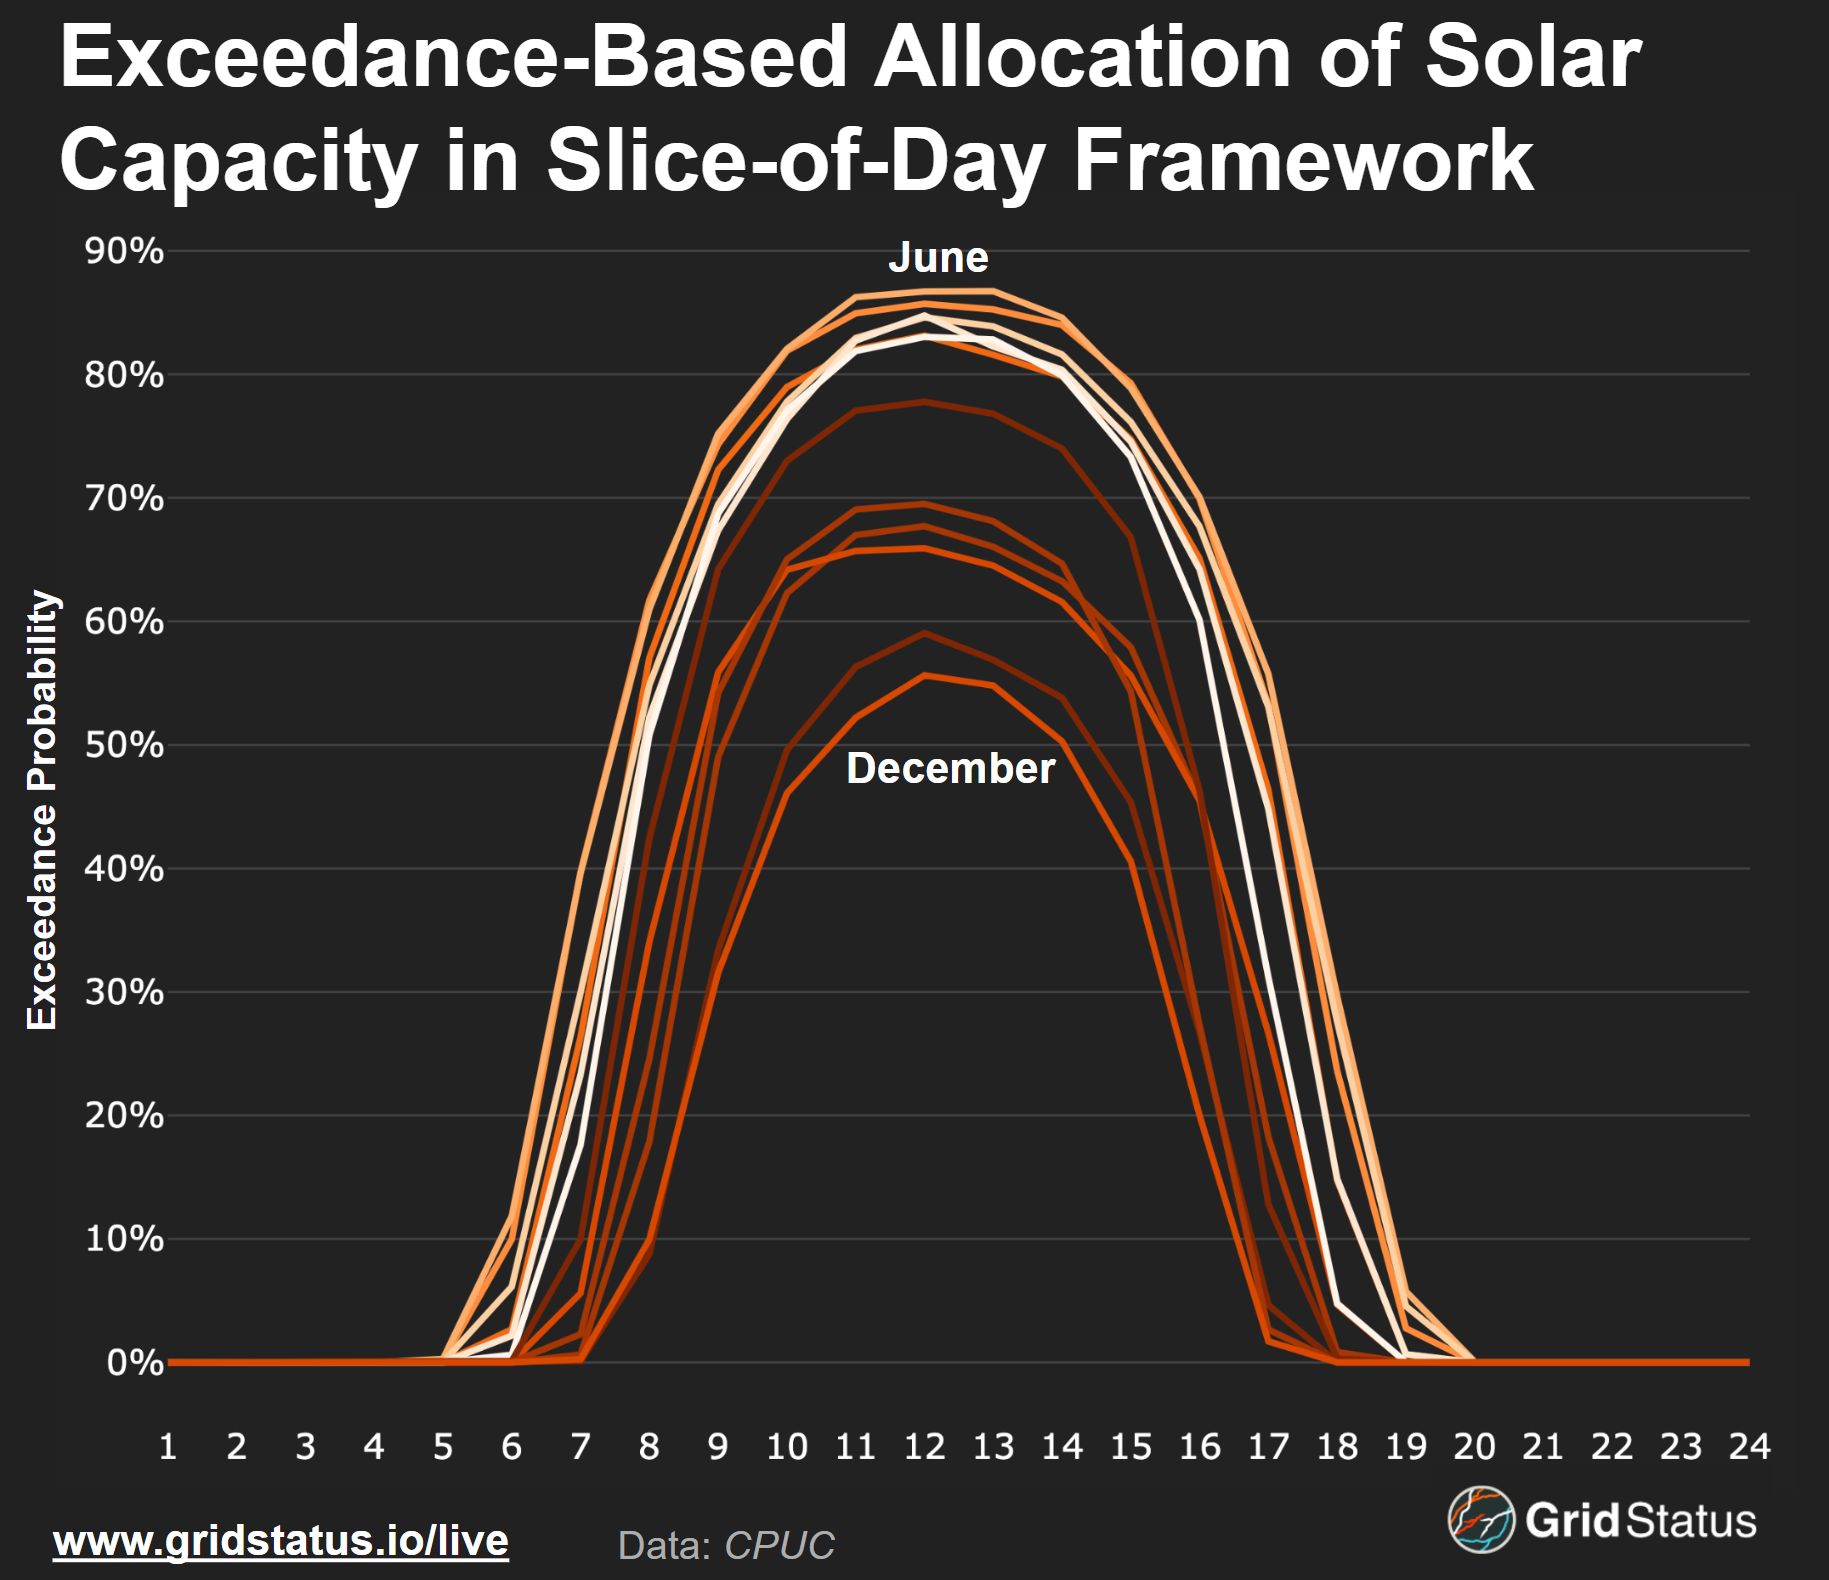
CPUC uses these exceedance profiles to calculate contributions for solar by month, averaged across all the regions by each hour. Exceedance represents the probability that solar will generate a certain amount of energy, or exceed a specific value, during a given hour. These profiles shift throughout the year, illustrating the seasonality of solar and the challenges that more intermittent renewables on the grid can create.
Under the new hourly RA rules, each wind and solar resource is assigned a monthly coincident peak hour exceedance value, reflecting how much it typically generates during the system’s peak demand hour. While the CPUC uses exceedance profiles to help inform these values, CAISO ultimately assigns a final qualifying capacity (QC) based on each plant’s output during that monthly peak hour.
California’s RA system has some peculiar discontinuities between utilities and the grid operator. In this case, CAISO hasn’t changed its own internal RA processes to SoD, but it still receives monthly QC values from local regulatory authorities that now follow the SoD framework.
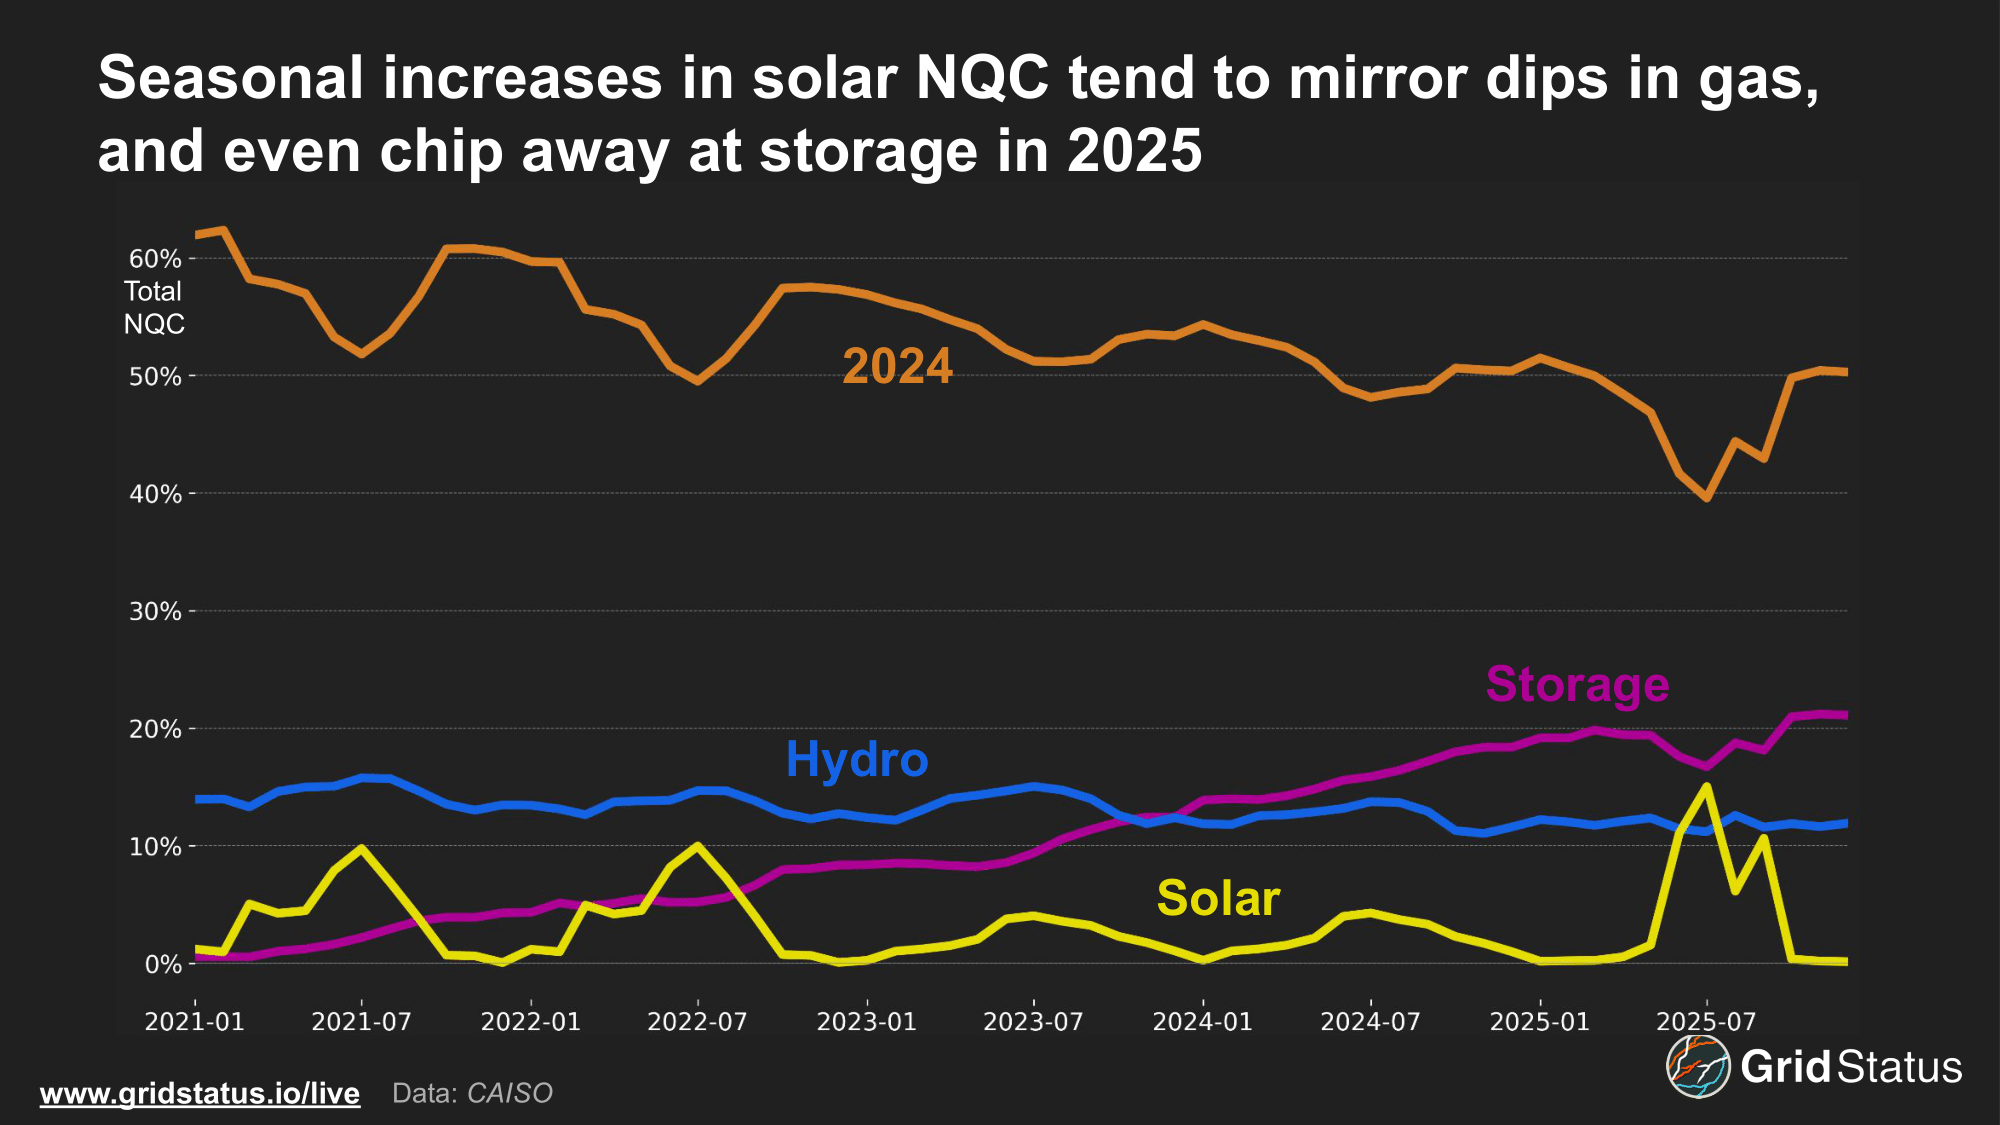
Since SoD includes battery charging as part of system load, the timing of the coincident peaks has now shifted to earlier in the day during months when solar output is high. As a result, solar resources receive significantly higher QC values, while other resource types see a relative decrease in their share.
Stay Golden
From its outsized role in entertainment to its role in technology, spanning semiconductors to social media, the Golden State has led the way on many global changes. Through state mandates and private investment, CAISO has integrated high levels of renewable energy and achieved high EV adoption, all while using new technology to address the limitations of existing generation. This is expected to continue as wider load growth, forecasted to increase between 1 to 1.5% per year, strains the existing system, and as more renewables are integrated in the market.
Changes in CAISO will be felt across the region as the market continues to prepare for the launch of wider market integration with the West via the Extended Day-Ahead market. Challenges will certainly arise, and reliability will continue to be at the forefront of discussions, as thermal plants continue to face competitive and environmental pressure to be phased out. We’ll continue to keep an eye out for exciting changes in the market and follow along with our live CAISO page.