Batteries Taking Charge of the California Grid
Batteries have taken a huge leap forward in CAISO this spring, shifting from a noteworthy trend into a major force impacting operations of the grid

Battery storage has been a standout performer in California ISO this spring. After years of growth, batteries have reached a level of operations where they now play a newly impactful role on the grid.
Driven by an acceleration in deployment as the industry broke through supply-chain struggles that plagued projects during the pandemic, data provided by CAISO shows just how stark the difference has been this year:
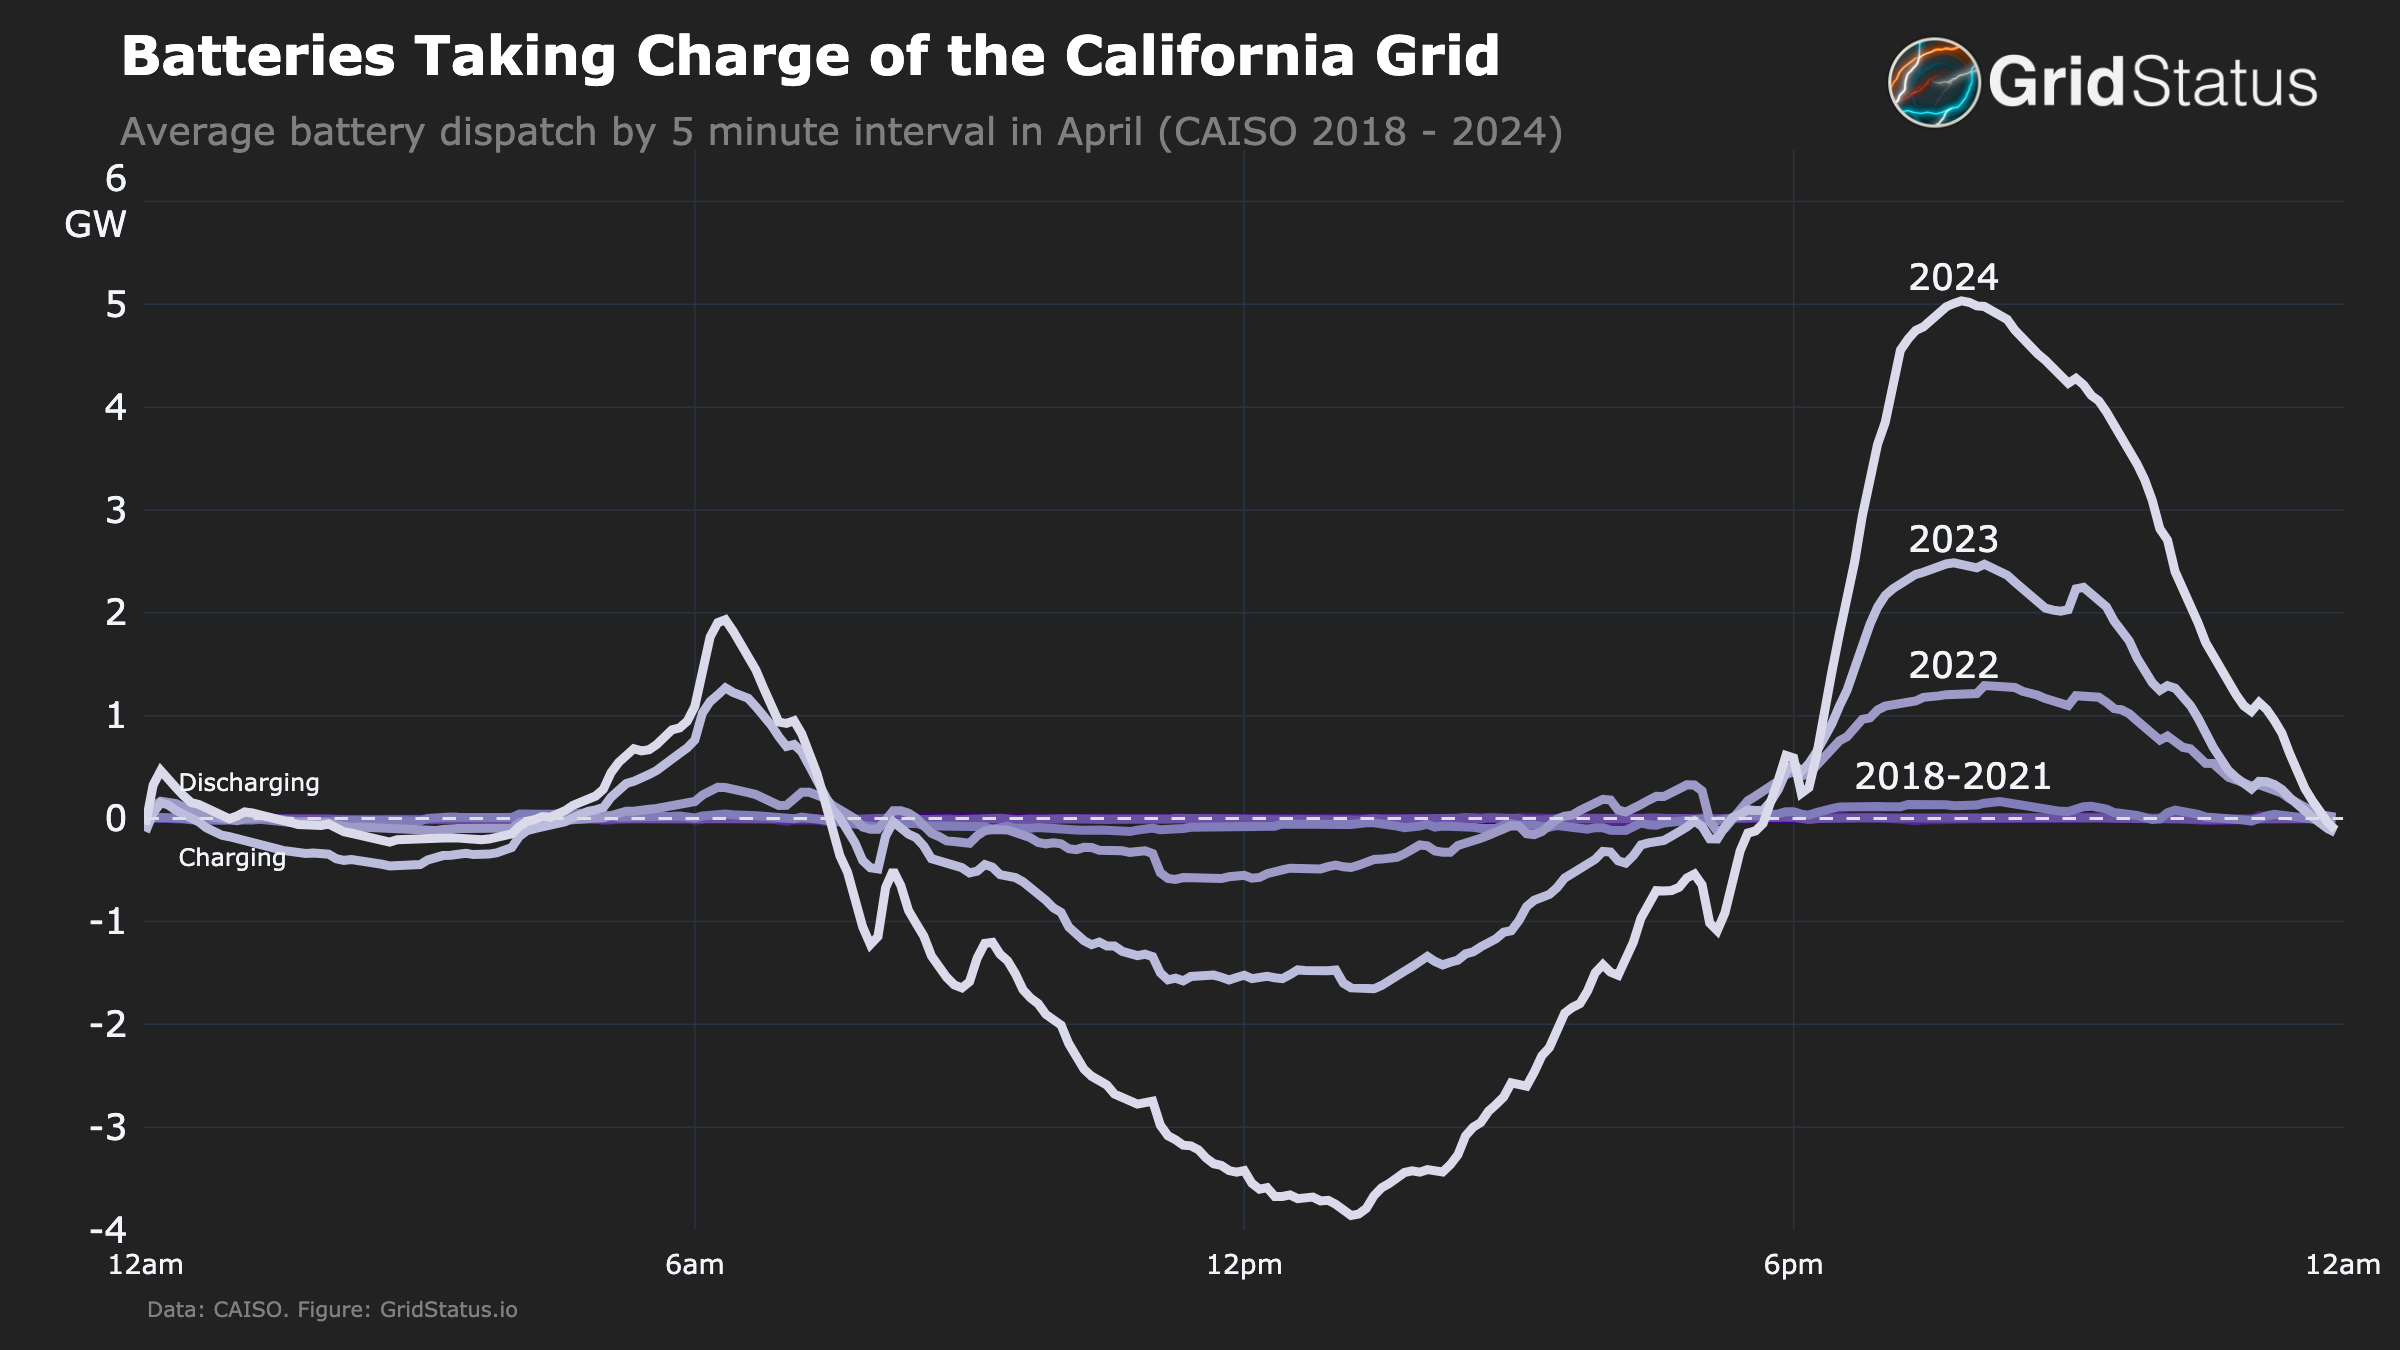
This graph shows how battery operations have greatly expanded throughout the day. Perhaps most impressively, batteries discharged over 5GW at peak times, marking a 100% increase over the average in just one year.
This intensification of previous trends has had a series of knock-on effects in CAISO, most notably manifesting in the operations of natural gas.
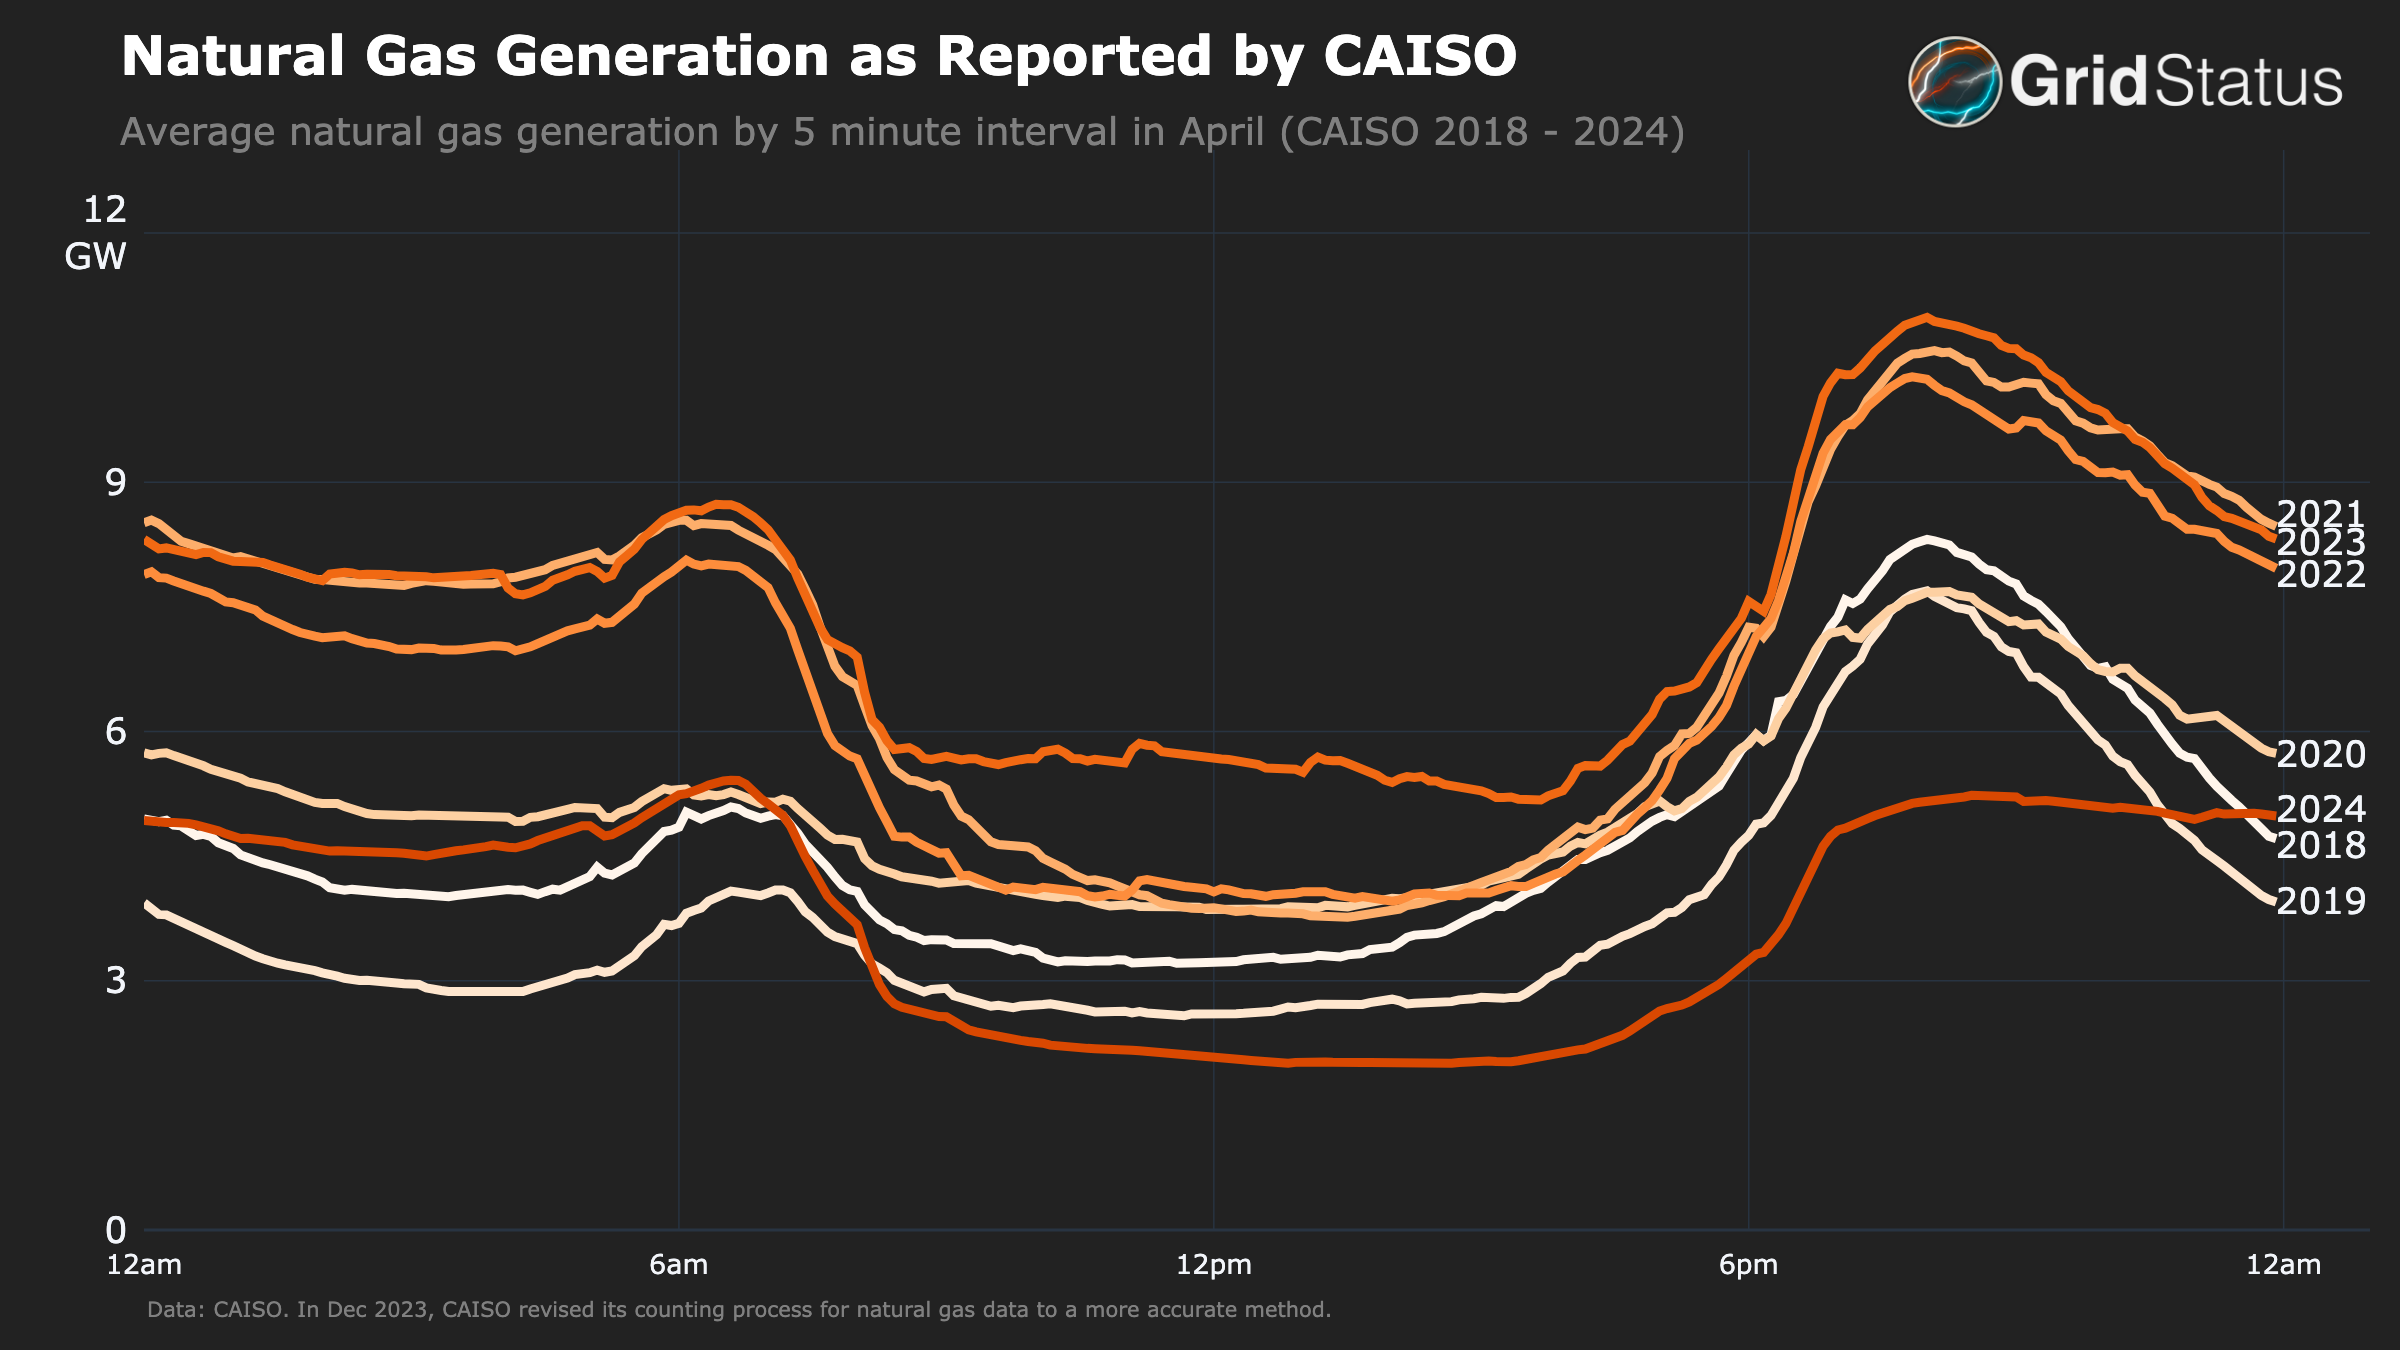
Is California Finally Moving Away from Natural Gas?
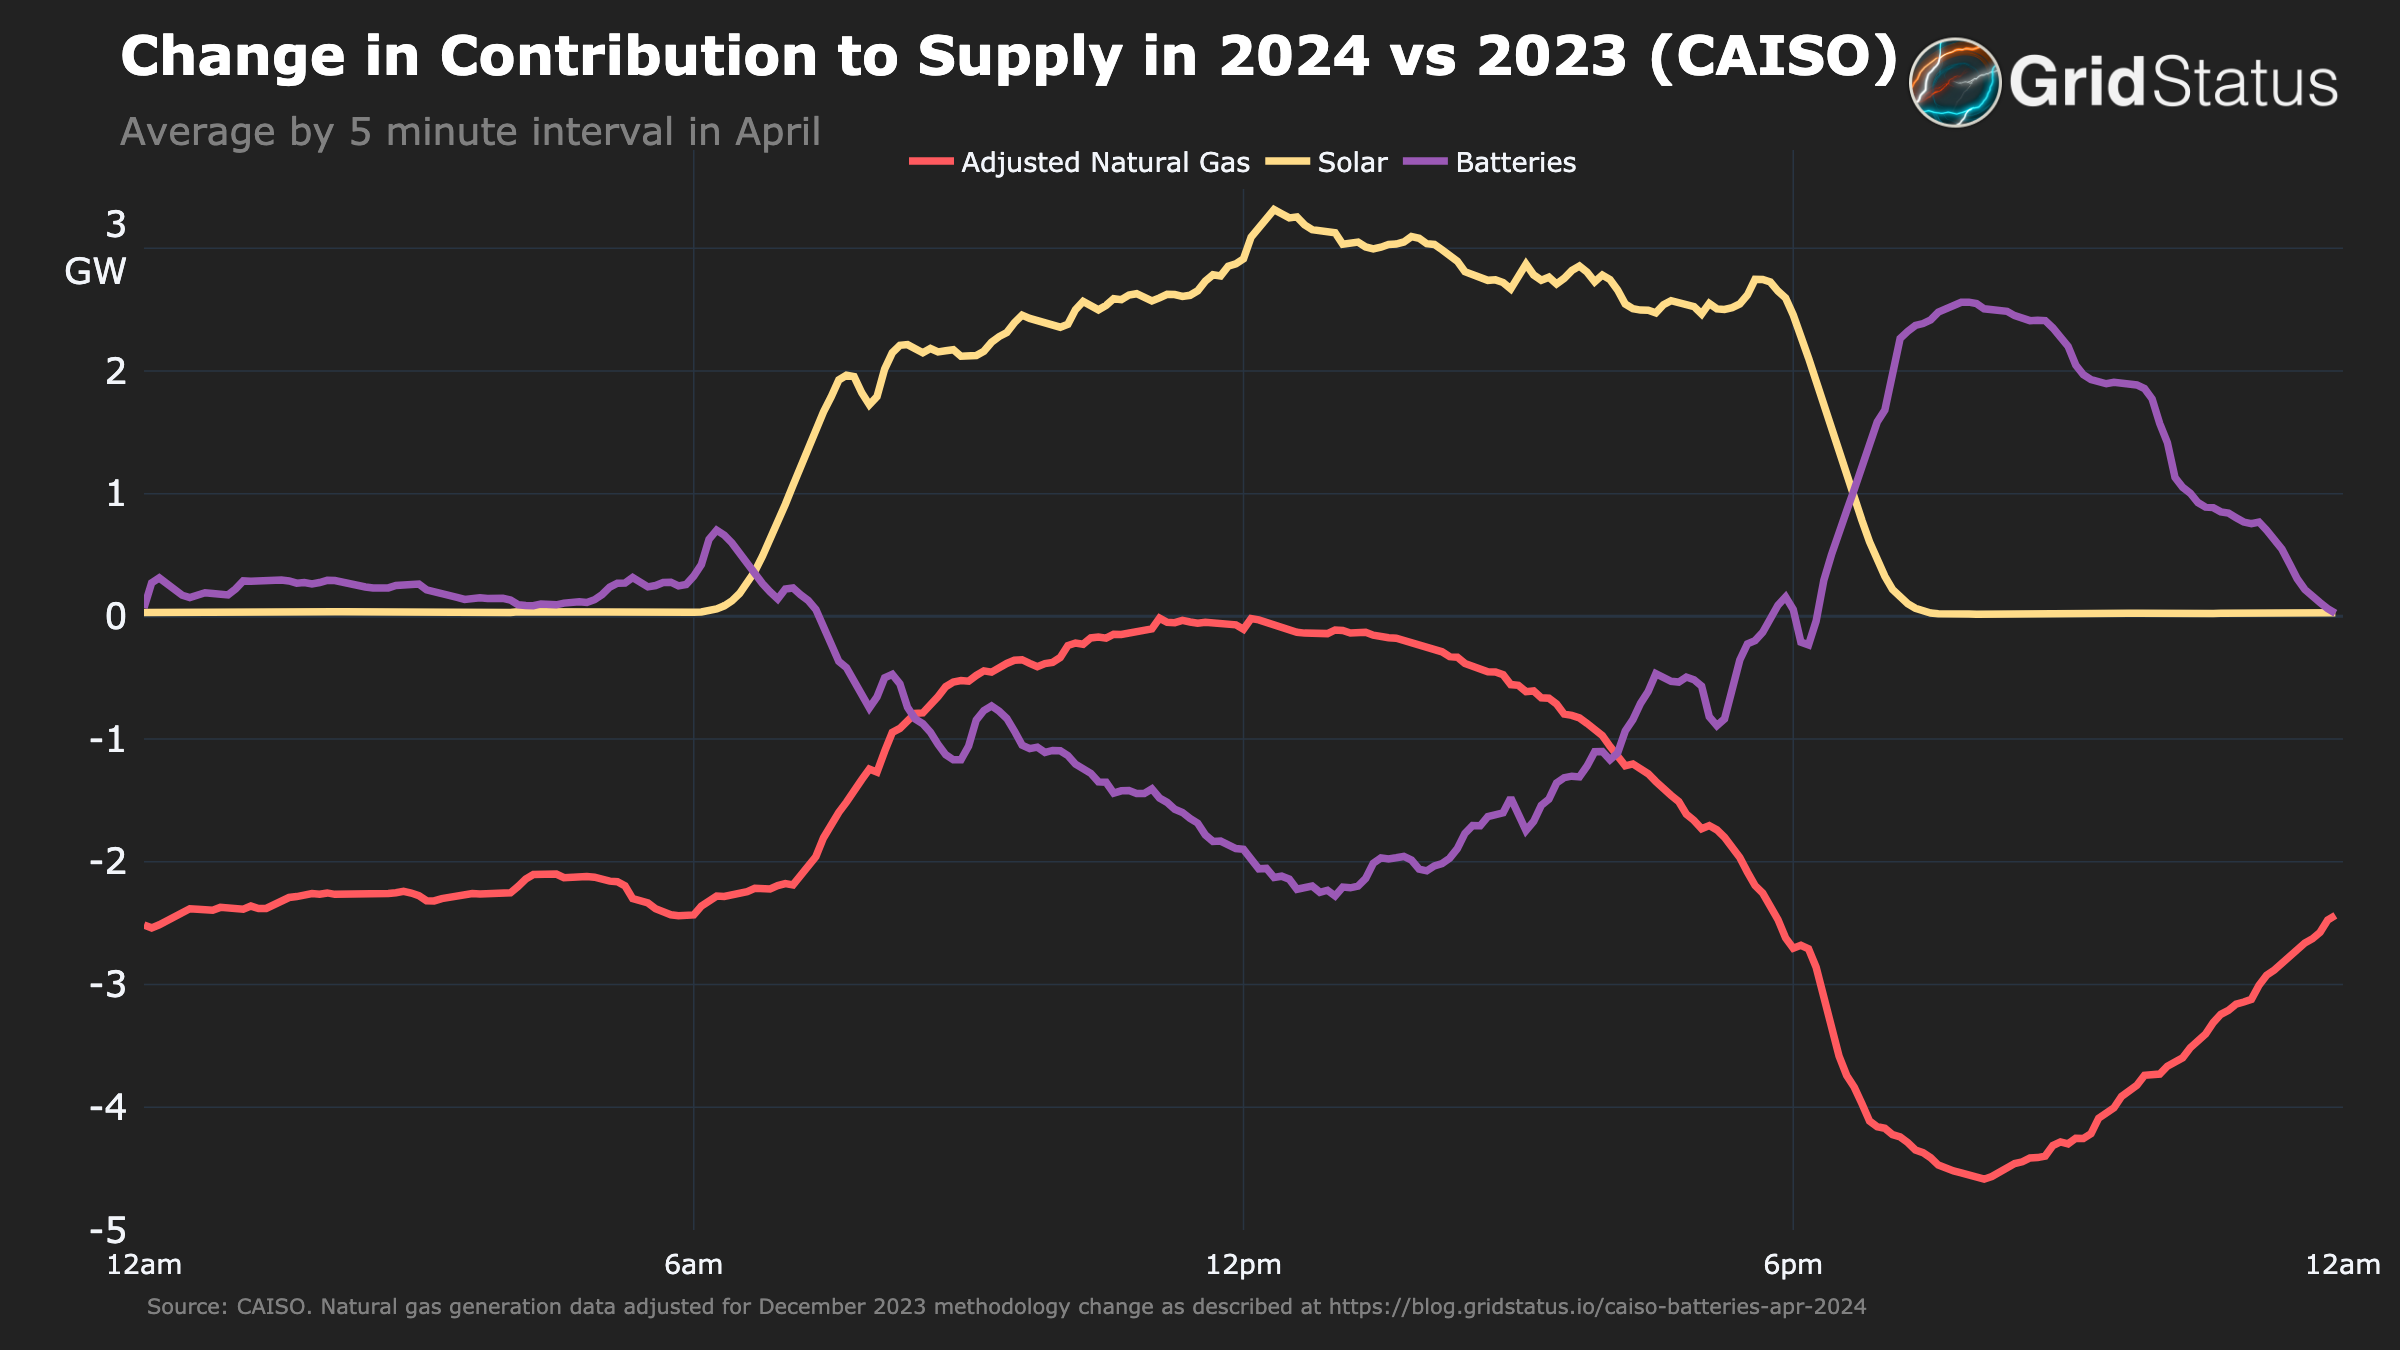
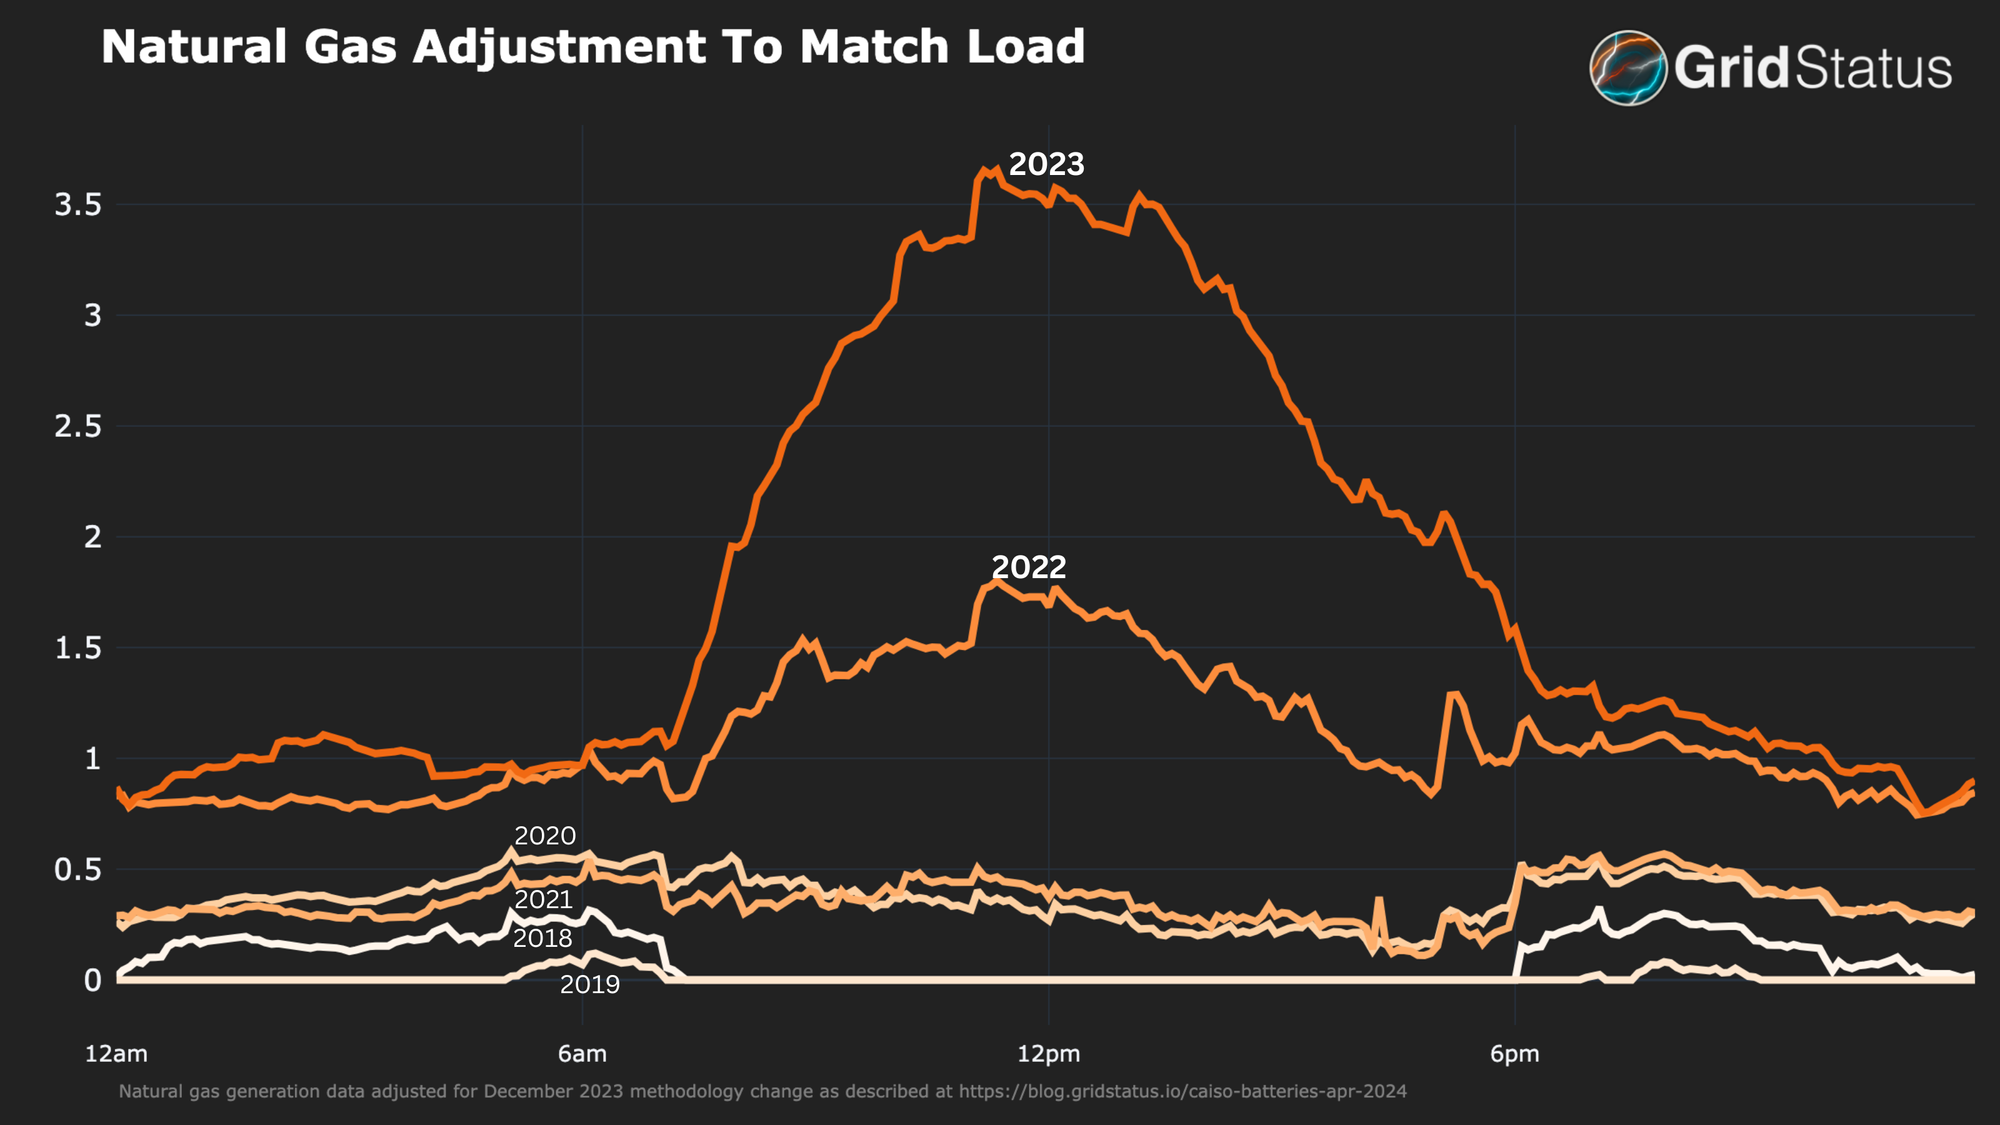
Despite a substantial increase in midday demand due to battery charging (more on this later), there was no corresponding increase in natural gas generation. In fact, the opposite occurred.
From the mid-morning until the late evening, average hourly gas generation was at its lowest levels in the last 7 years, reversing a trend we wrote about last year.
In the figure above, what was previously a defined peak in natural gas generation each evening has eroded into a plateau in 2024. That is because batteries are assisting with the predictable, but large, swings in solar output each day. These rapid ramps have been largely managed by natural gas units to date, but now batteries are taking on much of that responsibility.
The data clearly shows that batteries are displacing natural gas when solar generation is ramping up and down each day in CAISO.
Interestingly, it appears that batteries charged on that same cheap solar during the day have been able to take control of the peak management from natural gas generators. The shifting of this critical grid responsibility of handling solar ramps to a more responsive asset like batteries has important consequences. Because gas is no longer needed as much in the mornings/evenings, the amount held online during uneconomic midday conditions in preparation for evening solar down ramps can be reduced.
Perhaps the most surprising aspect of this transformation in supply is that all this reduction occurred despite the average daily gas prices declining from nearly $9/MMBtu last April to just $4/MMBtu this year at SoCal Citygate (a representative gas hub near the majority of gas plants in California).
The changes don’t stop with batteries and gas. While solar was charging the solution to its own grid issue it was also setting new records.
A Return to Increasing Solar in CAISO
2024 has seen a shift from the stagnant solar generation of the past several years. This step change is in some ways even more dramatic than the increase in batteries as solar was stuck in the same band from 2021-2023 while batteries were still increasing year-over-year.
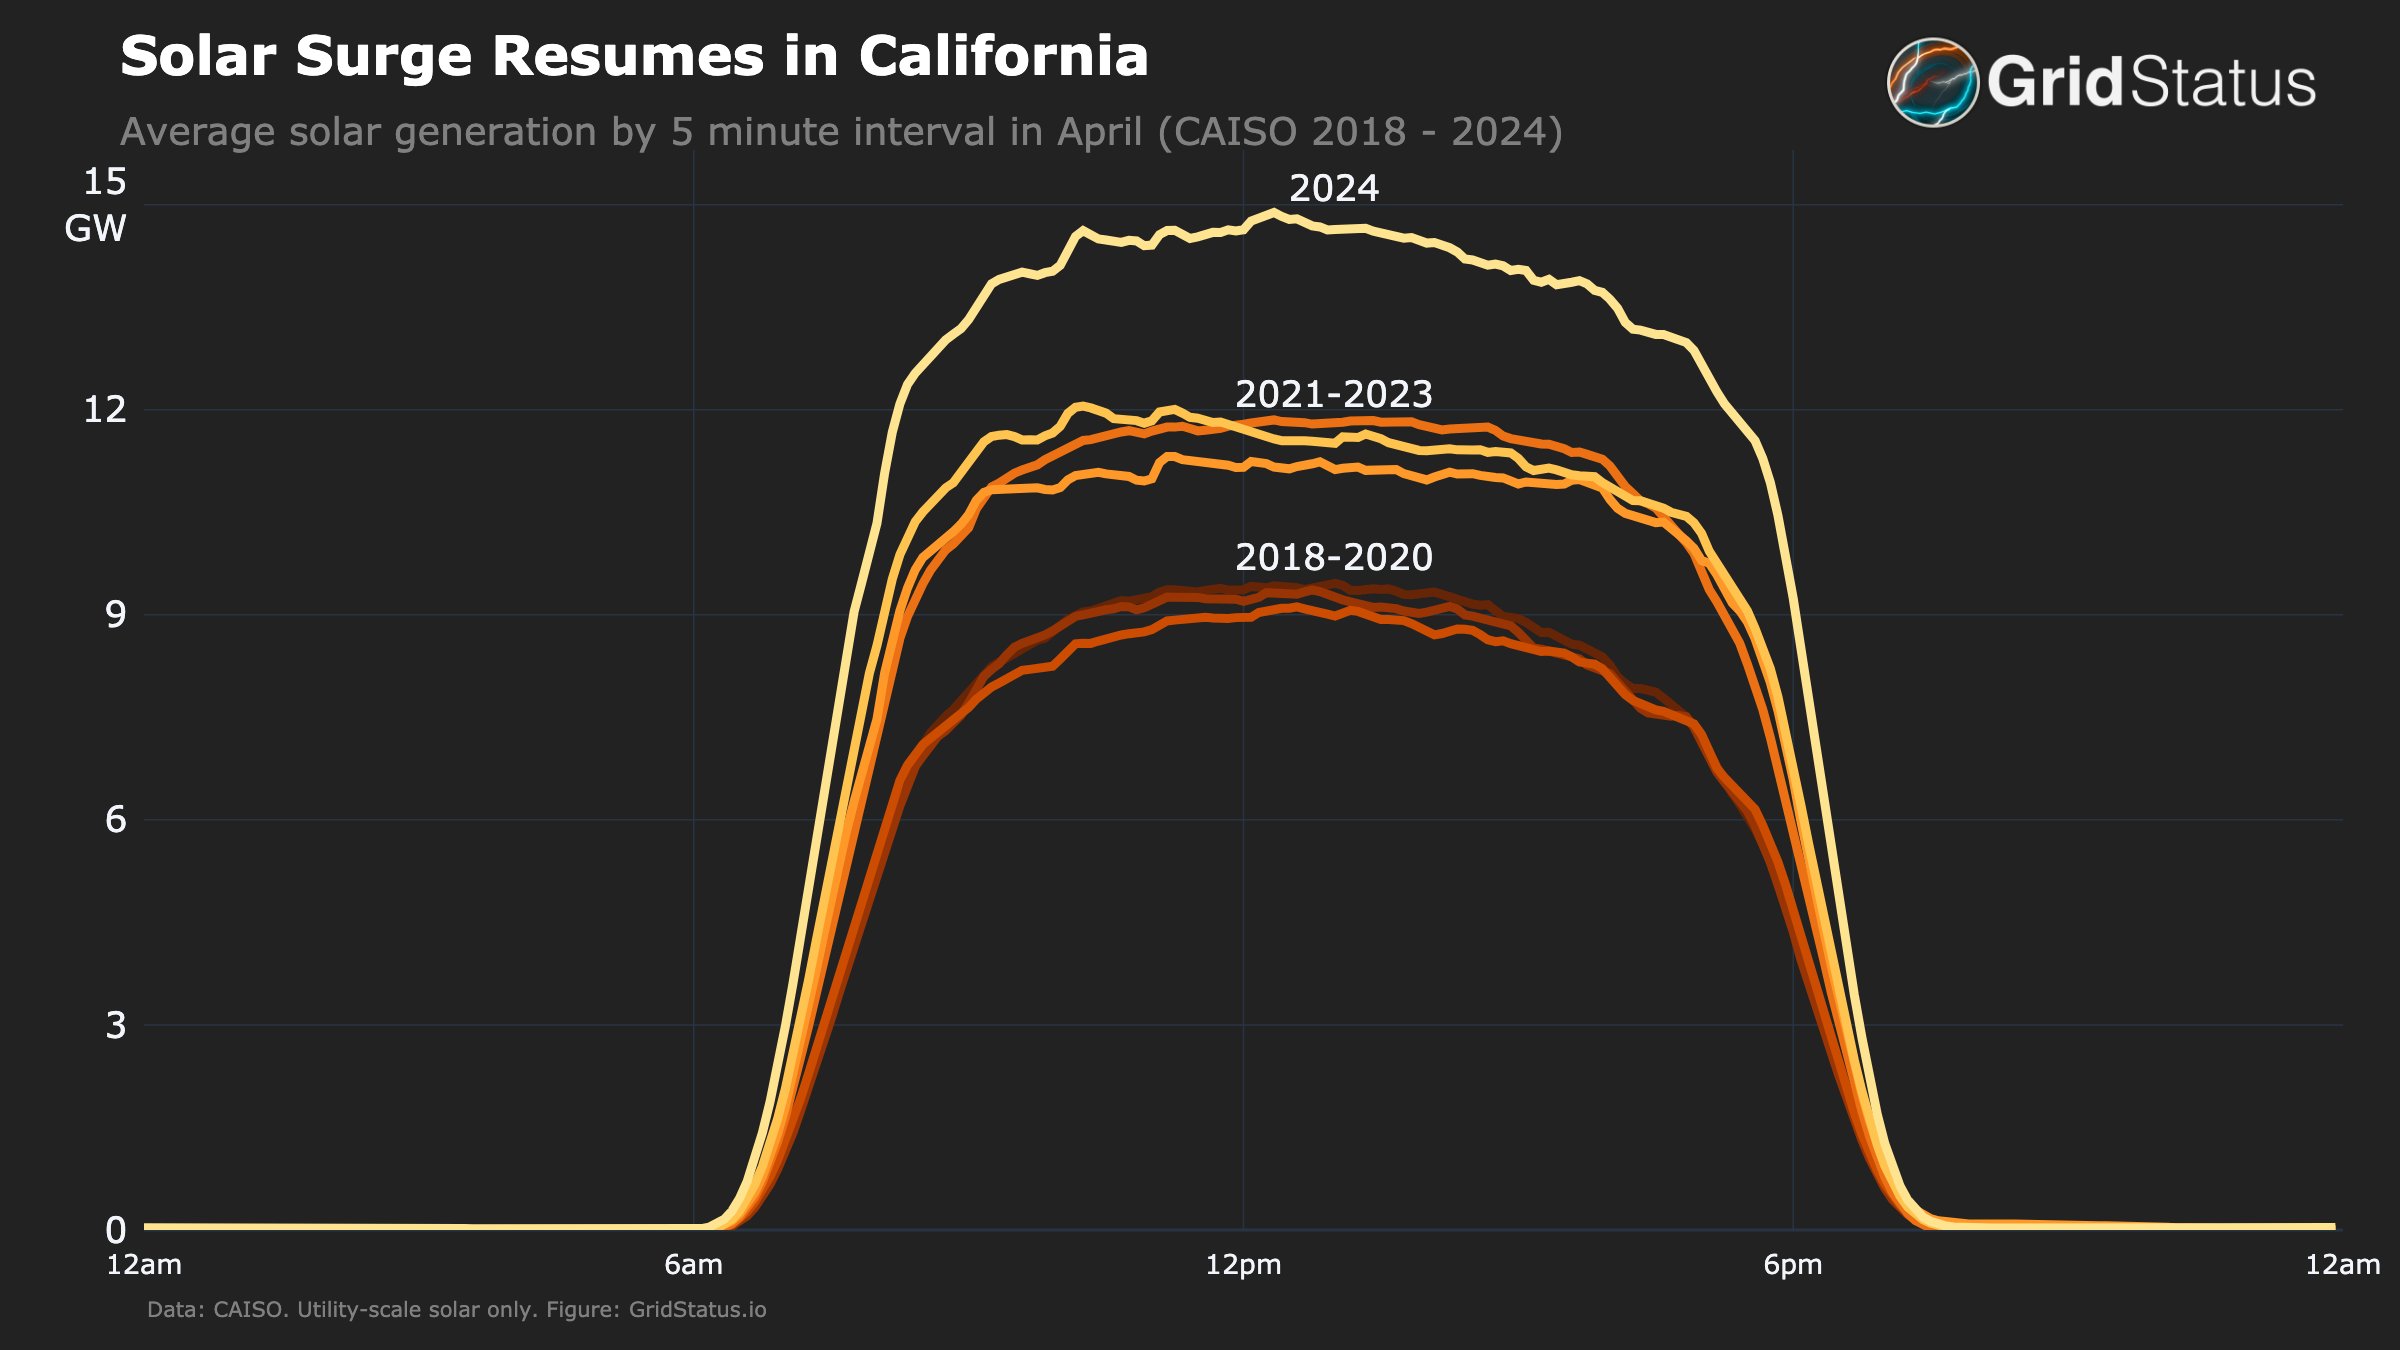
Every one of the top ten instantaneous solar generation records in CAISO occurred in the final 3 weeks of April (before we hit May, which has already nabbed three of the spots). Before this streak, the peak output was barely over 16 GW in September of 2023. Now the record stands at more than 18.5 GW and is poised to keep growing.
Solar generation trends also bear a notable resemblance to the adjusted gas generation trends above. For both technologies, 2021-2023 and 2018-2020 were clustered together (particularly during the evening peak for gas) while 2024 is a paradigm change.
While new solar capacity additions certainly played a role in elevating output, there are two other potential drivers at play.
- With a reduction in the need for midday gas due to batteries, there is more room for solar generation to supply the wider grid.
- The increased midday demand from batteries can consume solar output that might otherwise get curtailed.
As batteries work synergistically with solar in multiple ways, CAISO (and really California’s) grid of the future seems to be taking a much clearer shape than in previous years.
What about Hydropower?
We don’t want to forget about hydropower — a sizable and dispatchable resource on the western grid that could explain any of the changes we’ve discussed so far.
In this case, the decrease in gas doesn’t correspond with a banner year in hydropower production either. Despite relatively high shoulder hour output, the midday generating level is in the lower tranche of the last 7 years.
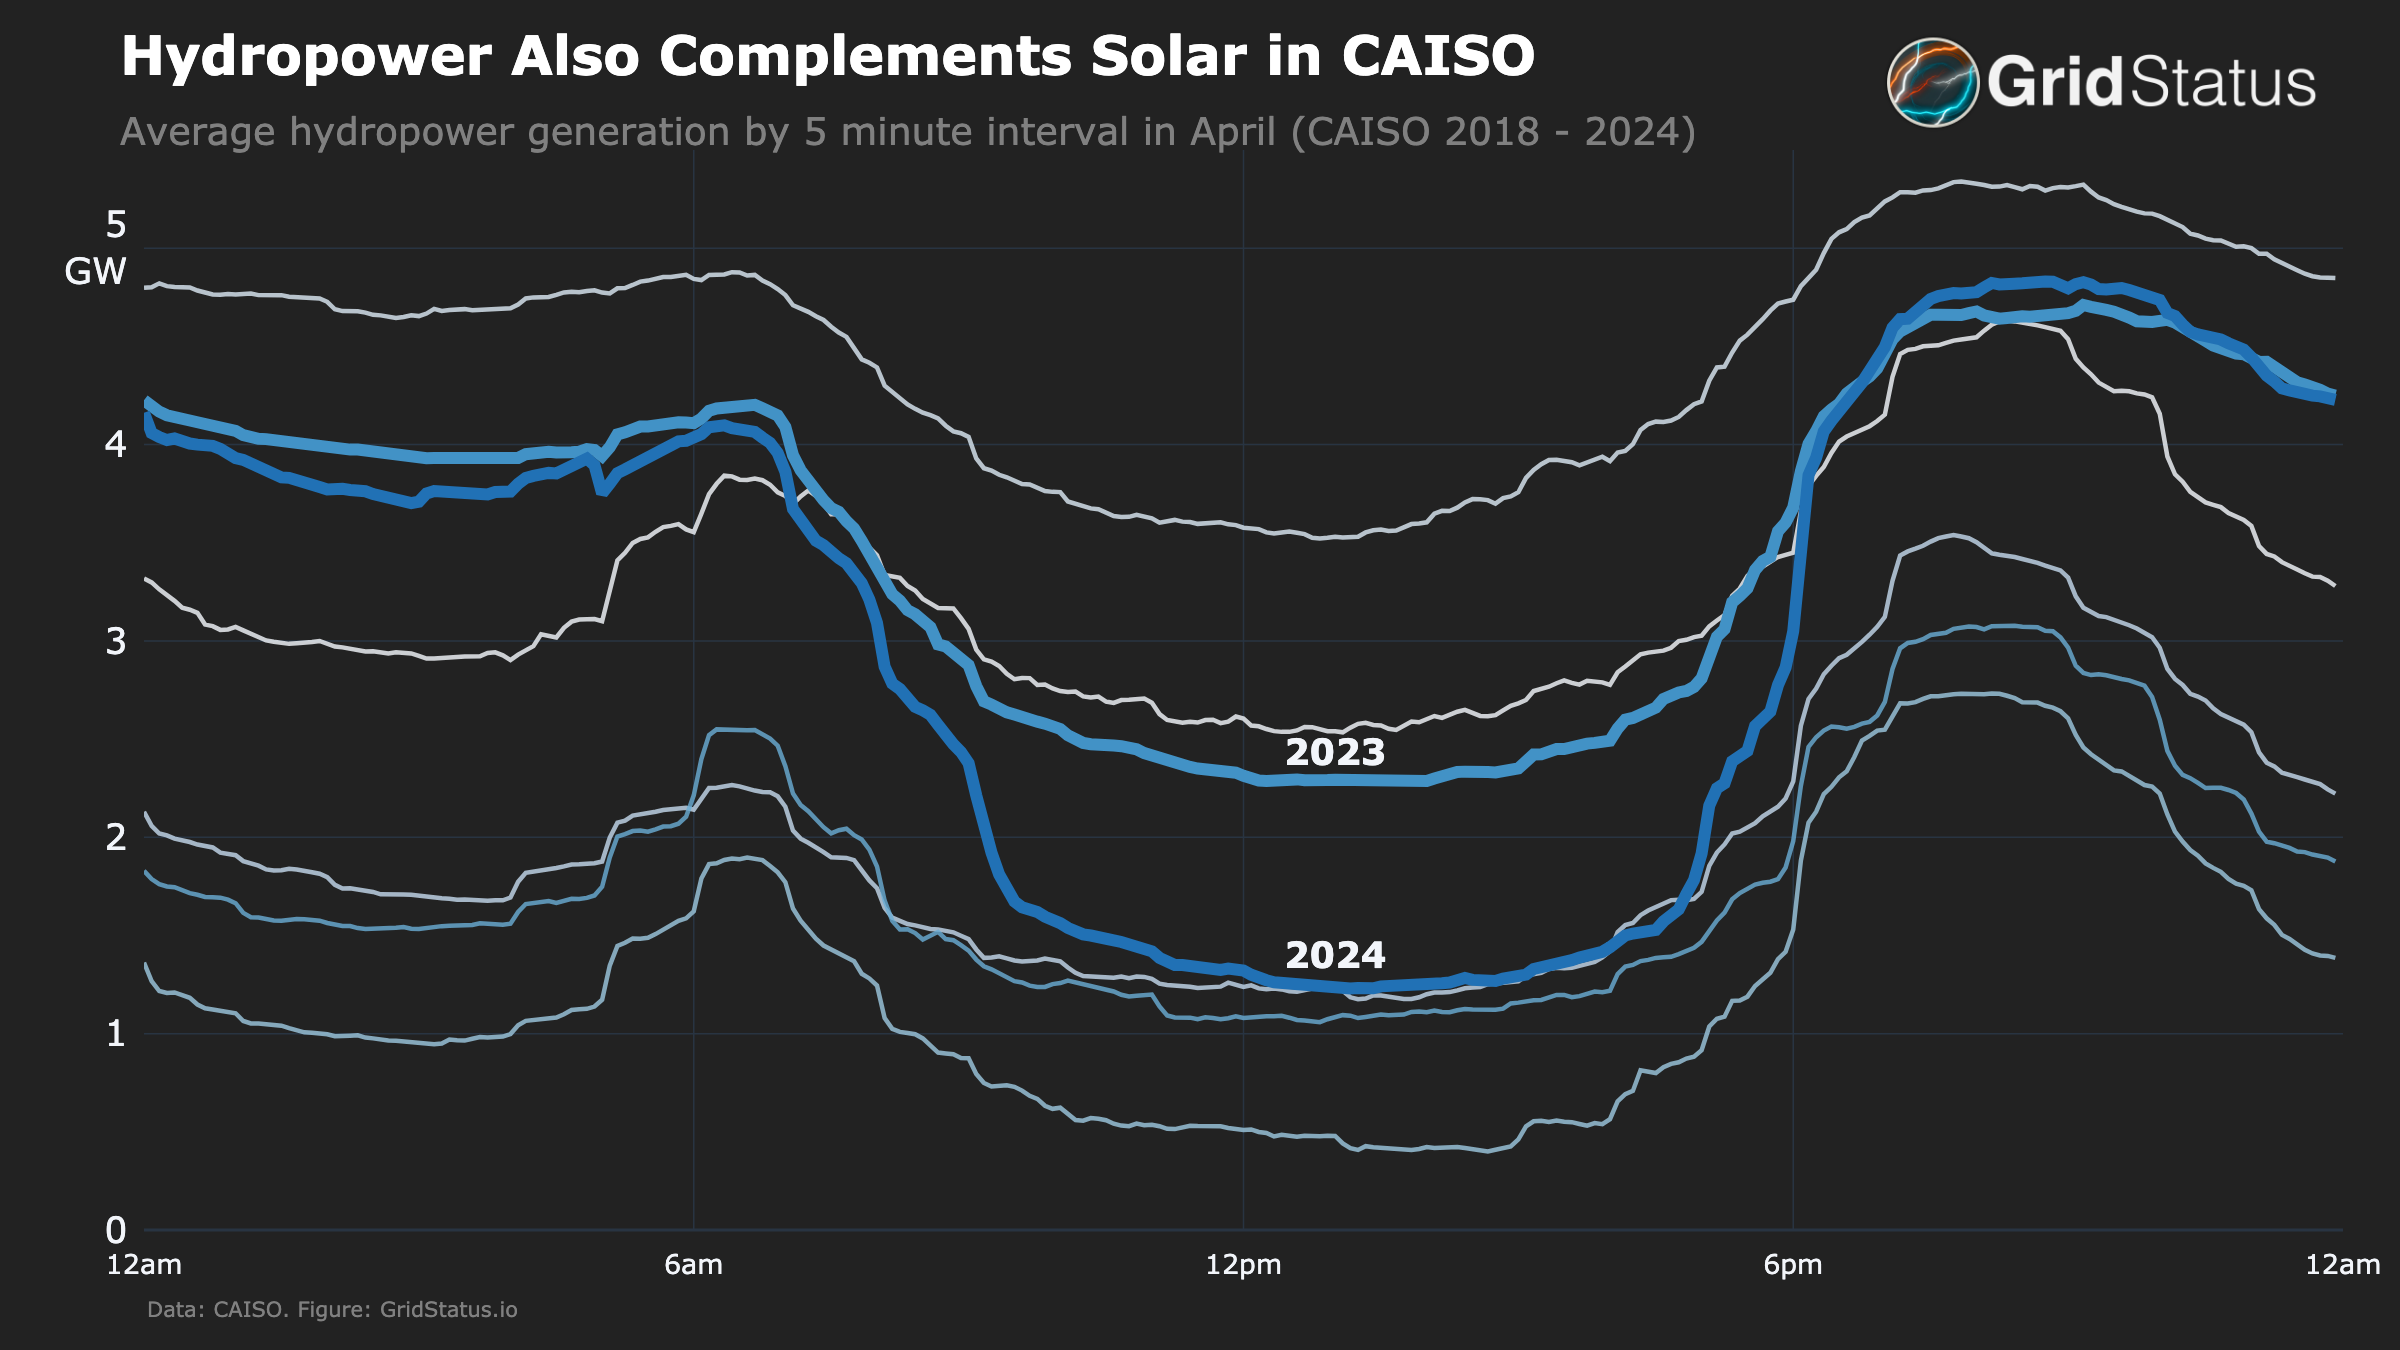
Lower midday usage of hydropower is highly desirable for the CAISO system as it allows for greater dispatch of hydropower resources during the hours without solar generation - a textbook complementary system. Snowpack-fed hydropower systems in the western United States display substantial variability across a year as water levels are managed on a longer timeframe than their eastern cousins, which are typically not reliant on a single season’s precipitation to remain operational. By reducing the need for midday hydropower, a significant portion of a given year’s available MWhs can be shifted towards more critical periods.
The evening peak erosion pattern for gas generation is also present for hydropower, although this weathering is not dissimilar to 2023 and has not yet reached the level setting of gas’ featureless plain.
Collaborating with Neighbors
Now, let’s take a look at the last major variable piece of CAISO’s operations, interchange.
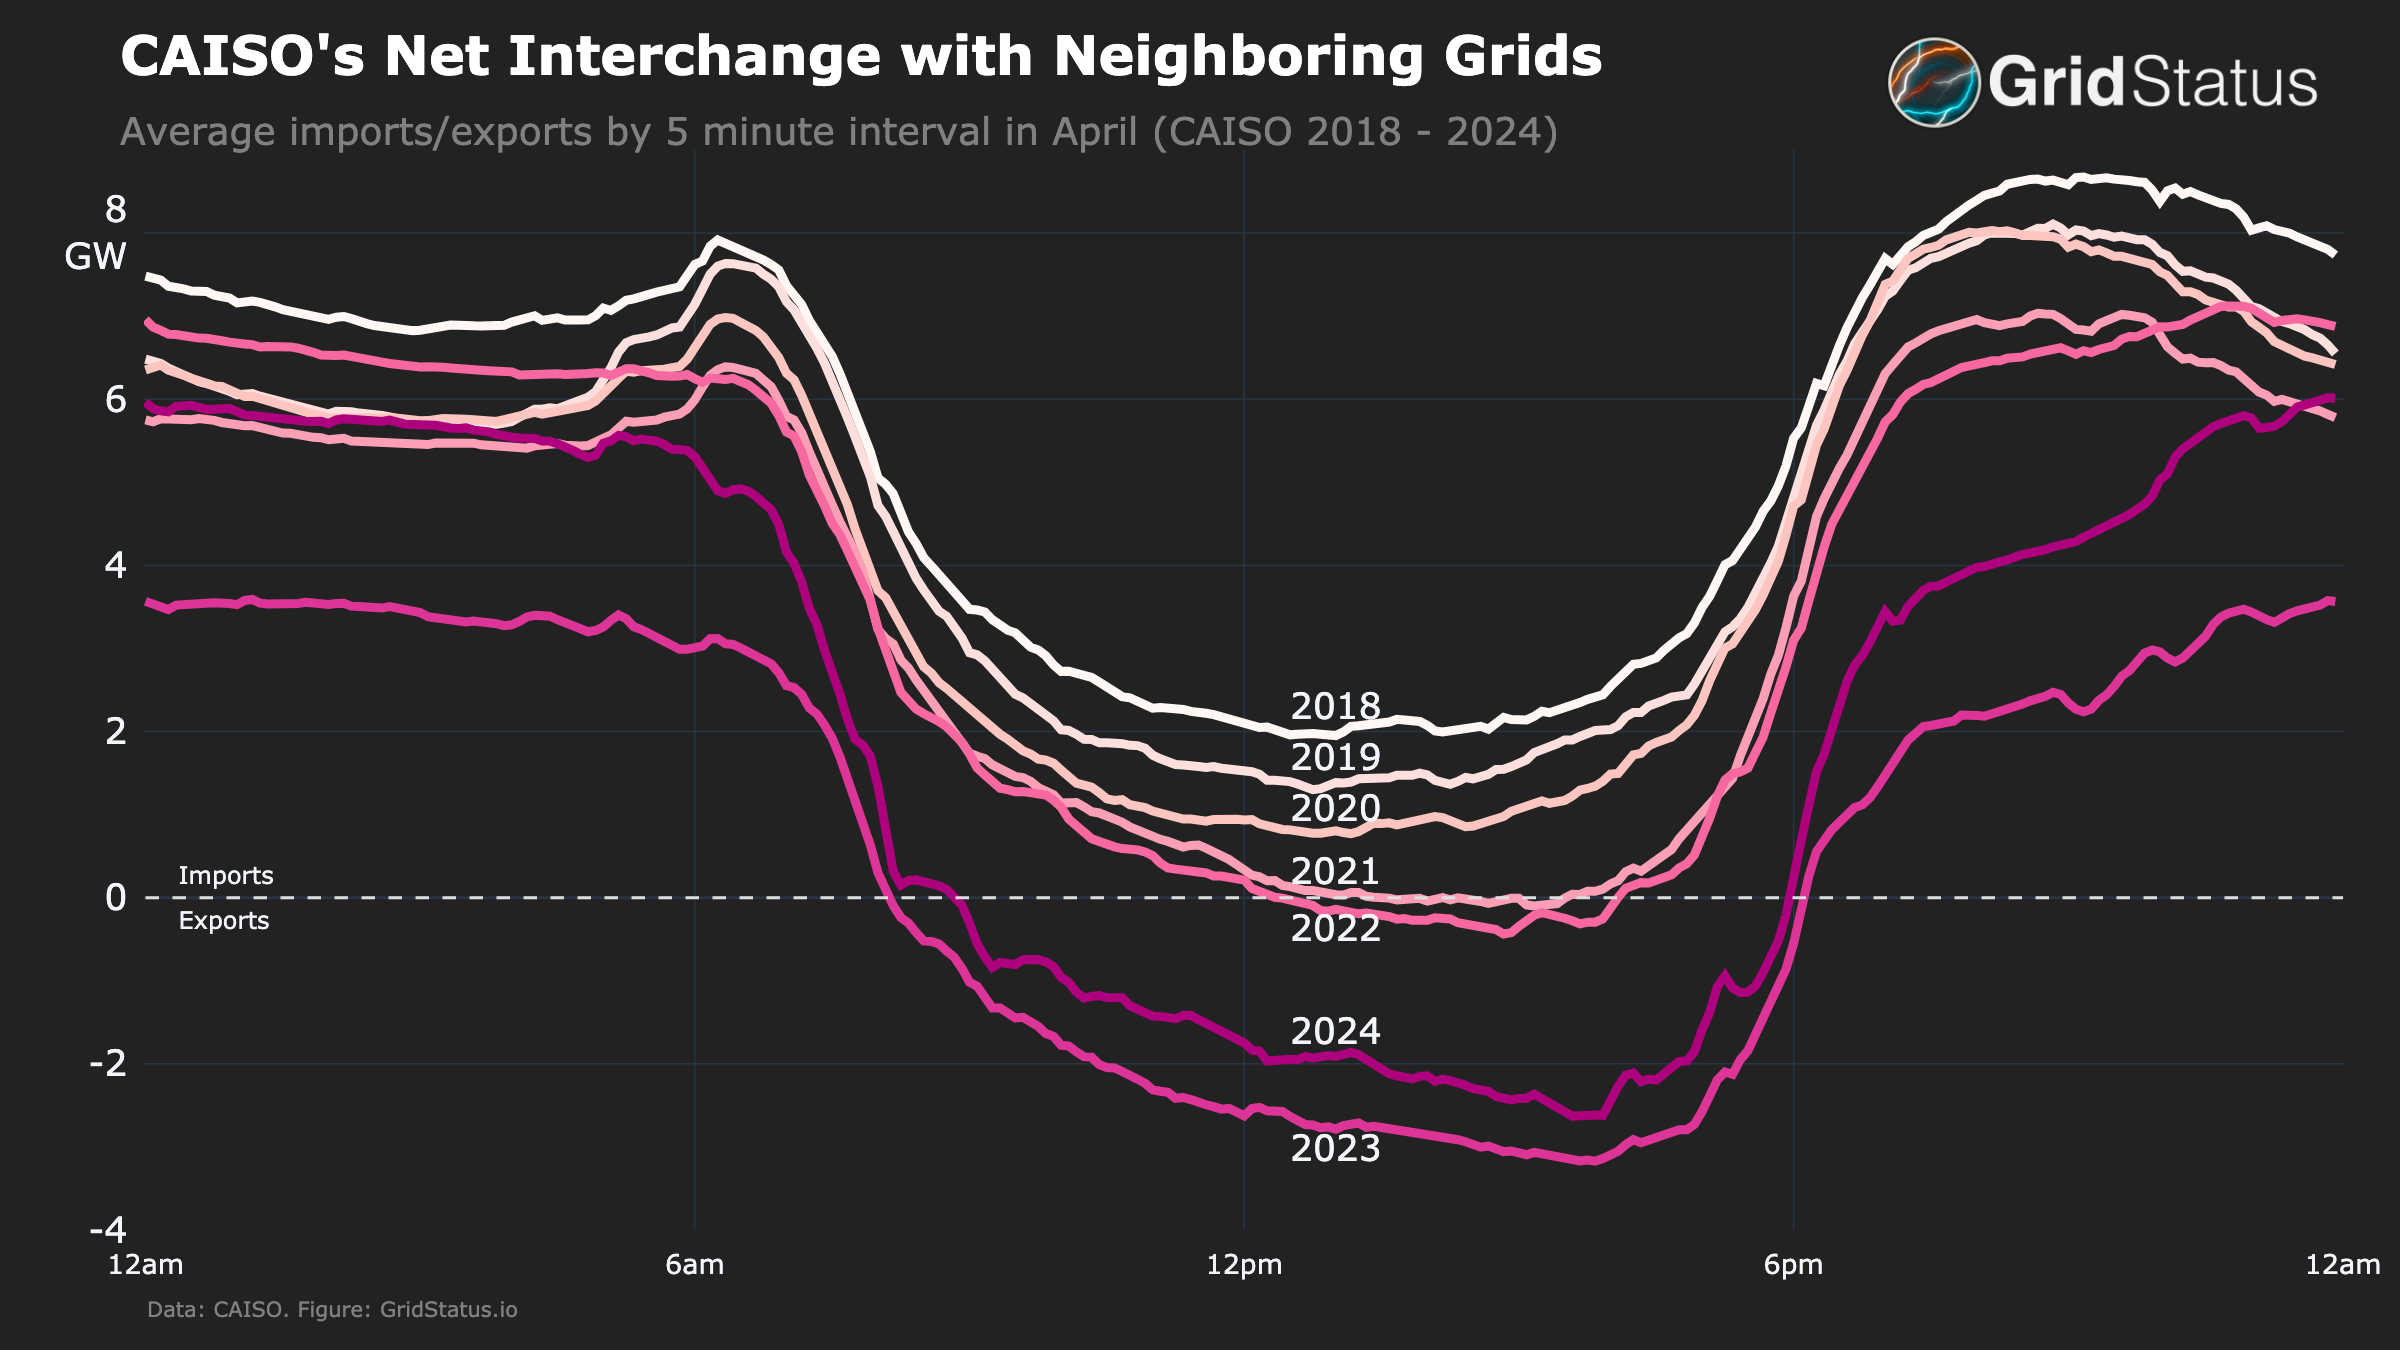
Alongside the uptick in battery operations and solar generation and the downtick in gas, CAISO has, on average, reduced their midday exports. 2023 had seen a dramatic expansion of exports during daytime hours which correlated with the substantial uptick in gas generation. In 2024, despite the increase in solar generation, midday exports have actually declined somewhat while the overnight imports have returned to pre-2023 levels. This suggests that the overall shift down in natural gas generators held online in CAISO to deal with ramping issues may have contributed to an increase in off-peak imports.
With the changes in CAISO’s generation mix detailed above, these exports to the rest of the west are substantially cleaner than they were in 2023. By driving down the commitment of uneconomic gas for operational reasons, batteries within CAISO also ensure that the wider system balance in the west has had to absorb fewer MWhs of inflexibly committed generation in CAISO.
The Big Load Shift
CAISO’s load has been low this April, with a relatively mild spring, the continued march of BTM solar installations, and energy efficiency upgrades. However, with changes to the state’s net-metering program, BTM solar growth has started to slow.
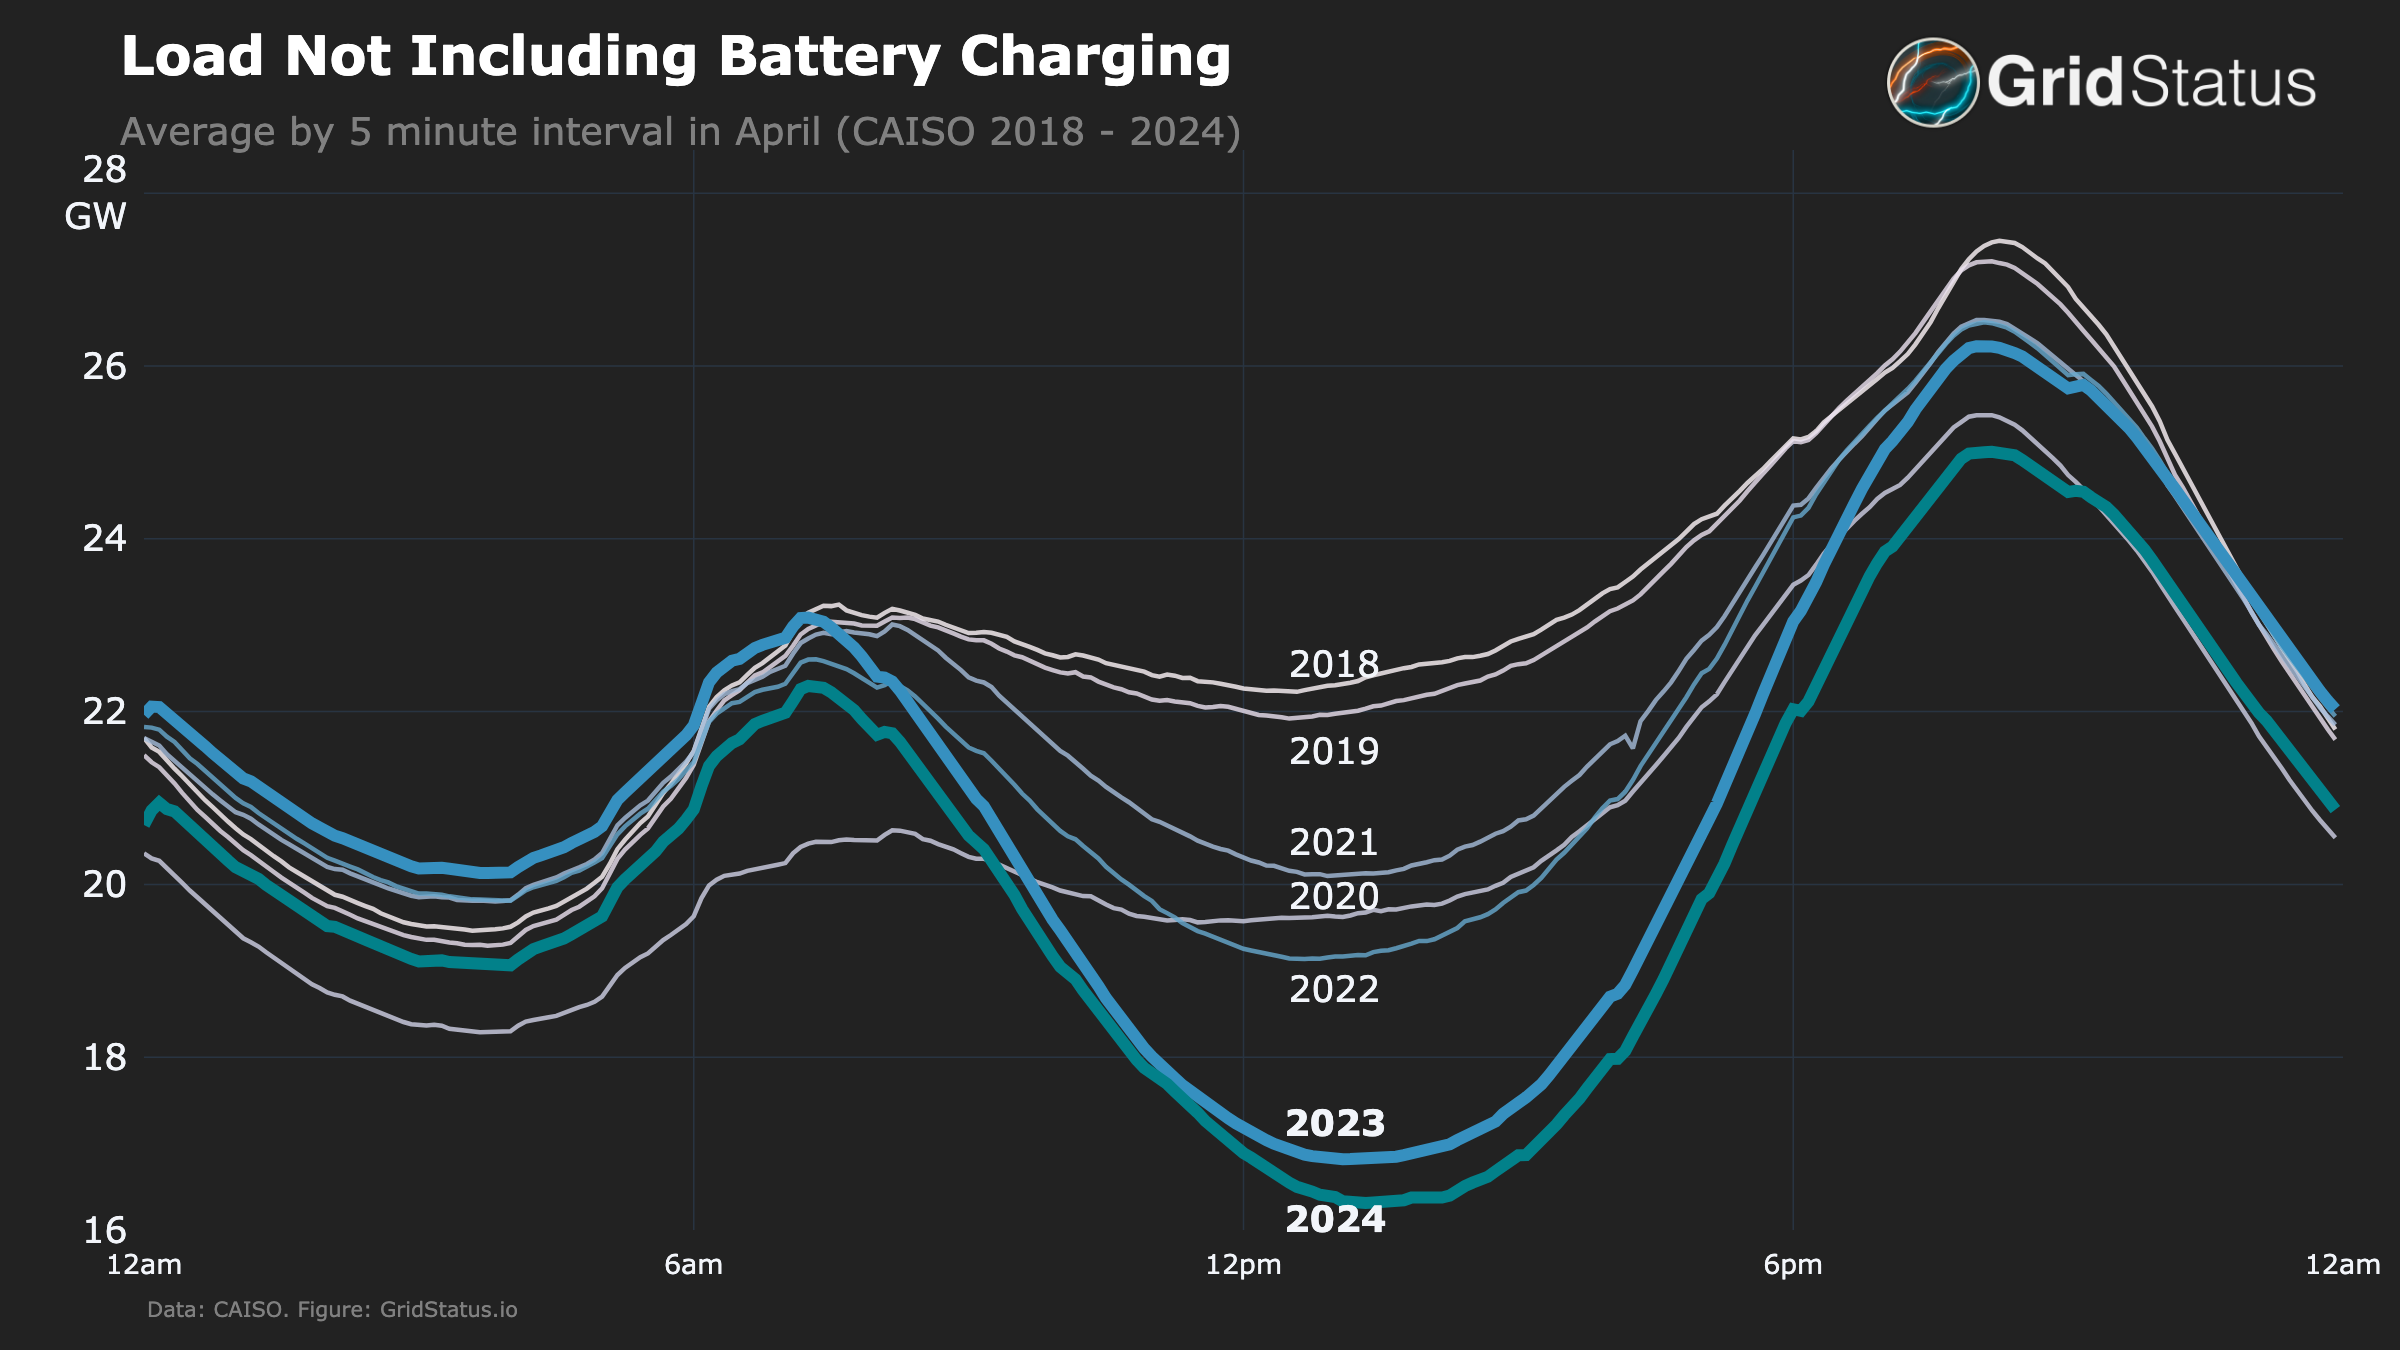
All of the different generation sources we discussed so far are running with the goal of serving load. And, through the lens of load, 2023 and 2024 finally look more similar, but there is one major factor missing, the key driver we’ve been focusing on, batteries. One quirk of CAISO’s load reporting is that they do not include battery charging, which distorts the picture of total demand on the grid. To ameliorate this, we have added it back in the figure below, which dramatically alters the shape of the load curve for 2024.
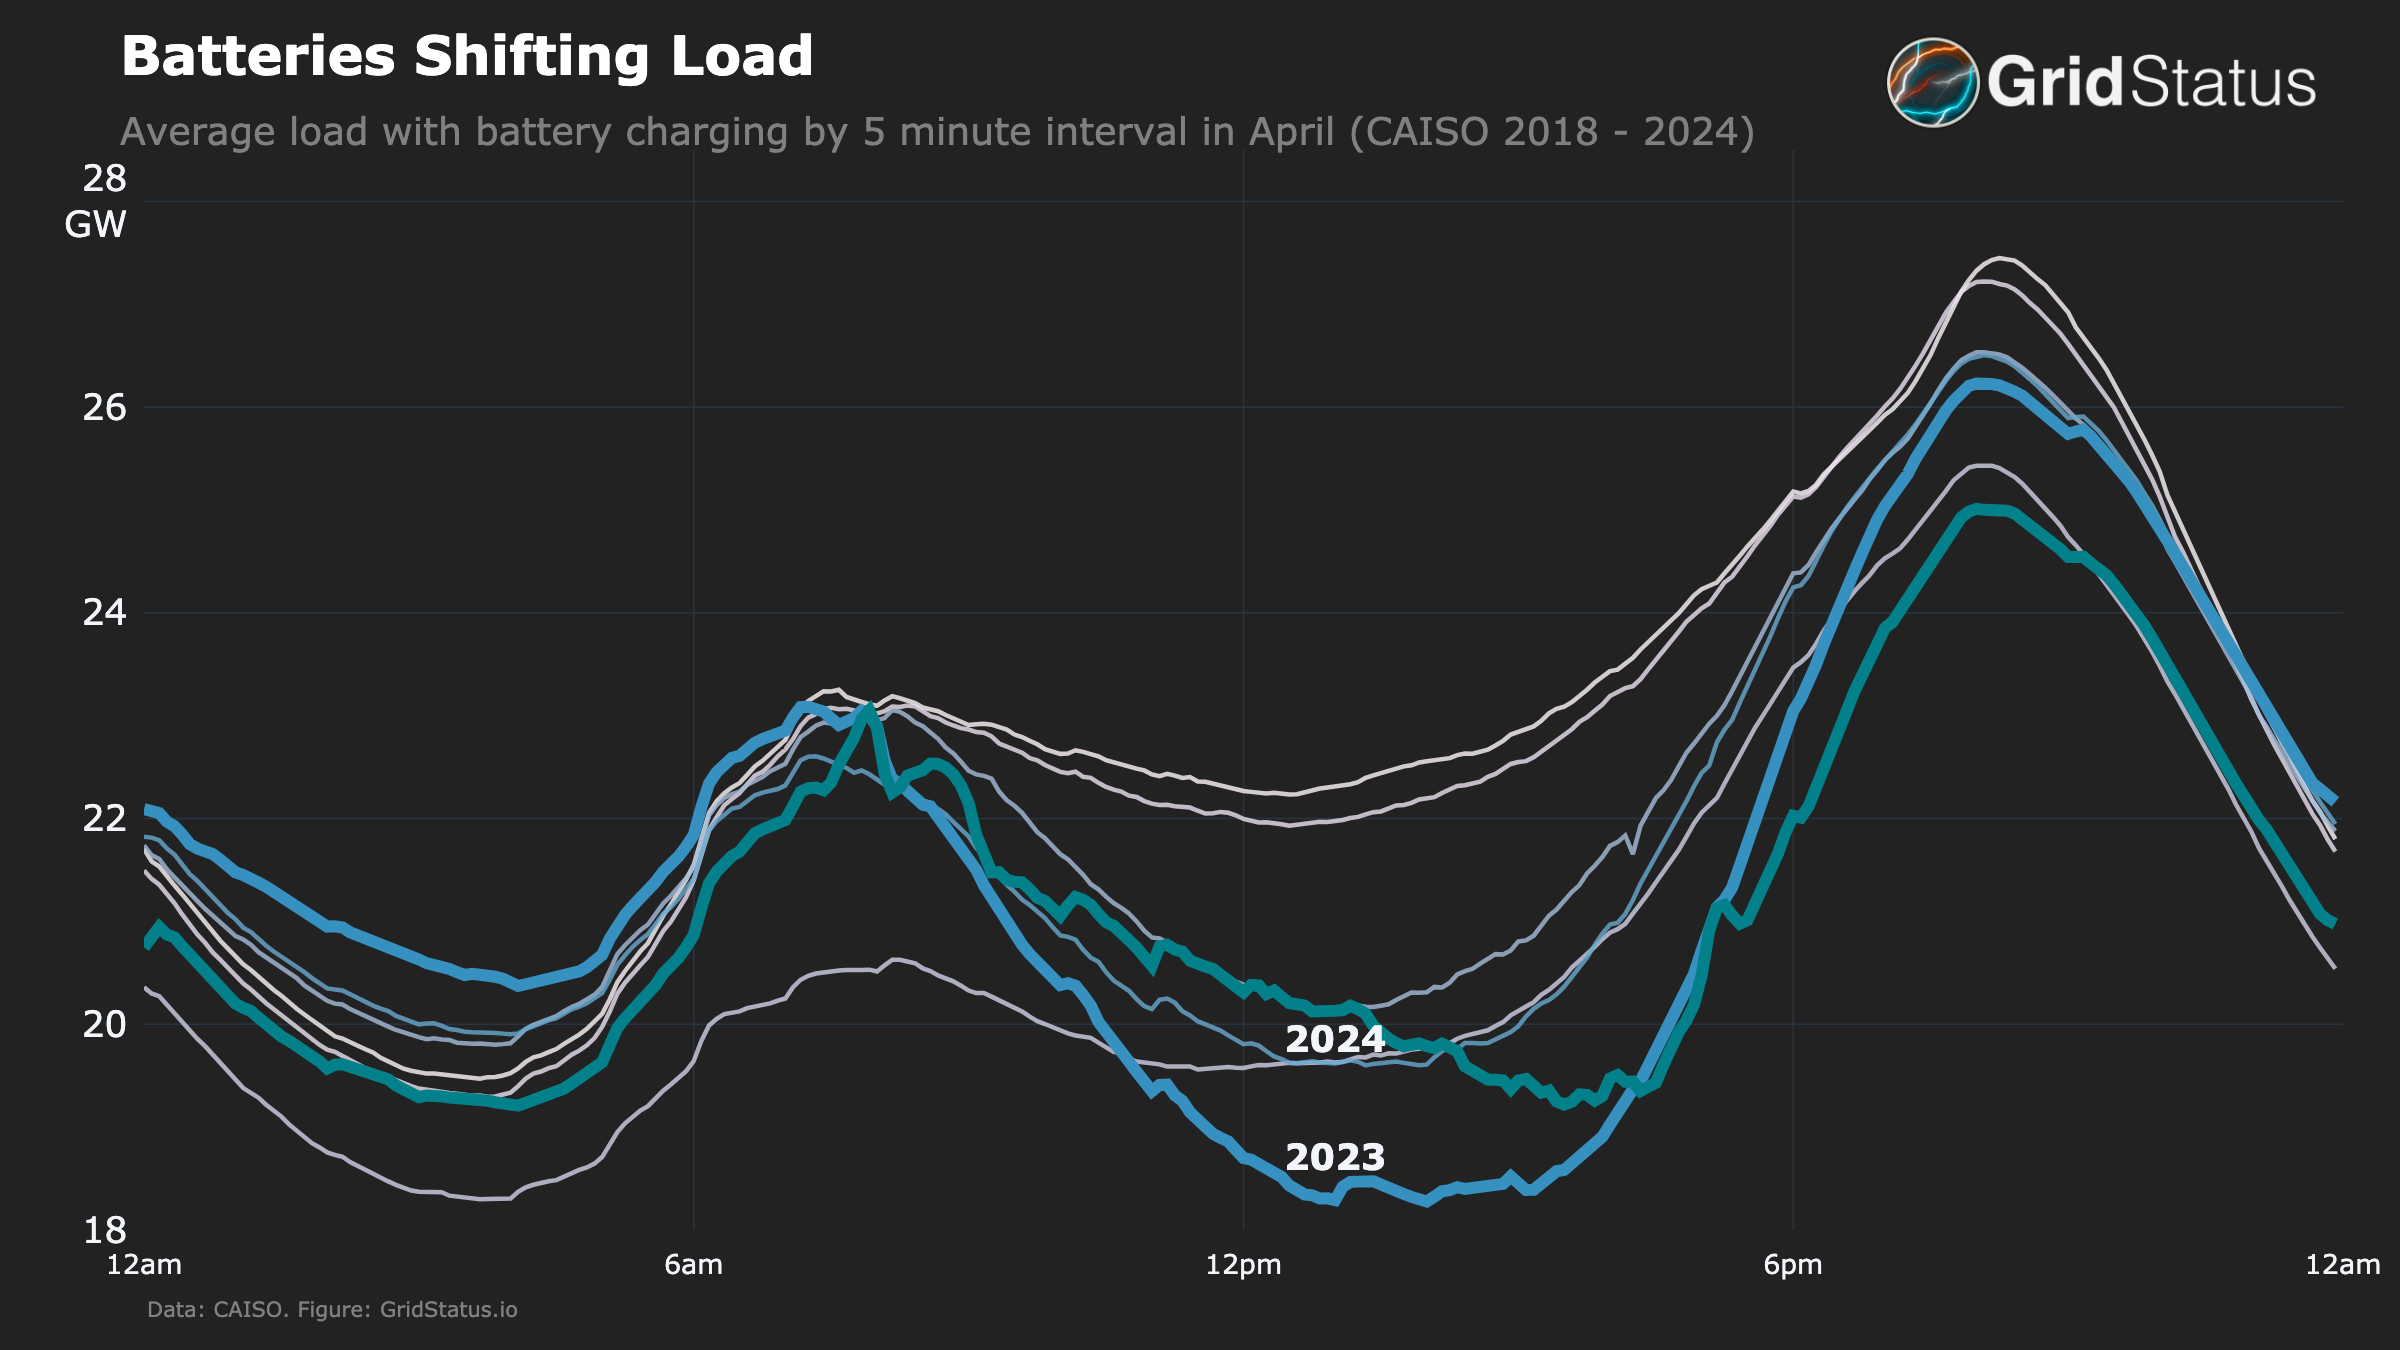
Batteries elongate the downward ramp in load and shift the daytime minimum load to later in the day. As a result, batteries seem to be having a clear positive impact on the exact operational issues around ramping that have been the topic of so much discussion in recent years.
Conclusion
The key question going forward is whether this is indicative of a new reality in CAISO, or simply an outlier spring. While many elements point to this being a structural change largely driven by the increased presence of batteries, the grid is changing quickly and sometimes in unpredictable ways. Those changes aren’t limited to physical assets either, as market consolidation in the West is poised to substantially alter management of the western interconnection by the end of the 2020s, a topic we wrote about last year. Whether or not this progress is continued in the years to come, this spring will still stand as a shift, the first time California’s ugly duckling demand curve began to resemble the intended swan.
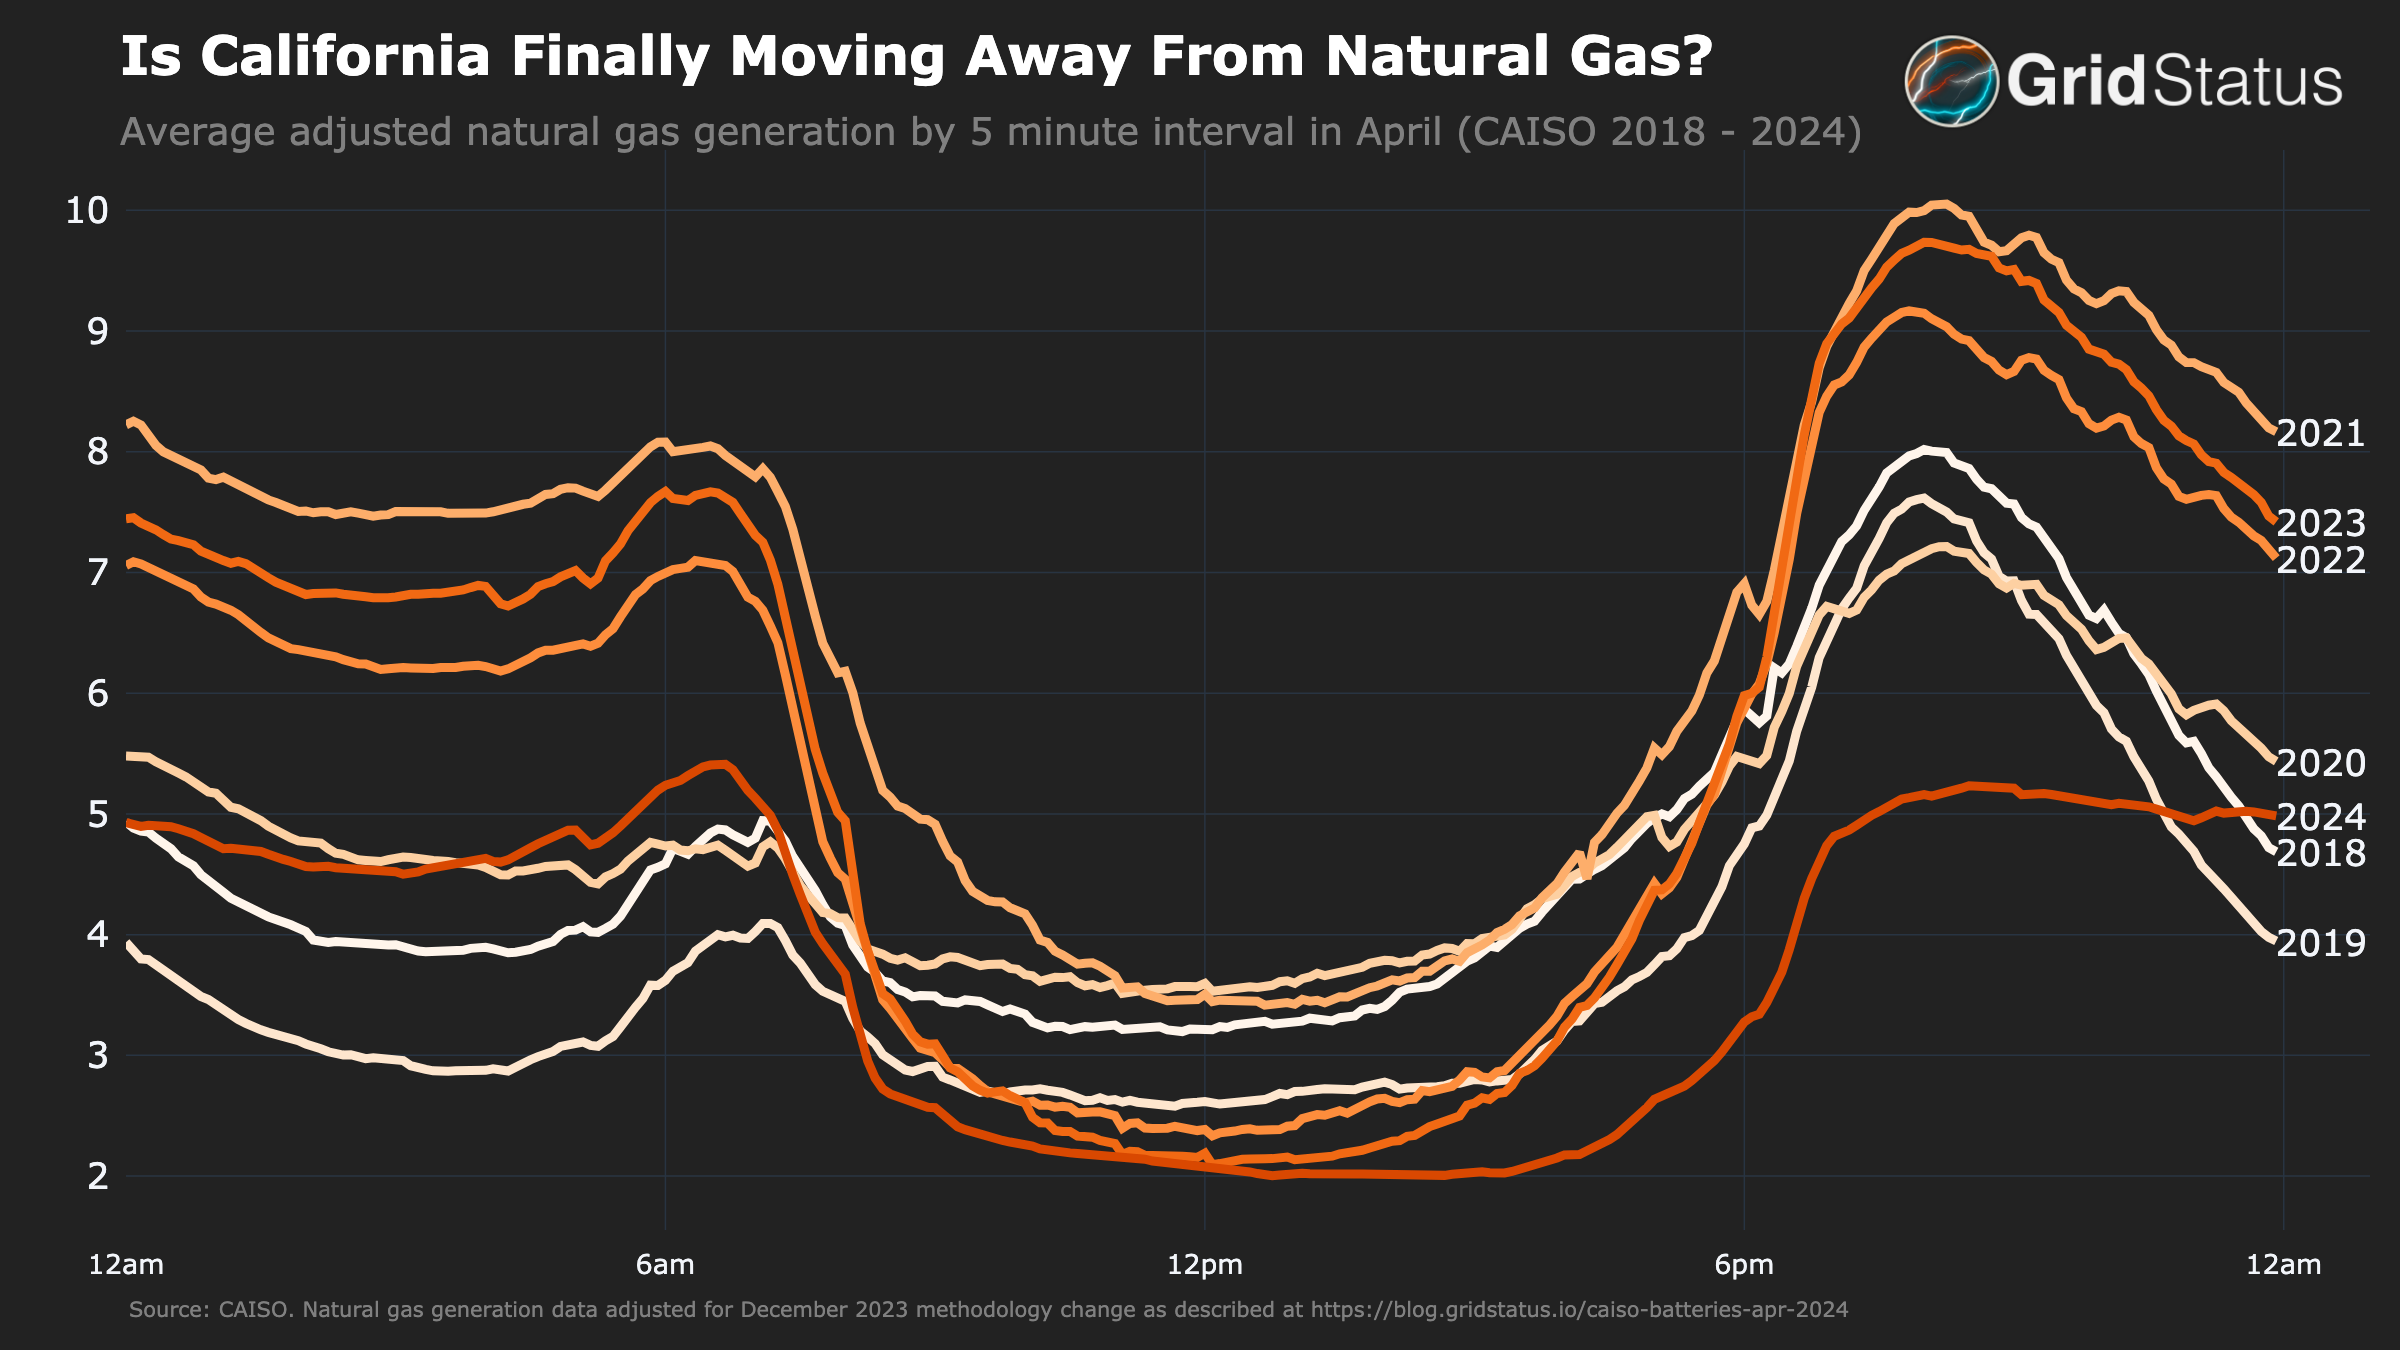
Adjusted Natural Gas Methodology
In mid-December of 2023, CAISO changed its methodology for reporting natural gas generation. While initial inquiries implied a limited impact, certain areas of CAISO’s website indicate that comparing data before and after the change cannot be done.
Upon review of CAISO’s natural gas generation reporting change, we determined that this change may have been related to a growing discrepancy between public supply and demand numbers in CAISO. The table below shows an increasing gap between the sum of supply and demand over the previous Aprils. This discrepancy has been reported to CAISO and we will update this post if we learn more.
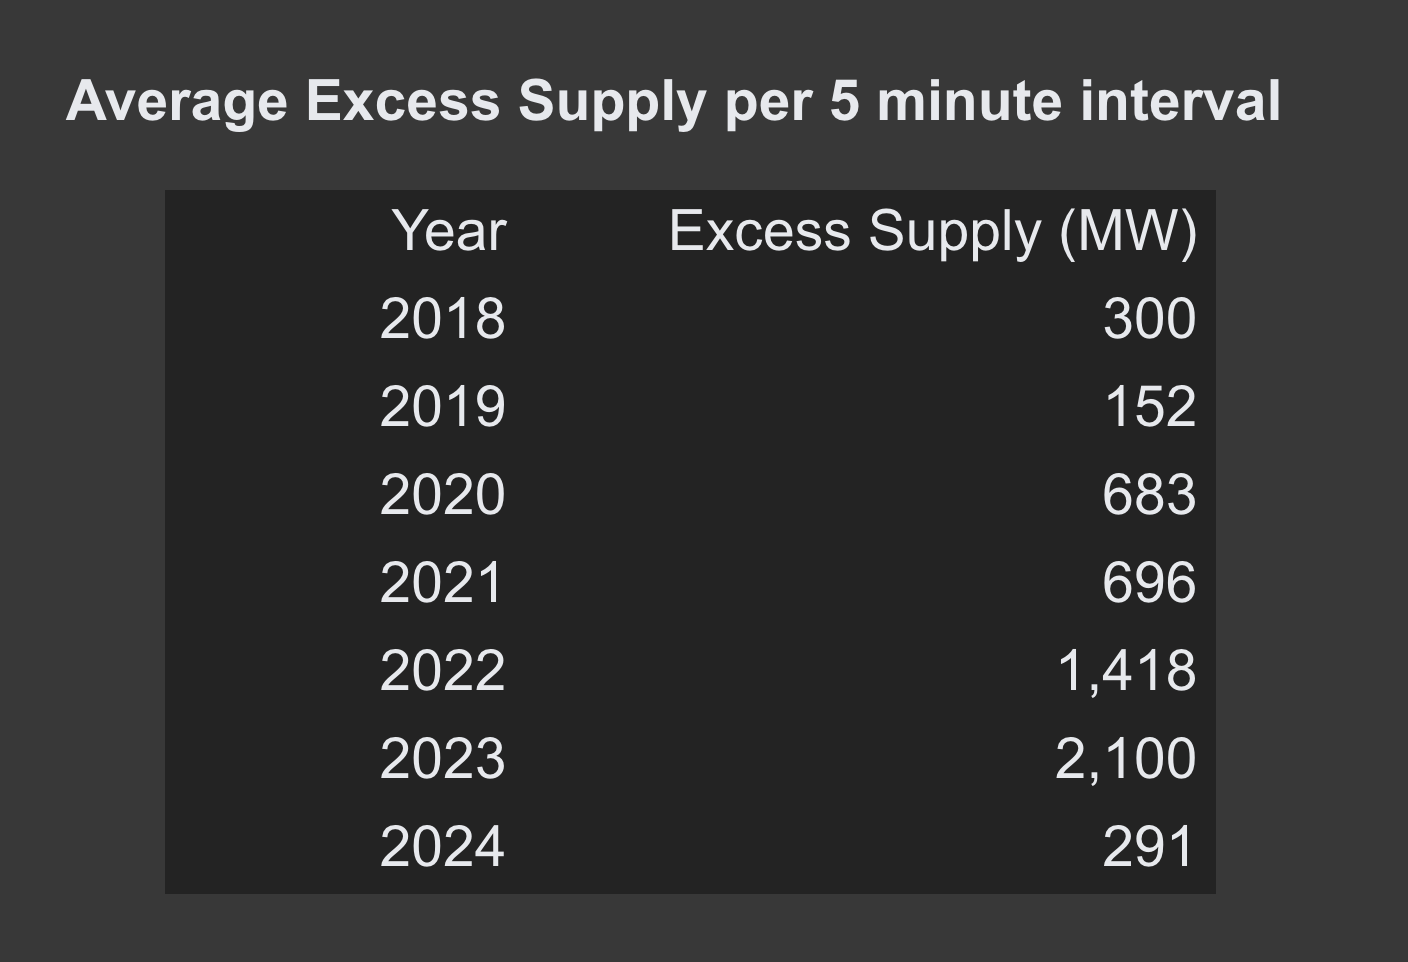
Because this discrepancy affects a key piece of this analysis, we have generated a "adjusted natural gas" generation value under a new methodology for years prior to 2024 that we believe is more suited for comparison.
Simply put, we match supply and demand by adjusting natural gas. The ratio between the two is determined based on each 5-minute interval during April 2024, with a floor of 1 i.e supply can never be below demand. For each matching interval in previous years, gas generation is capped at that value times demand minus all other sources of supply. The ratio is meant to represent some normal amount of losses. The formula for this Adjusted Gas Generation value is as follows:
Adj. Gasinterval = (Demand MWhinterval * ratiointerval) - (Non-Gas MWhinterval)
This adjustment can be visualized in terms of the MW gap between supply and demand per 5 minutes interval.
Despite this dramatic adjustments made to 2023 and 2022, the figure published in the post above still shows record-low midday gas generation as well as flattening of evening demand. The original natural gas chart without any adjustments is shown below.