One Year of IESO Market Renewal in Ontario
Canada's most populous province, Ontario, just celebrated the one-year anniversary of its nodal power market. We're taking a look at market trends, how outcomes tracked against expectations, and quirks across the market.


One year ago, Ontario's power market and its operator, the Independent Electricity System Operator (IESO), began a series of transformative changes known as the Market Renewal Program (MRP). We're breaking down the outcomes so far, wider trends, and the quirks that come with a new nodal market.
For those who need a refresher, take a look at our deep dive on the history of Ontario's power market and more details on changes made in the MRP.
- Pricing changes
- Fuel Mix
- Zonal Congestion
- Market Congestion
- Capture Prices
- Exports
- Demand
- LMPs and Price Floors
- Loss Costs
Money is Everything
One of the MRP’s biggest changes was the introduction of nodal pricing, reshaping market outcomes and the price signals sent to generators.
Prior to the MRP, IESO pricing was defined by the Hourly Ontario Energy Price (HOEP), an average of 5-minute market-clearing prices used to determine rates province-wide. While the MRP introduced nodal locational marginal prices (LMPs) to the province, the concept of a load-weighted pricing location did not go away. As part of the MRP, the Ontario Zonal Price (ONZP) was introduced, established in part to address concerns from large loads that they could be exposed to wide fluctuations in energy prices with the shift to nodal LMPs.
In addition to the new pricing regime, major changes were made to how assets are scheduled. The MRP introduced a Day-Ahead Market (DAM) to the province. Generators and other participants submit bids to buy or sell electricity, which are matched to market load forecasts, generating financially binding obligations that must be met in the real-time market.
Known as the two-settlement system, this benchmark of deregulated markets allows generators and consumers to lock in prices a day ahead and rely on the real-time market to absorb any unforeseen changes in demand or supply. The Day-Ahead market generates prices based on expected conditions and sees the vast majority of energy bought and sold. The real-time market, often called the balancing market, calculates LMPs every 5 minutes to solve for deviations in load, generation, or exports. The difference between the two prices, known as the DA/RT spread, can indicate where the price premium lies.
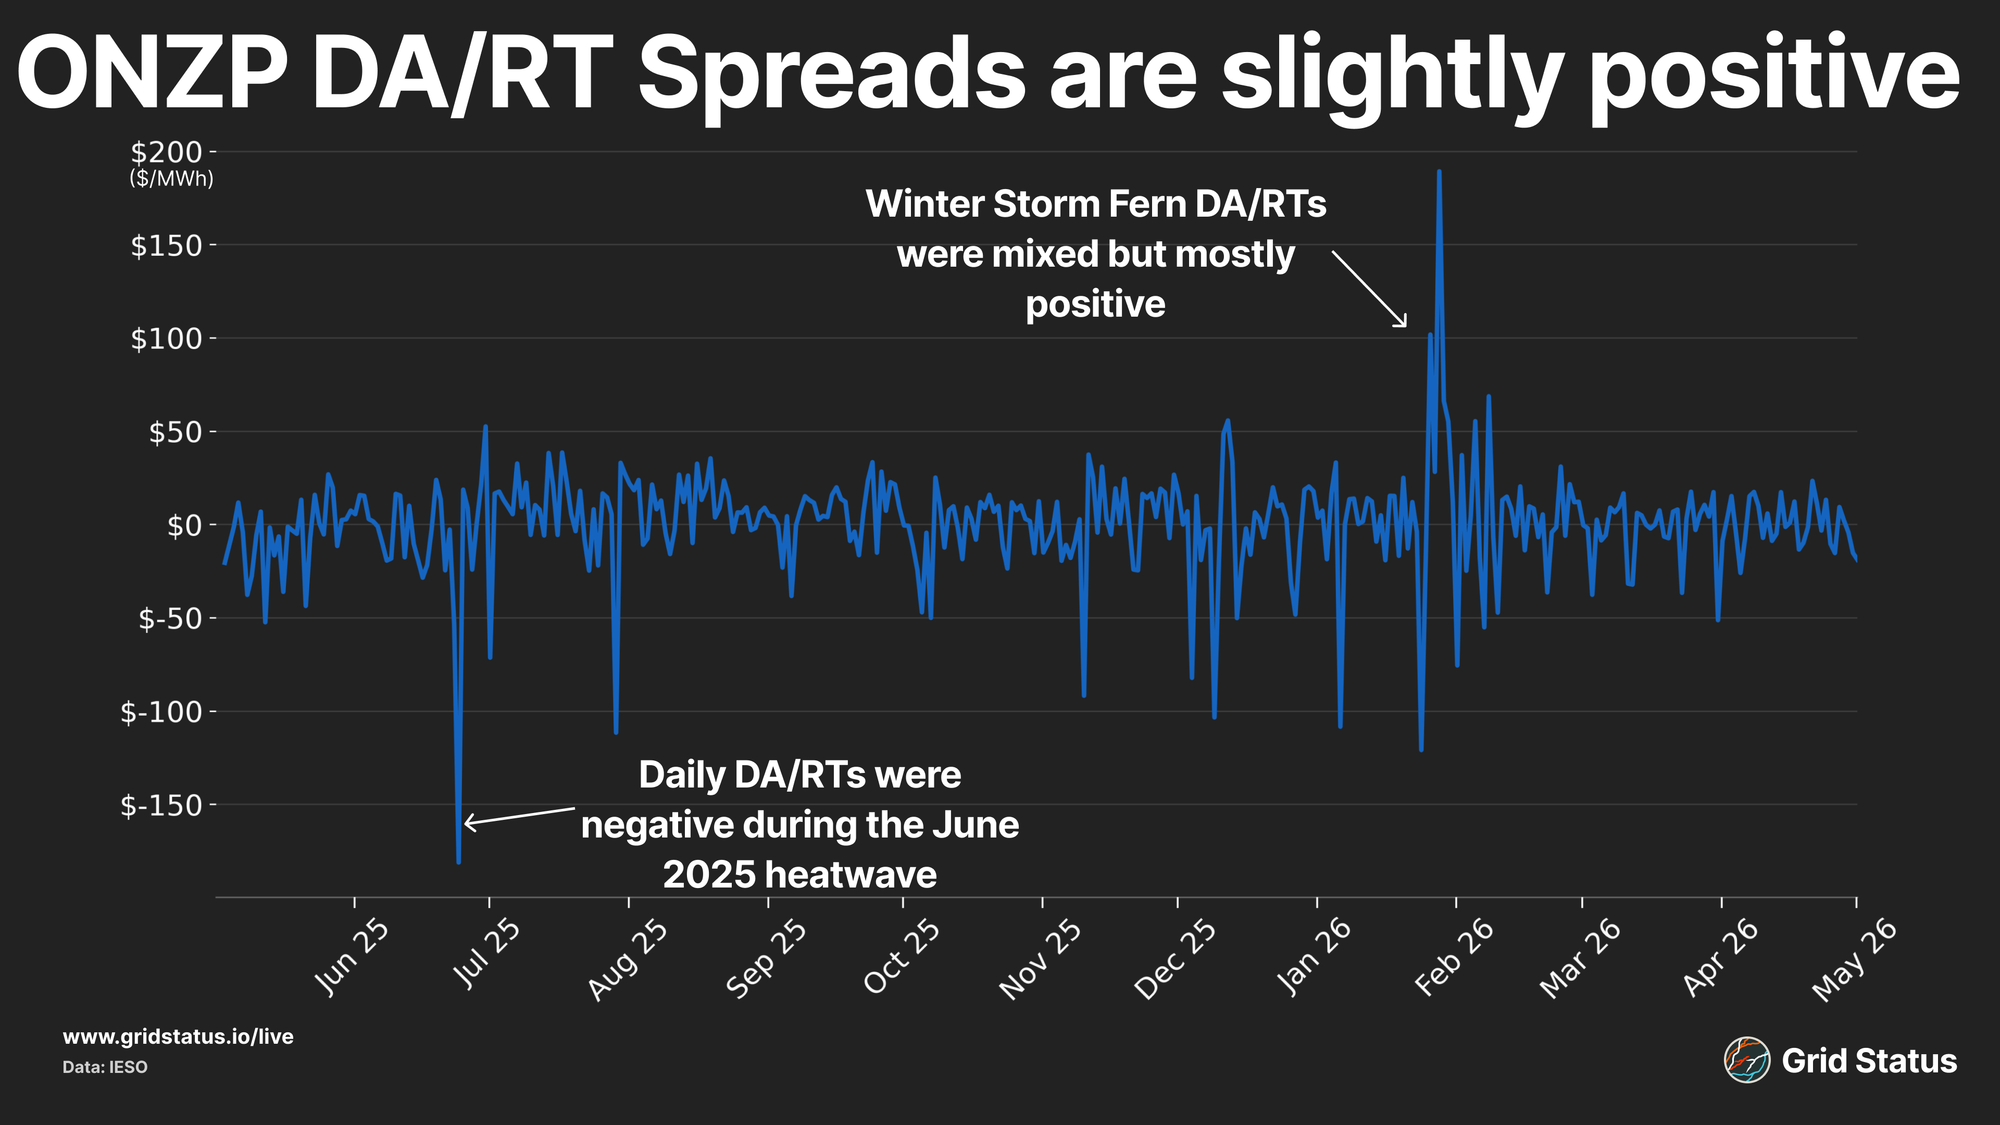
Since the MRP went live, daily ONZP DA/RT spreads have been slightly positive, reflecting a Day-Ahead price premium of roughly $0.75/MWh. While most DA/RT spreads are typically a few dollars in either direction, extreme outliers are visible, such as a strong real-time premium during the late June 2025 heatwave and a day-ahead premium at the end of January 2026.
While the ONZP gives a general picture of how pricing has shaped up since the MRP launched, it also fills an important role in determining the cost of energy for the province's large commercial users.
Under the MRP, active loads, which made up around 14% of system demand, could elect to take nodal pricing and manage fluctuations to maximize potential savings, or revert to the ONZP for greater certainty. Notably, the costs that loads pay are not purely driven by the ONZP, or formerly the HOEP, as the global adjustment (GA) has often made up a significant share of total costs.
GA costs are out-of-market payments made to generators that vary by month based on the total cost of energy procured. In practice, these charges function as a combination of make-whole payments to contracted generators and demand charges, as large industrial and commercial customers pay more based on their consumption during peak demand periods.
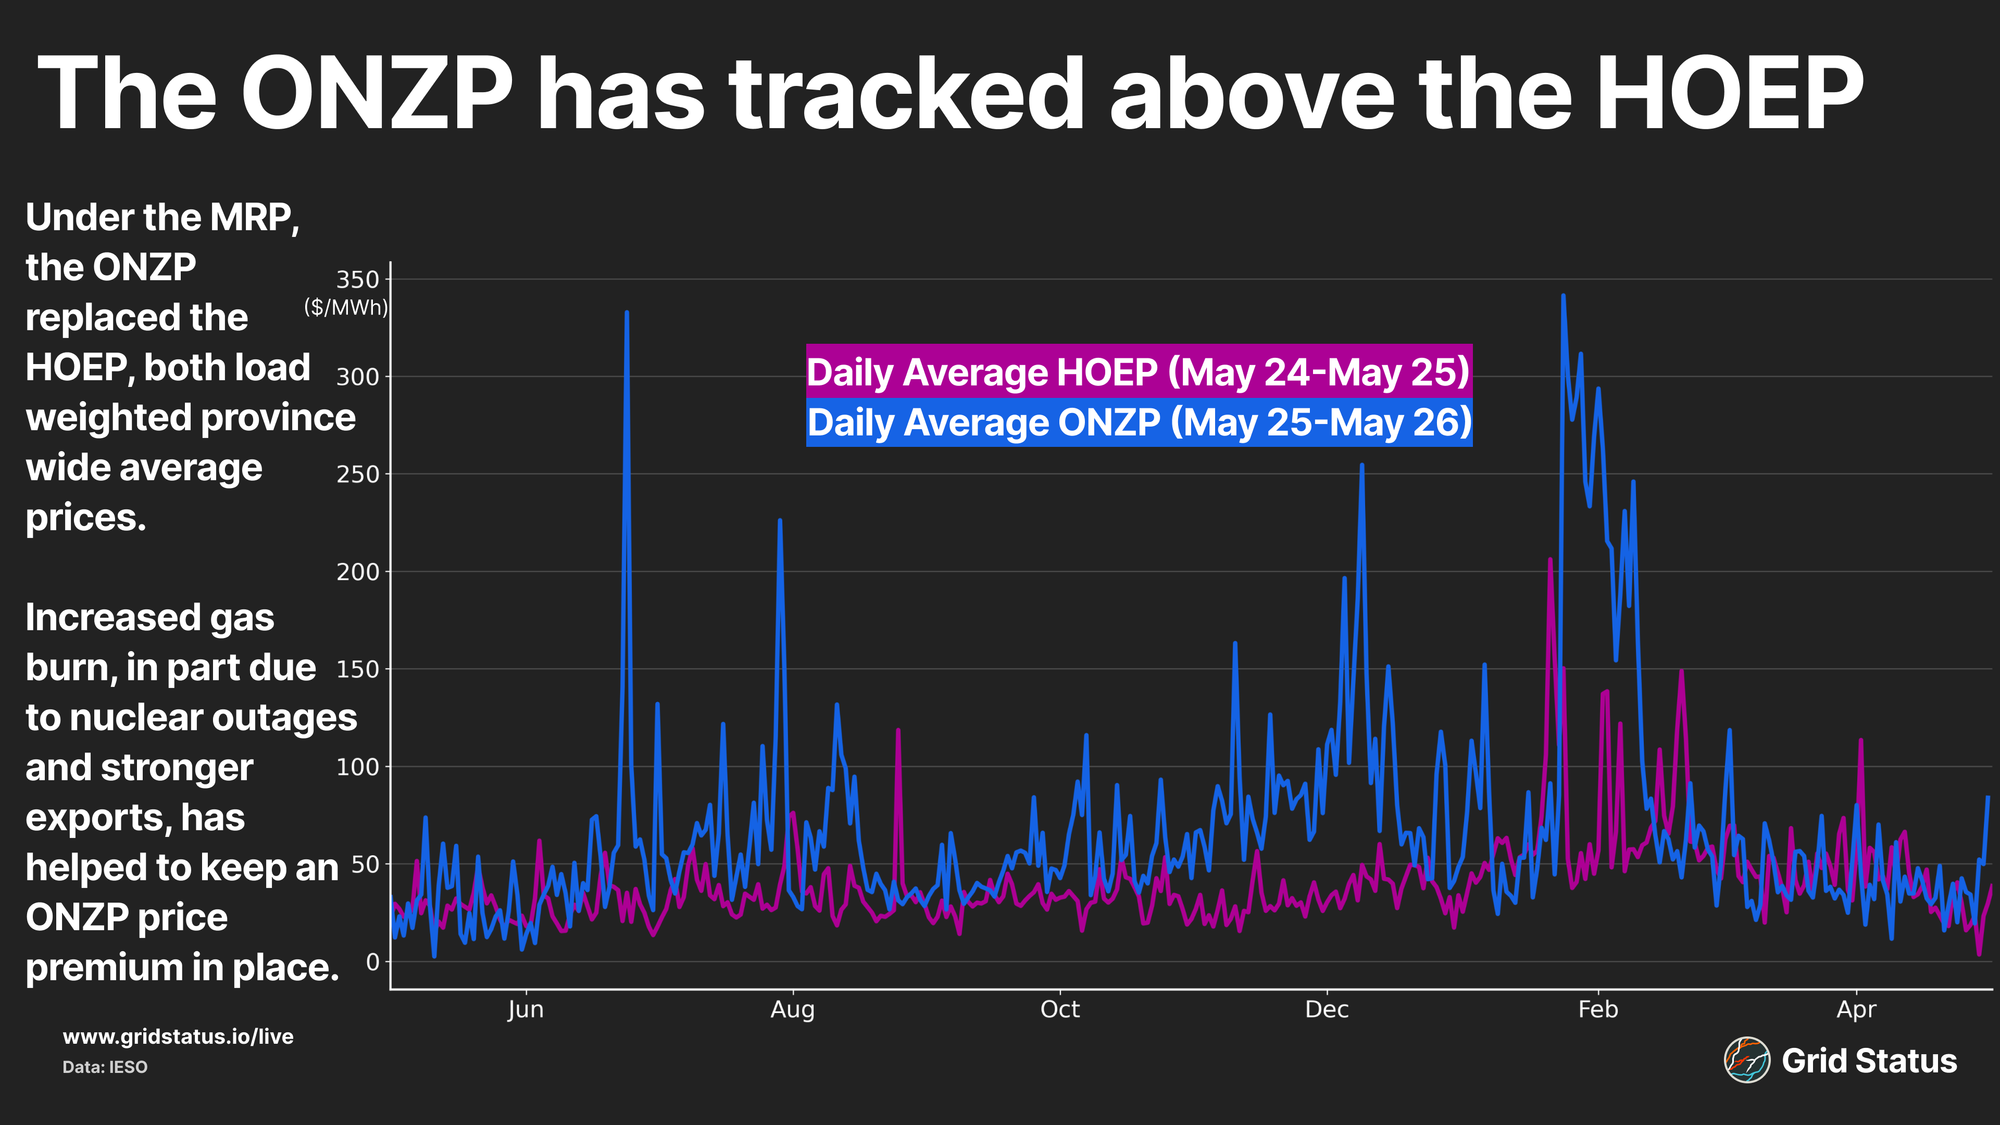
Since its inception, the ONZP has tracked well above the HOEP's final year, with average daily costs coming in above the HOEP in nearly every month.
Increasingly Gas, No Breaks
IESO's unique fuel mix has given it advantages over its neighboring provinces and American counterparts. Ontario's baseload nuclear fleet provides a reliable, cheap, and zero-carbon backbone, while freeing the region's vast hydroelectric resources to operate as a form of dispatchable power. Unlike Quebec, however, Ontario is less dependent on hydro and therefore less exposed to drought impacts.
Beyond its baseload nuclear and hydro fleet, wind and solar have been built out across the province, though the renewable buildout has been led primarily by wind. To fill the gap, Ontario is home to a fleet of gas generators concentrated largely in the southern portions of the province.
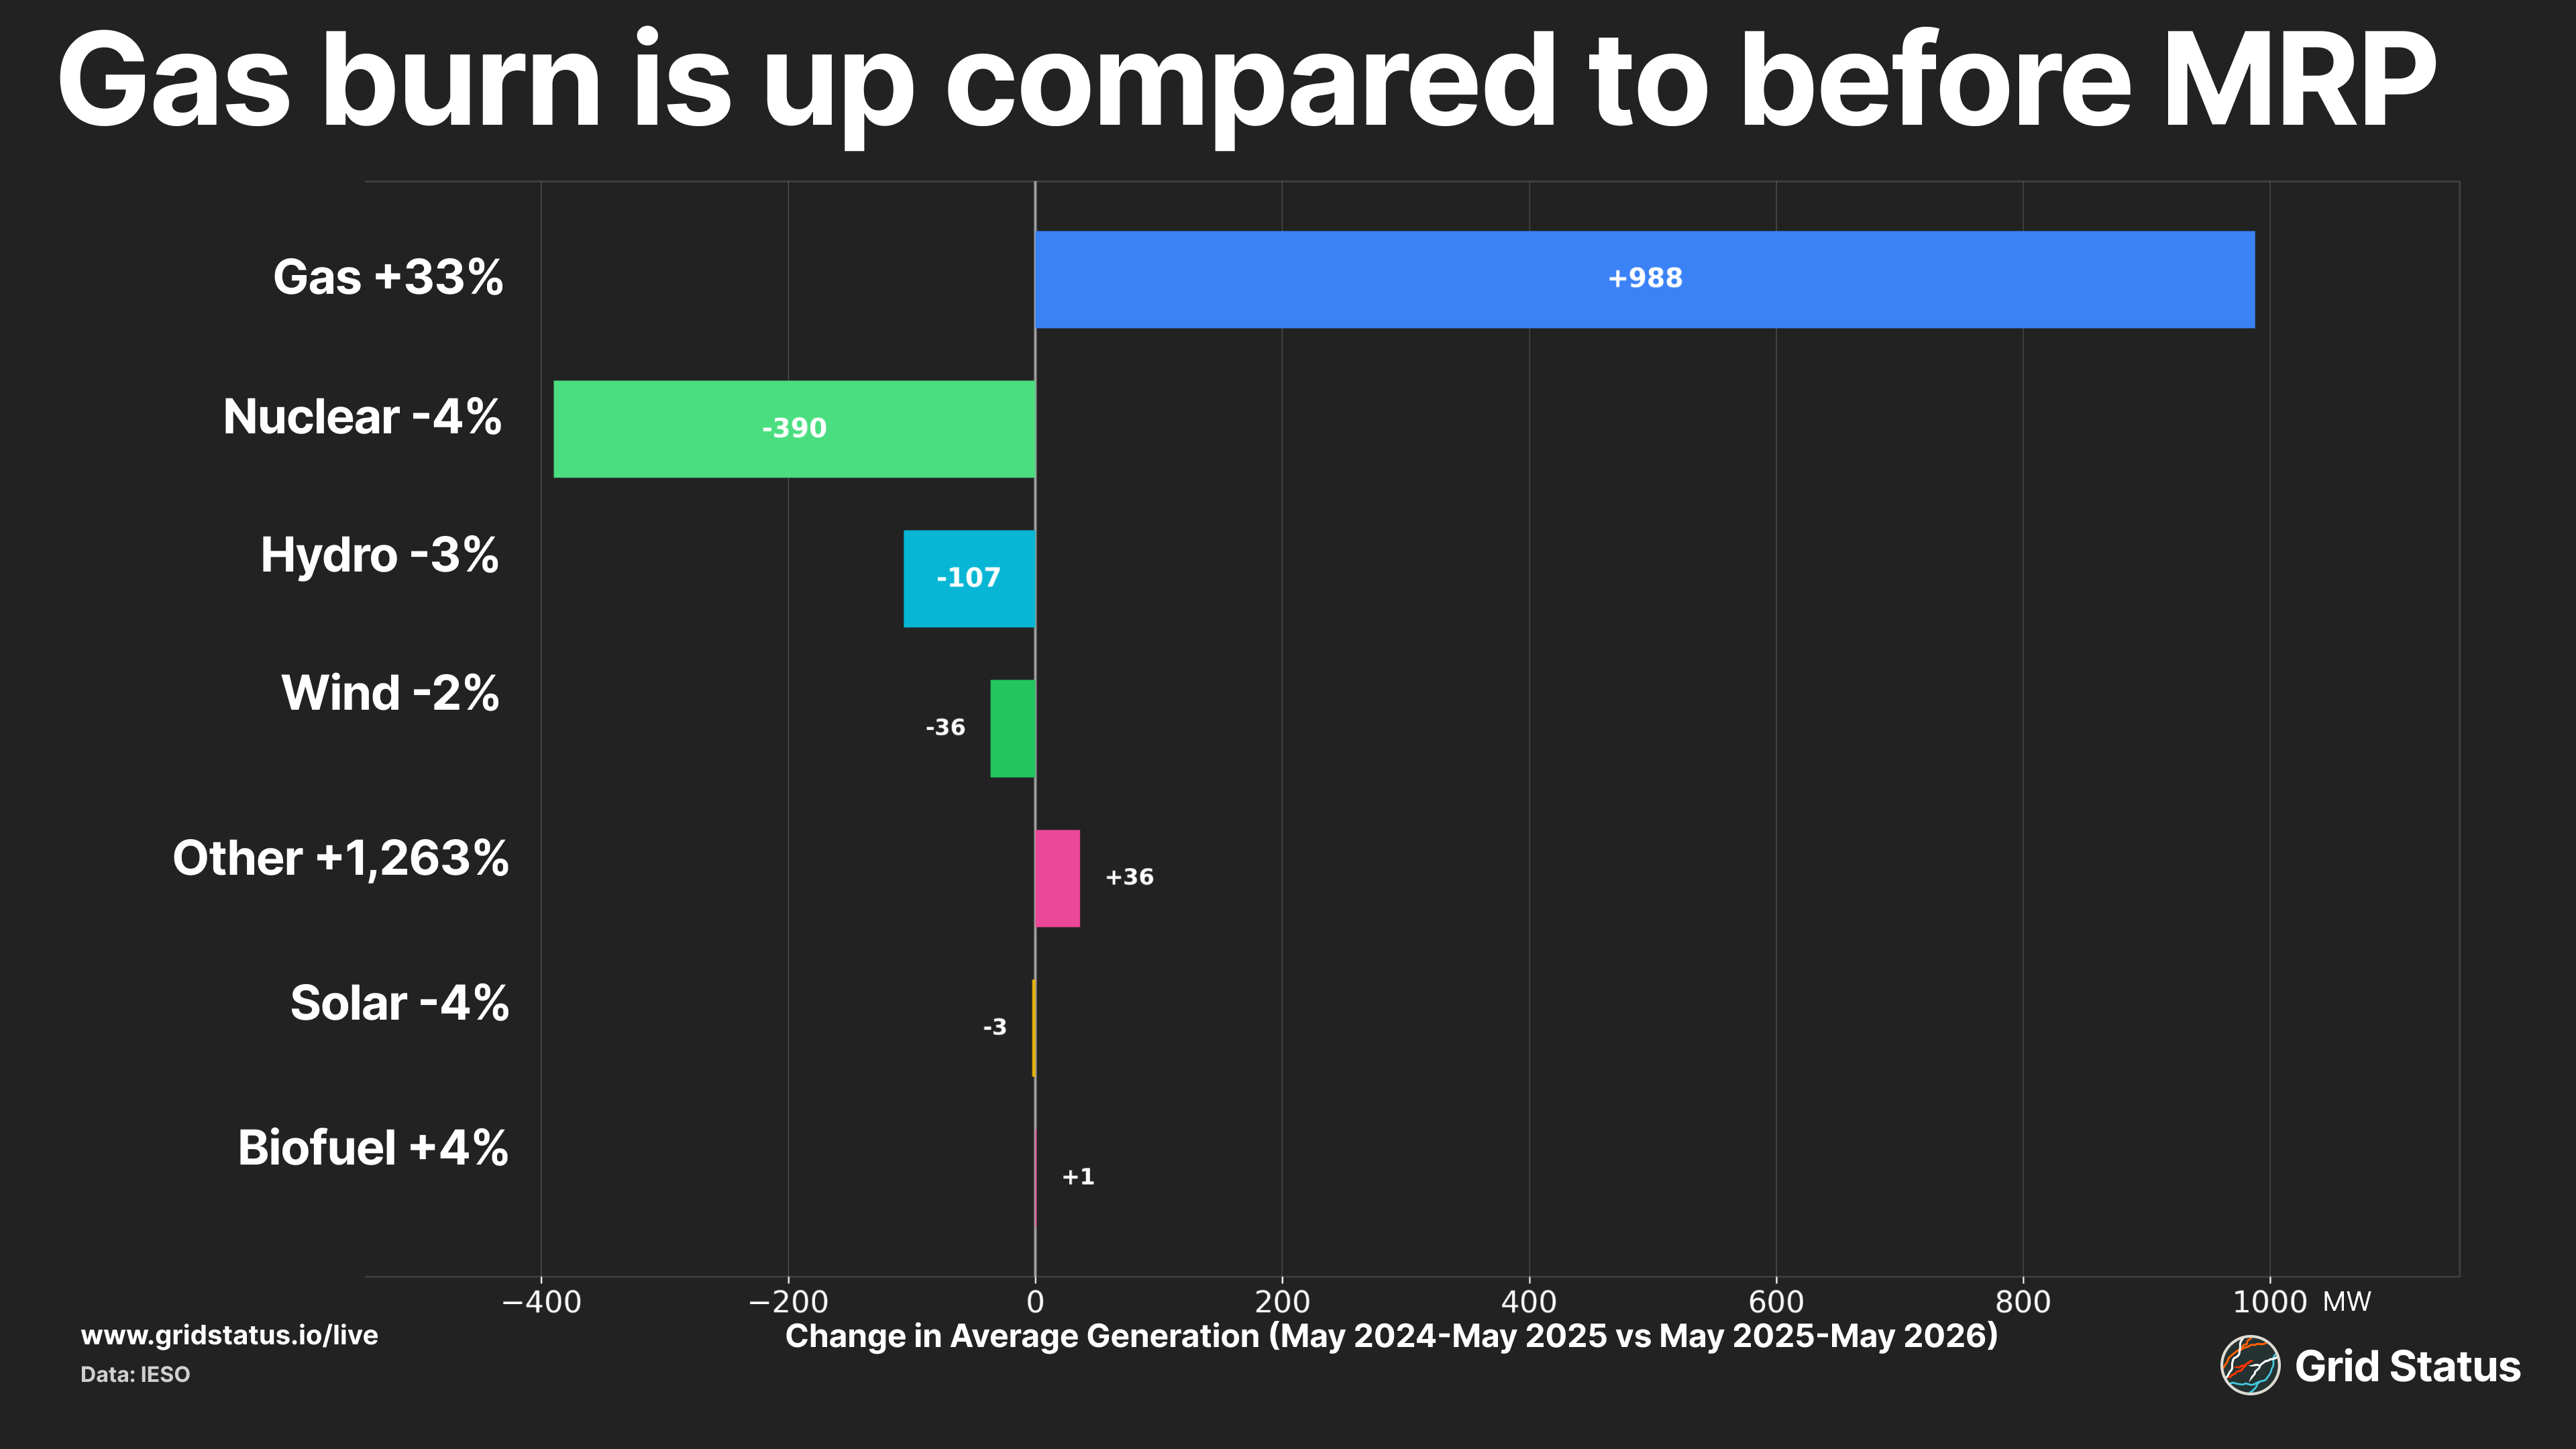
Since MRP's go-live, nuclear and hydro generation have declined year-over-year, due in part to ongoing nuclear outages and drought. Wind and solar are also down, leaving gas to fill the remaining gap in the fuel stack amid export commitments and load growth. This increase in gas burn is largely responsible for the increase in prices since MRP went live. The large increase in gas generation comes at a time of increased spot prices, particularly during an abnormally cold winter.
Apart from the increase in gas, IESO's "other" category has seen a significant rise since MRP go-live. This category captures the province's growing fleet of battery energy storage projects, with new systems coming online and adding to the supply of non-gas flexible generation.
Zoned Out
With the shift to nodal locational marginal prices came the introduction of congestion costs. In nodal power markets, congestion costs send price signals to generators and loads to ensure transmission reliability. Beyond congestion, the MRP also introduced virtual transactions and virtual zones.
Virtual zones represent an aggregated price across a broad geographic area made up of a group of nodes, typically those tied to a physical location in the region. These aggregated zones are often used as settlement points for transactions like power purchase agreements, as well as for financial trading.
The MRP introduced virtual transactions in both the Day-Ahead and Real-Time markets to enable greater liquidity and to narrow divergence between the two.
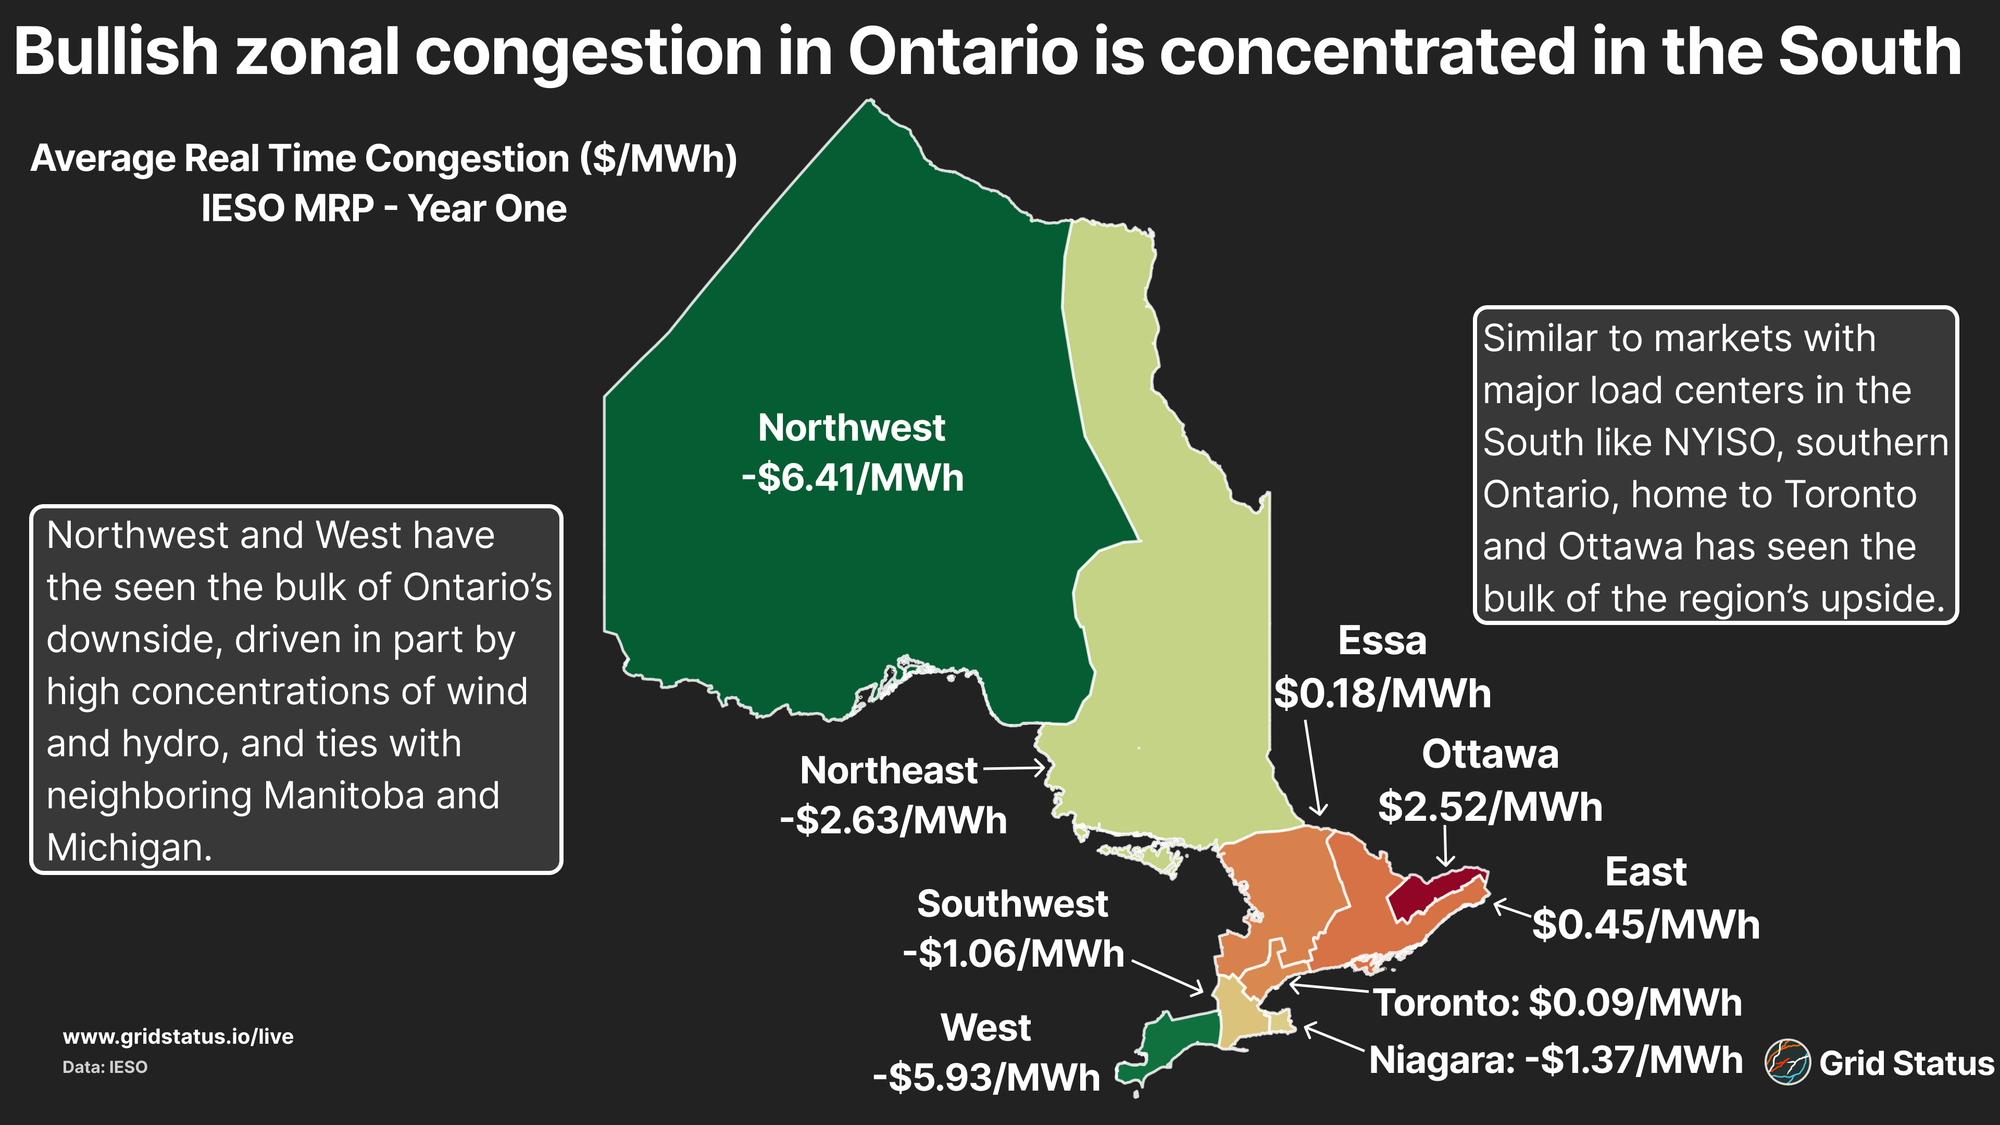
Since market go-live, congestion patterns have emerged that price zones in the southern portion of the market, close to major load centers like Toronto and Ottawa, well above more remote regions like the sparsely populated Northwest.
The concentration of load along Lake Ontario, combined with distant renewable generation and flows to neighboring Quebec, has resulted in disproportionate upside further south. The West has seen heavy downside as well, partially driven by systemic wind-driven congestion in and around Chatham.
Bottlenecks
To better understand drivers behind the basis in capture prices, and particularly how congestion factors into it, we can leverage our node pages and forthcoming congestion app.
Let’s first take a look at PORTALMA-LT.AG_T1, one of the nodes representing the Port Alma wind farm near Chatham, which was the most congested wind farm in Ontario.
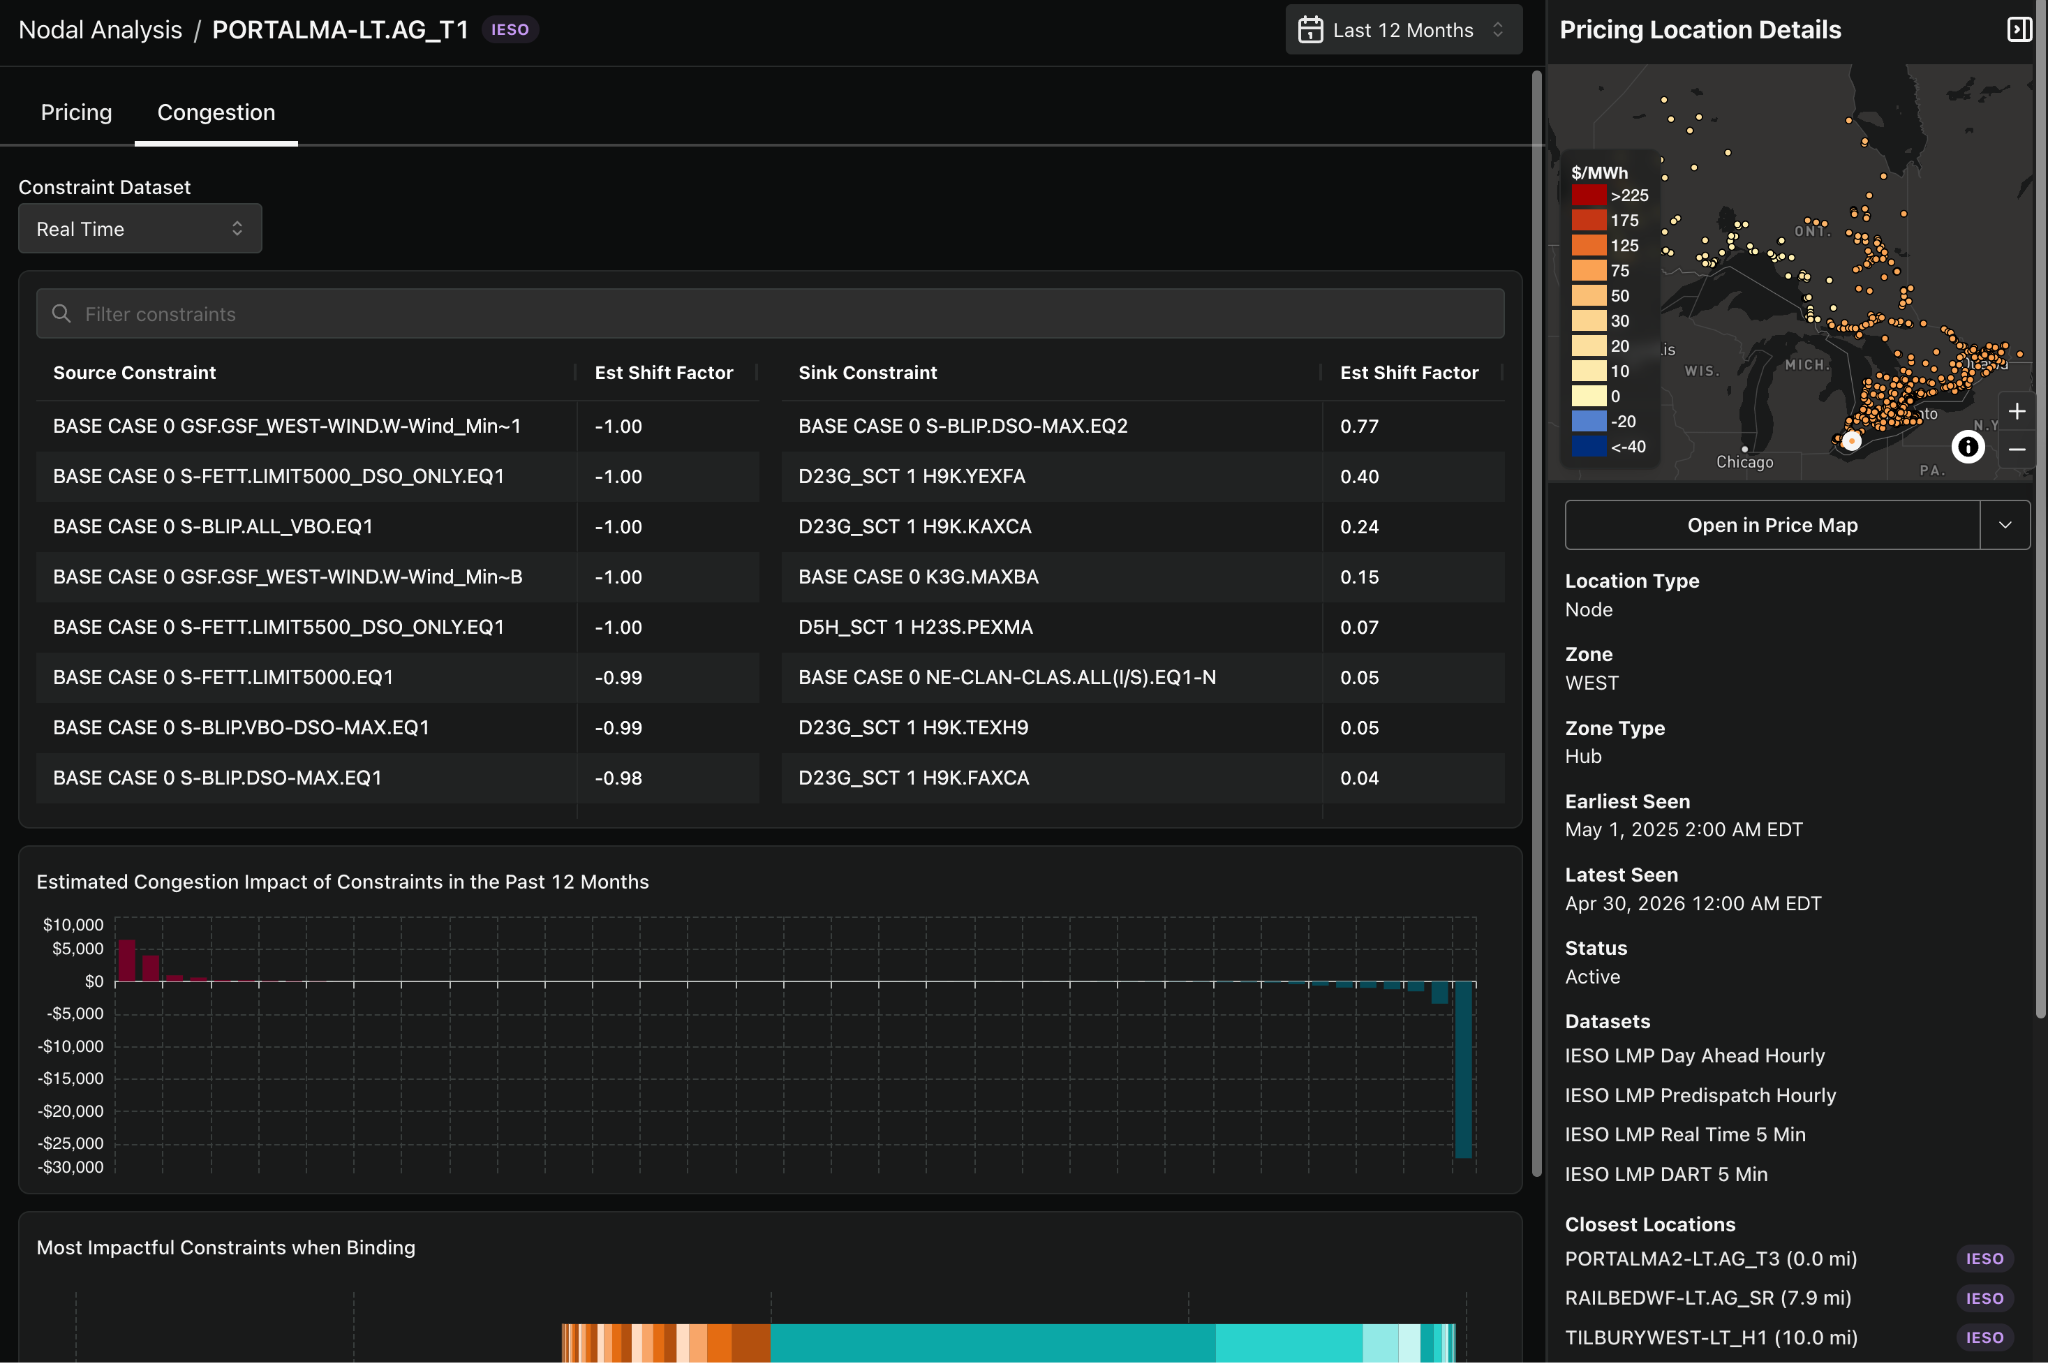
In the past year, Port Alma has been a 100% source for multiple bearish constraints in the West Zone, such as BASE CASE 0 C5E.TEXES.
This constraint, driven in part by strong wind generation near Lake Erie, helps drive the spread between Port Alma and the ONZP. In this interval, Port Alma was a 100% source, meaning it saw -$156.28/MWh in congestion costs, the shadow price at which the constraint bound in that interval. Since the ONZP is load-weighted across the system, it also saw negative congestion costs, but to a lesser degree. The ONZP was a 34% source, meaning it saw -$51.55/MWh in congestion costs, resulting in over $100/MWh of basis between this node and the ONZP.
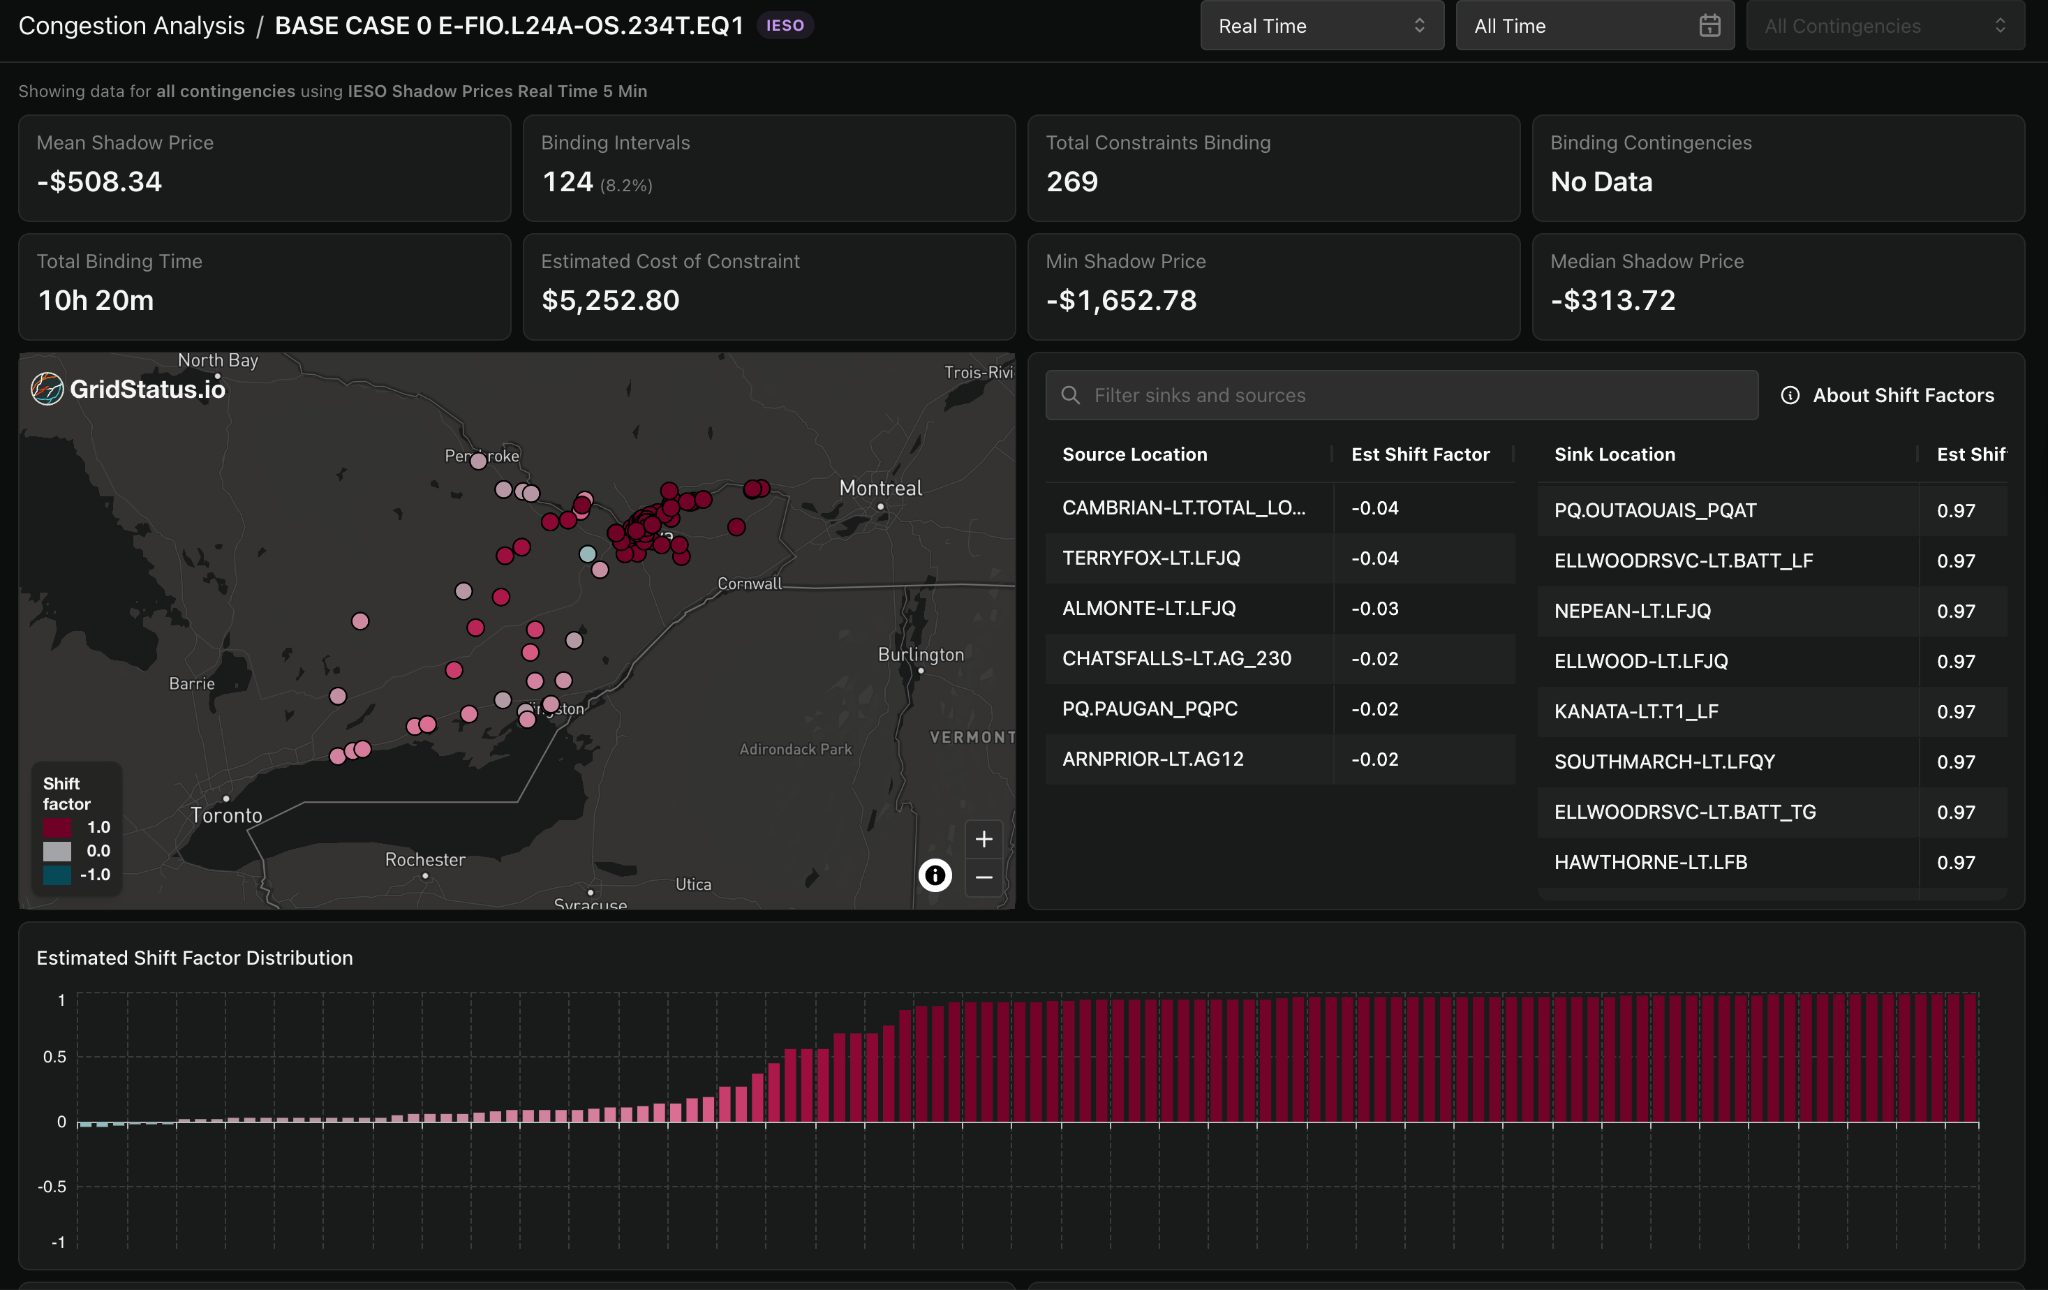
Beyond how congestion has widened the basis between renewable assets and the ONZP, it is also partially responsible for varying spreads across the virtual zones. Ottawa has seen the highest zonal congestion among the eight eligible virtual zones, averaging $2.51/MWh in positive congestion since MRP go-live.
Apart from being Canada's capital, Ottawa is home to IESO's largest tie with Québec: PQ.OUTAOUAIS_PQAT. This tie often sees flows from IESO into Québec reach the line's capacity of over 1,200 MW, which exceeds the average zonal load since MRP go-live. These added exports, combined with existing regional load and limited generation on the sink side, have created disproportionate volatility.
This dynamic is visible in constraints like BASE CASE 0 E-FIO.L24A-OS.234T.EQ1. During the week in November 2025 when this constraint was binding, flows on Outaouais averaged 1,081 MW, even higher than Ottawa's load, which averaged 977 MW.
In This Moment Now, Capture It, Remember It
Unlike its American counterparts, IESO provides unit-level generation data in near real time via its generator report hourly. Leveraging this data, we can examine renewable performance and, more specifically, renewable capture prices.
By their nature, variable renewable resources, wind and solar in particular, can only produce when conditions allow, not allowing them to ramp up for higher pricing. To measure an asset’s financial performance, we use a metric known as capture pricing, which weights the unit’s nodal LMP by production when it was able to generate power.
Wind generation currently plays a much larger role in IESO operations than solar, with a record output of 4.6 GW set well before the nodal market, more than 10x the solar record. Since MRP go-live, wind capture prices have tracked well below the ONZP, averaging $56.07/MWh against the $68.35/MWh ONZP average.
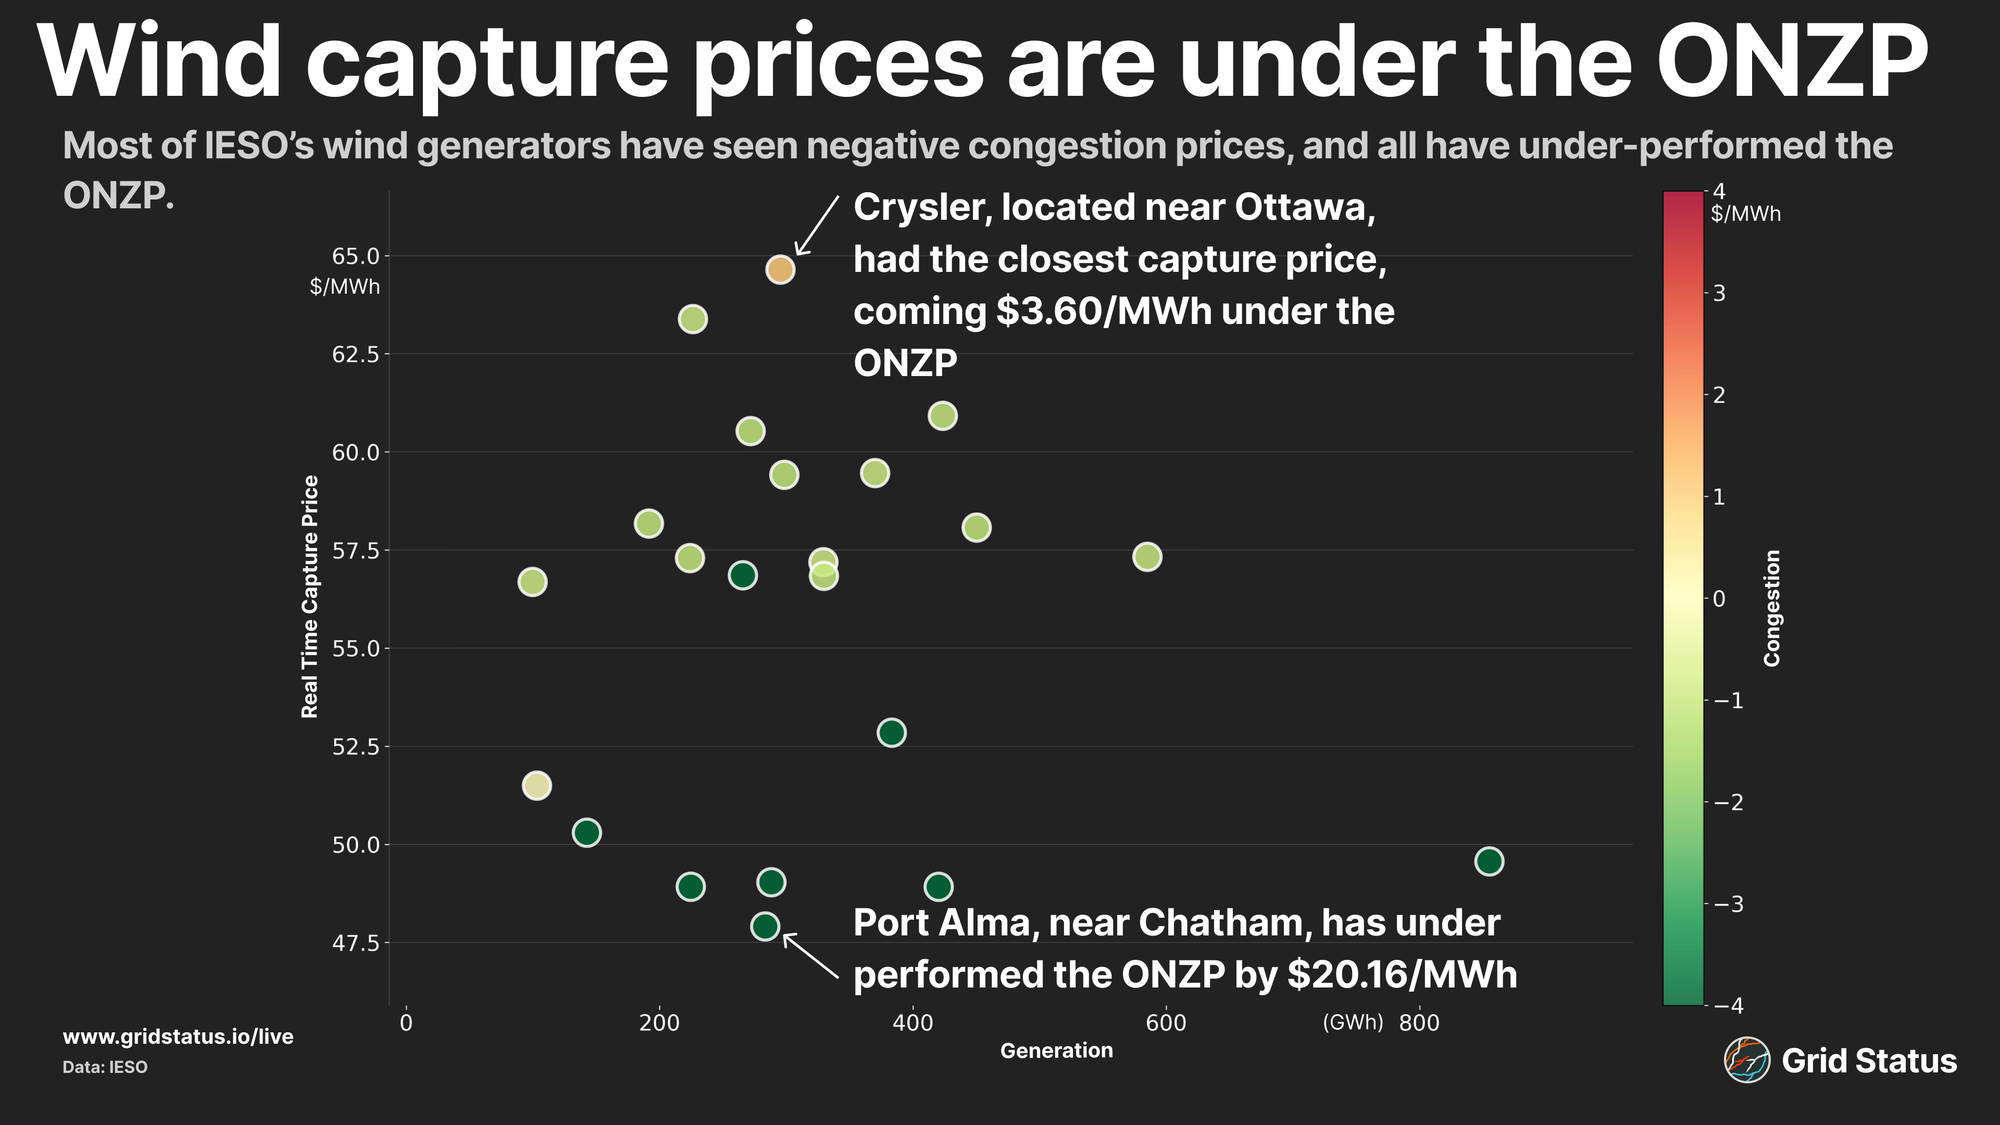
While solar plays a much smaller role in the fuel mix, its capture price has tracked closer to the ONZP, though still below it. The average solar capture price has come in at $58.87/MWh, nearly $3/MWh above wind.
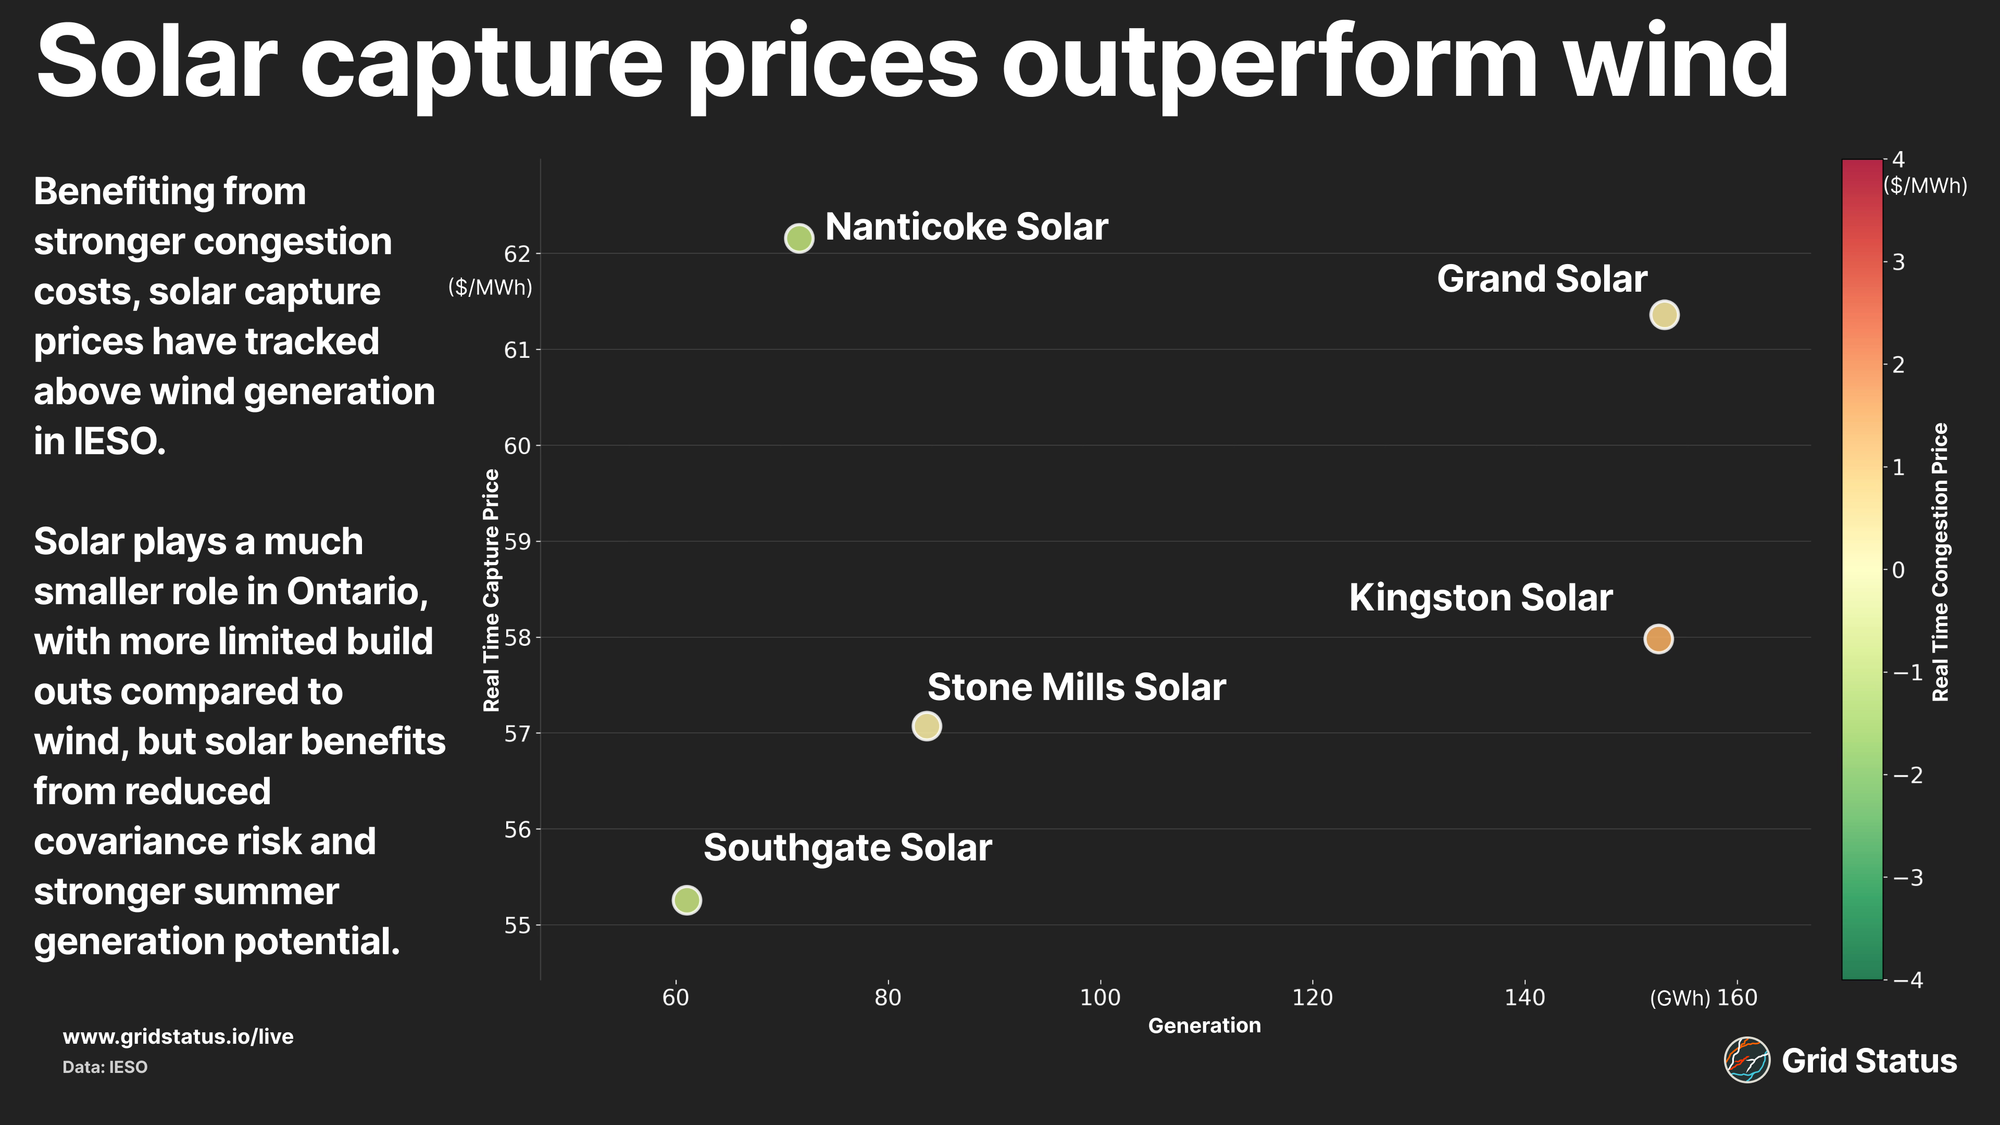
Solar capture prices came in above wind for much of the year, particularly during the summer, as solar generators benefit from reduced bearish congestion relative to the ONZP and higher average capacity factors during those months.
Shipping Up to (Montreal)
In part due to its diverse, low-carbon fuel mix, IESO has long been a net exporter to neighboring regions. Bordered to the west by Manitoba and to the east by Québec, and connected to Michigan, Minnesota, and New York, the province has leveraged its interties to manage inflexible excess generation as reflected in the existence of the Surplus Baseload Generation report, and has historically pulled from neighboring regions during periods of high summer demand, particularly from the winter-peaking Québec.
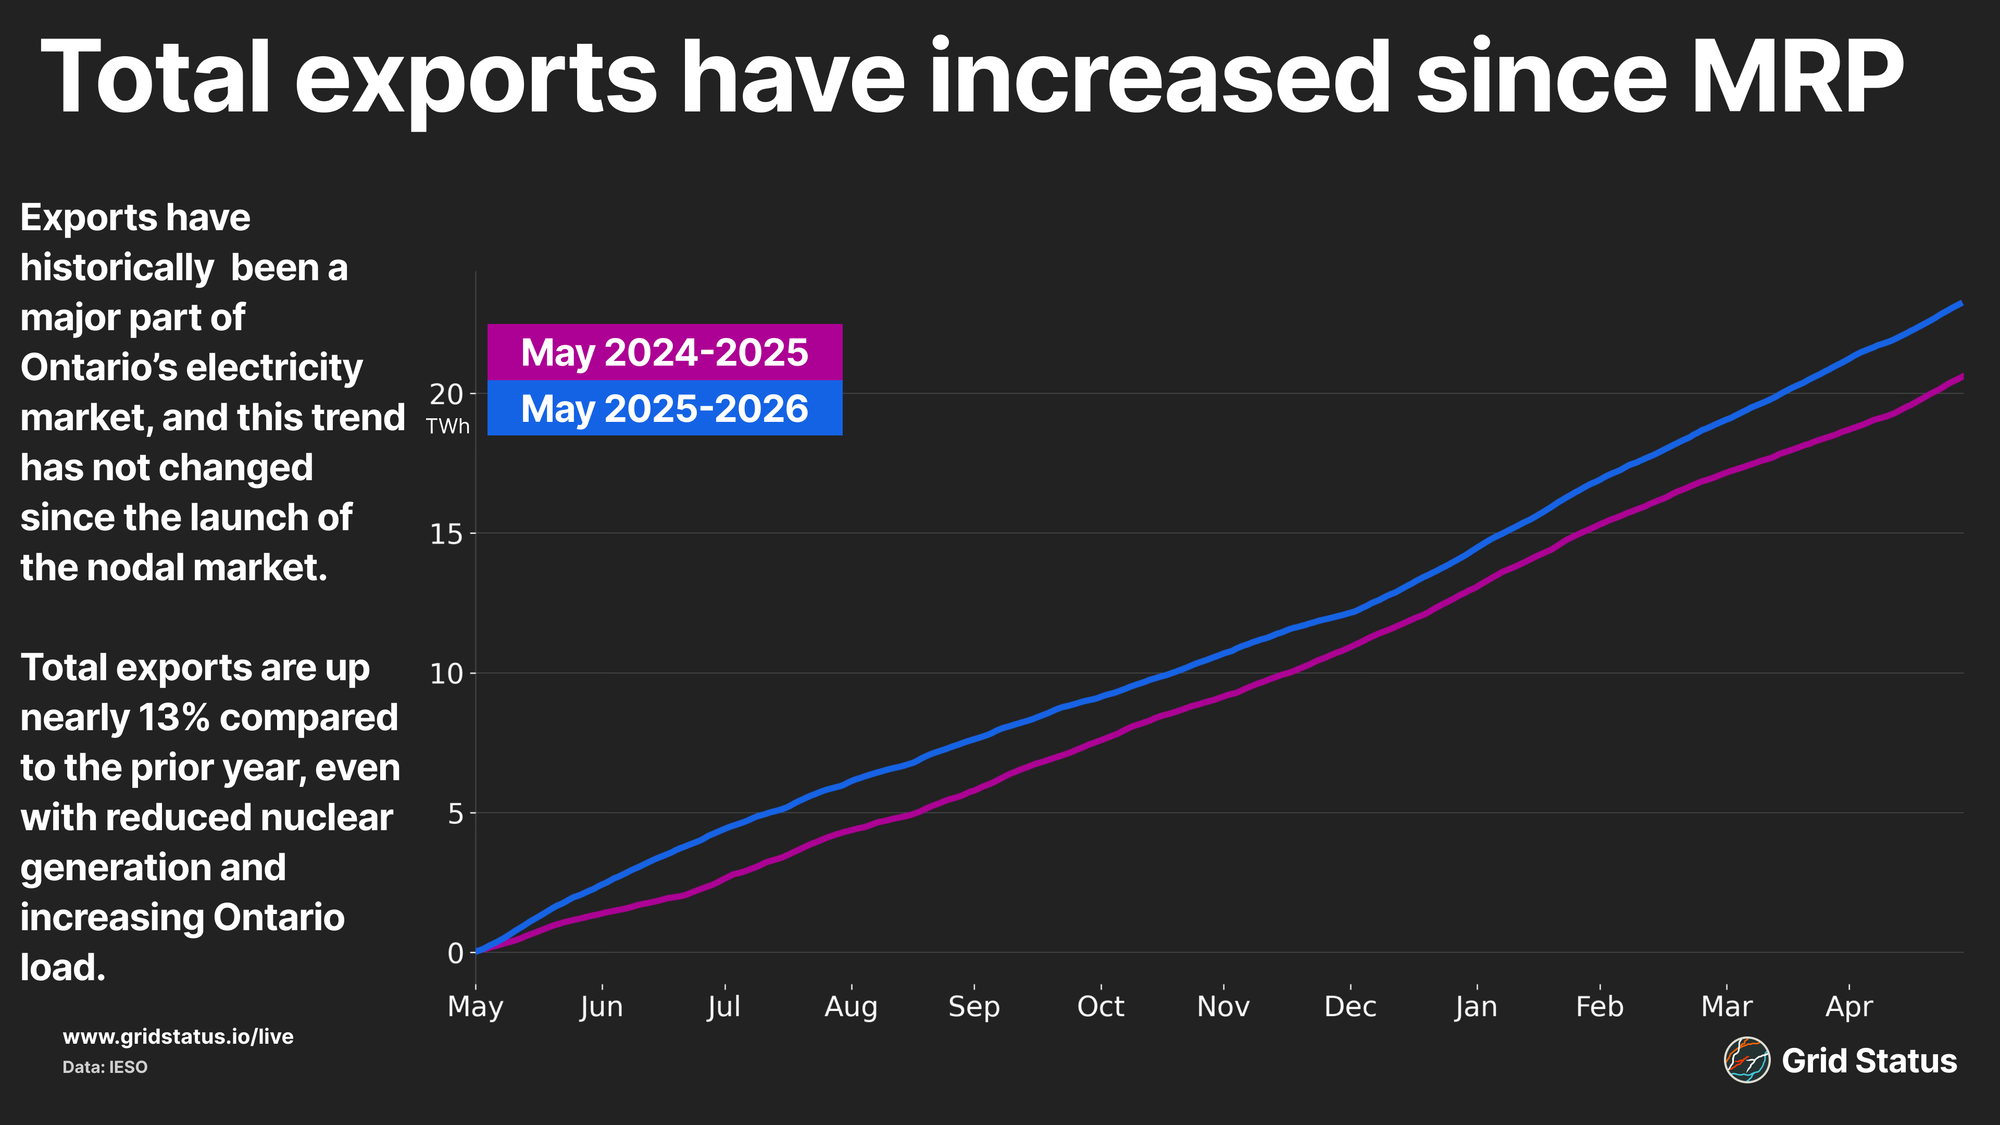
Since MRP go-live, this trend has not reversed: IESO has remained an exporter, and total exports have increased by nearly 13% year-over-year. While the overarching trend has held, Ontario's major export partners have shifted. The biggest total change has been a substantial increase in flows to Québec, with total exports up 34%. Manitoba also saw a large increase in flows, though the corridor is considerably weaker in scale, averaging just 28 MW compared to the 1,136 MW average between IESO and Québec.
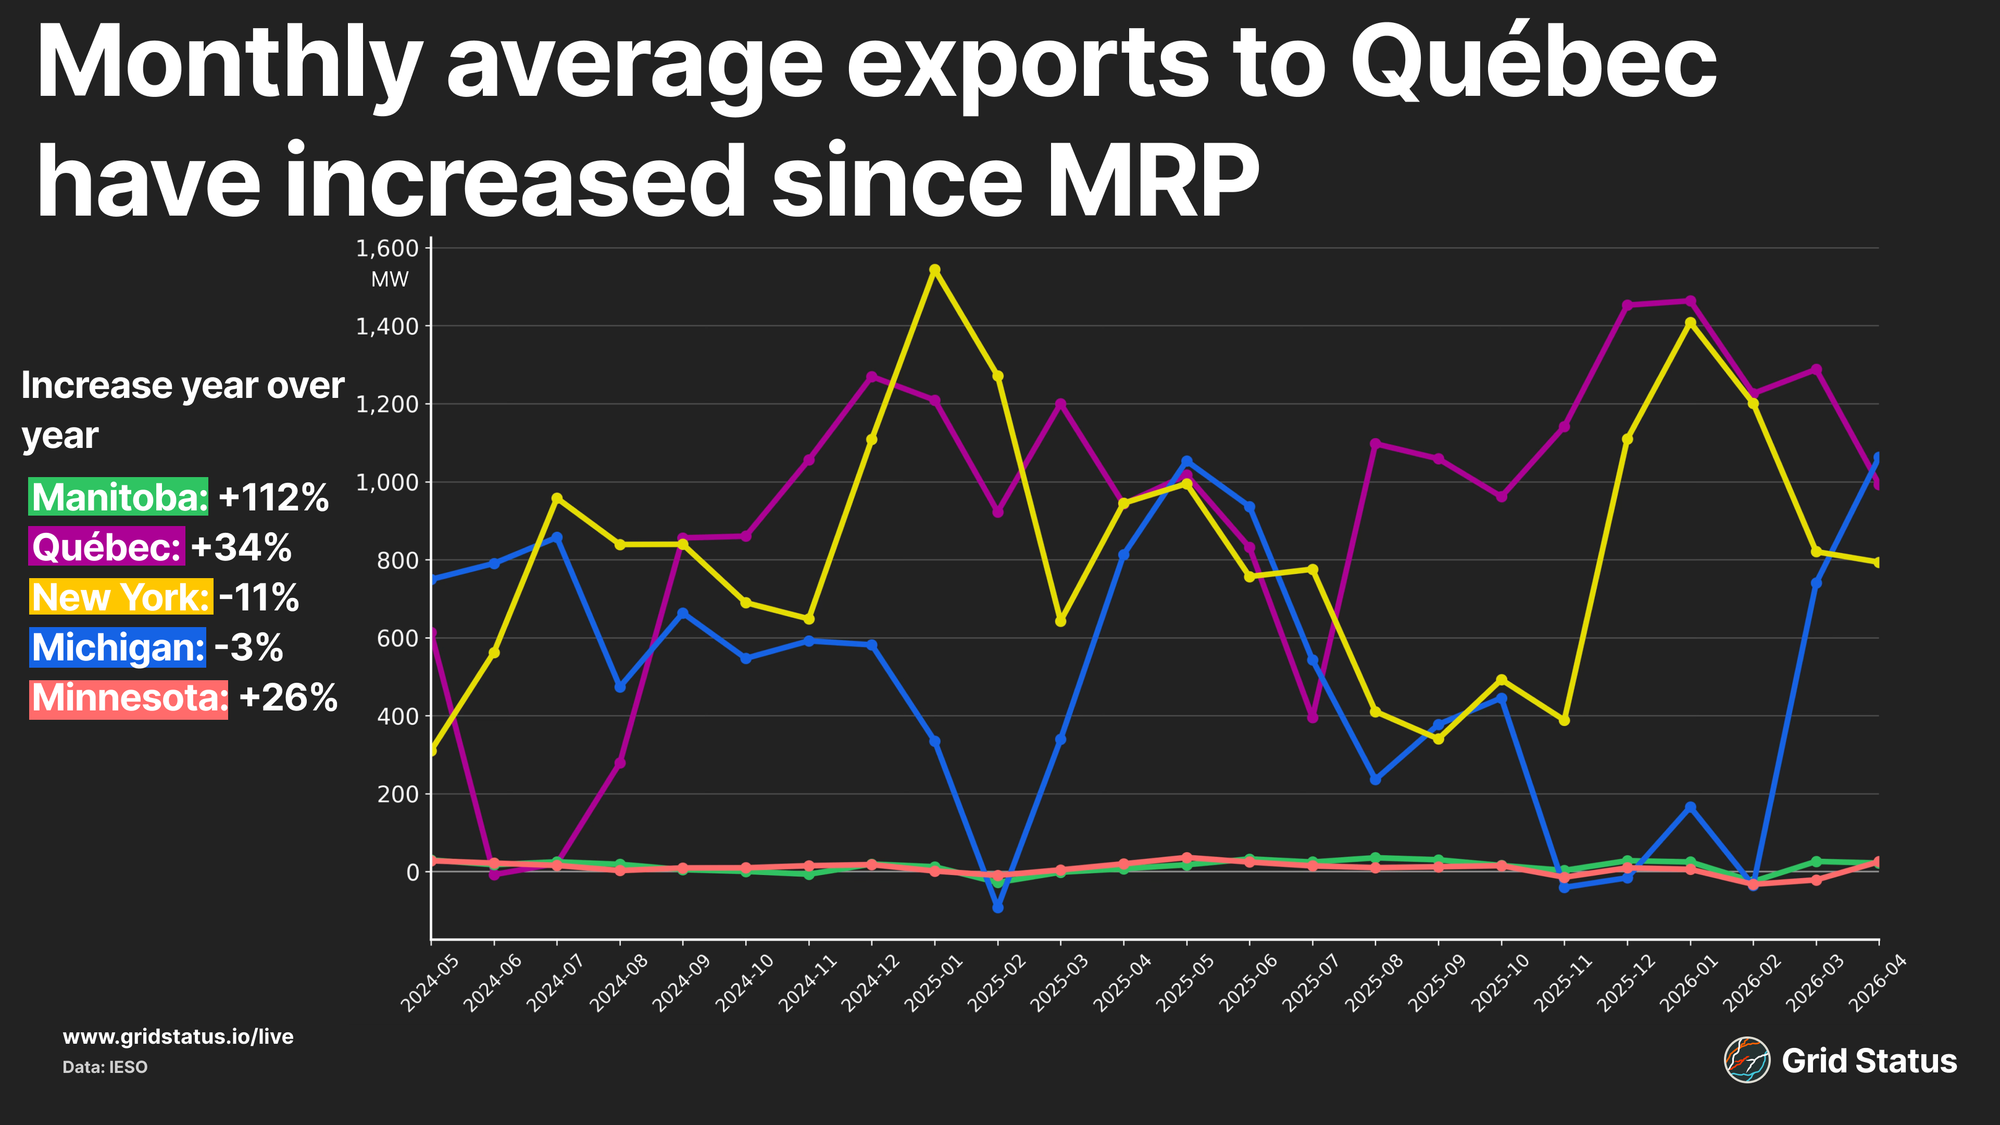
The increase in exports to Québec continues a trend we have noted in multiple blogs, including our MRP primer, as sustained drought and expanded ties between HQ and the Northeast have put pressure on Québec's nearly exclusively hydroelectric fleet.
While ties with neighboring provinces have increased year-over-year, exports between IESO and its American counterparts, MISO and NYISO, have dropped since MRP go-live. NYISO is IESO's largest American counterpart and has seen flows fall 11% since go-live, even as NYISO has taken on an increasingly important role in managing flows between ISO-NE and HQ. Minnesota flows have seen the largest percentage increase, though this tie is the smallest of all US connections, averaging just 19 MW this year.
Grid, so demanding
Load data is a foundational dataset across markets, but given the disproportionate level of exports in Ontario, it is increasingly important to distinguish between internal load and the total generation needed to meet market demand.
Given this distinction, IESO produces two load columns in the same dataset: Ontario Load and Market Load. As the name suggests, Ontario Load measures total demand across the province, more subject to swings in conditions such as temperature and cloud cover.
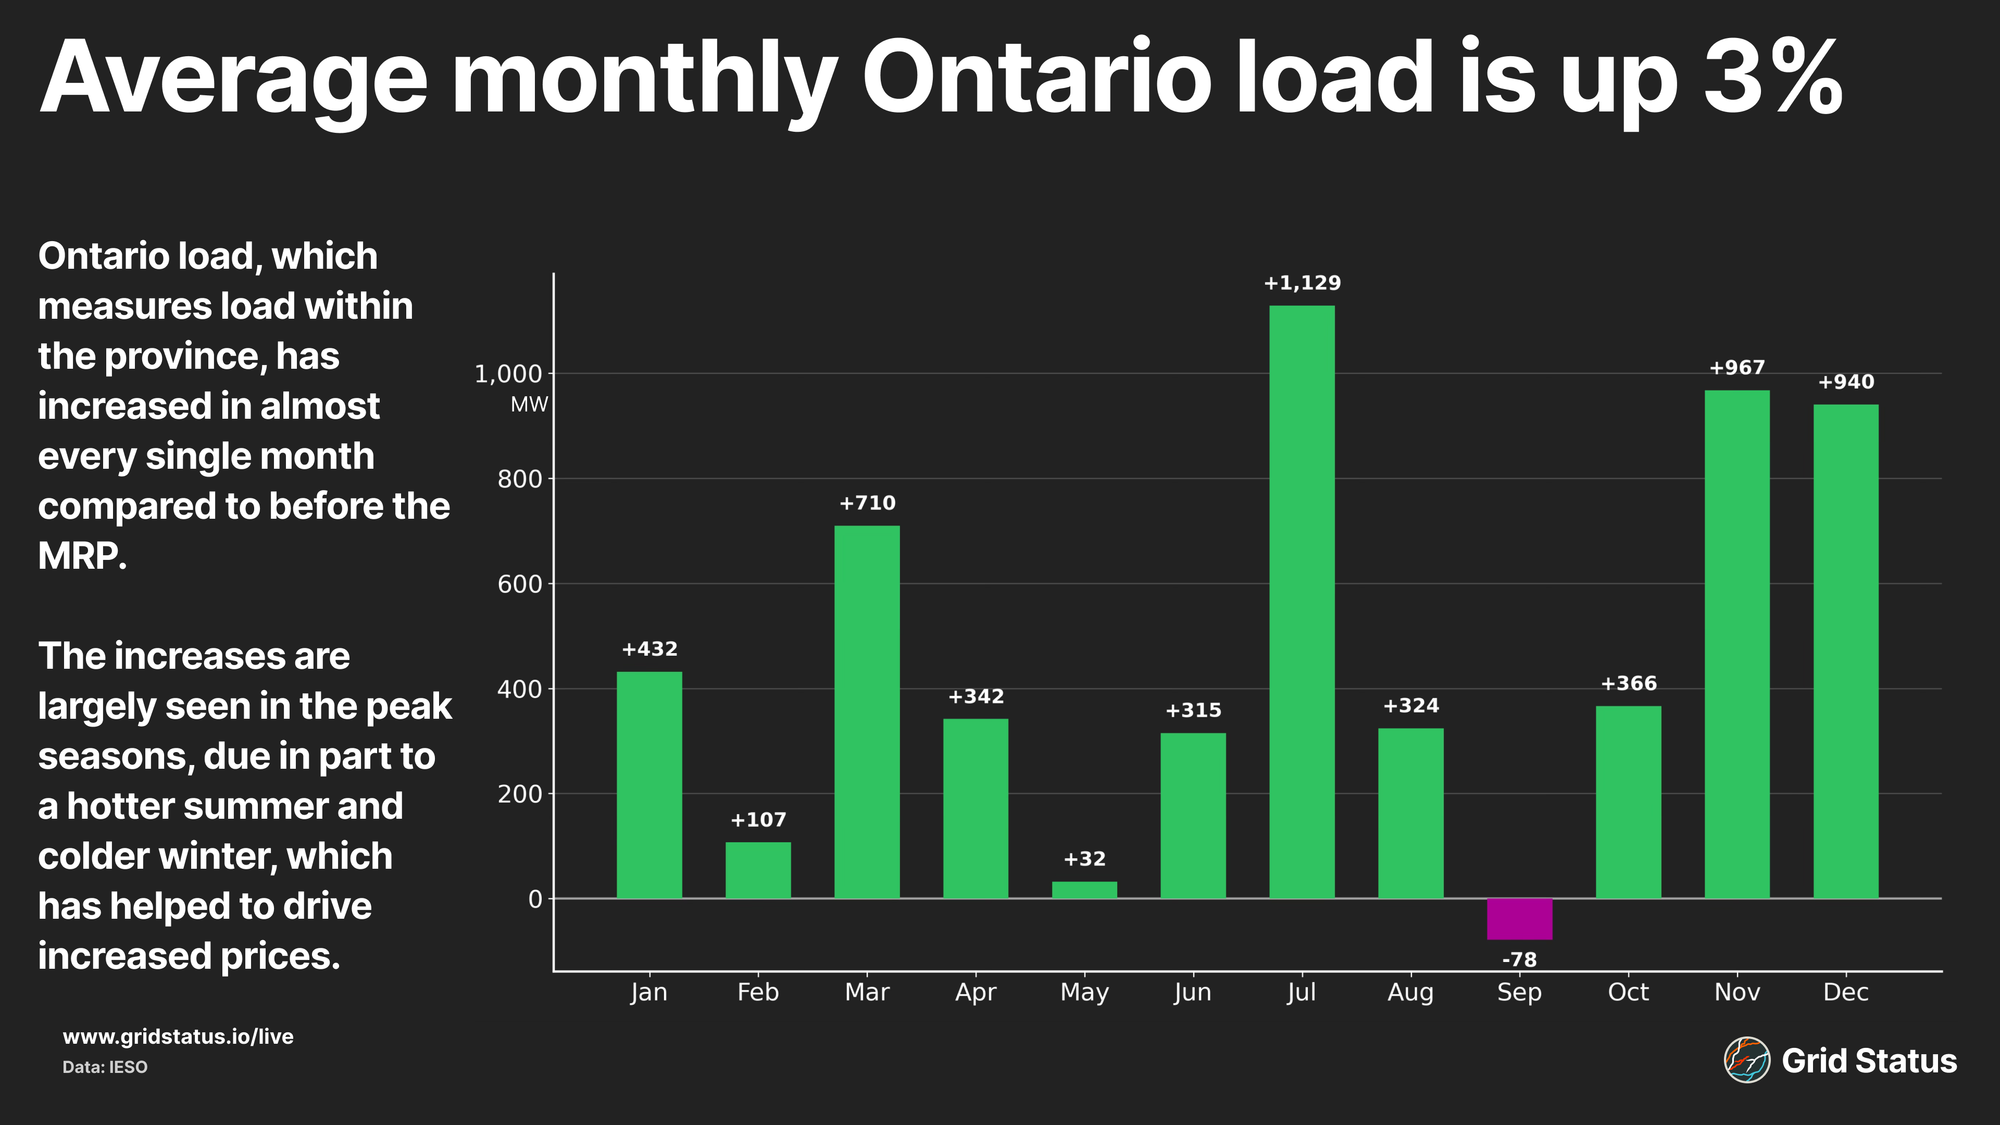
Since the MRP go-live, average monthly Ontario load has increased by around 3% compared to the year prior.
While the province is seeing an increase in demand driven by new large loads, referred to by IESO as large step loads, as well as increases in electrification, the primary contributor to the increase in demand is environmental, driven by extreme heat in the summer and cold in the winter.
Market Load tracks total system demand, incorporating Ontario Load plus exports, and reflects the total energy supplied across IESO.
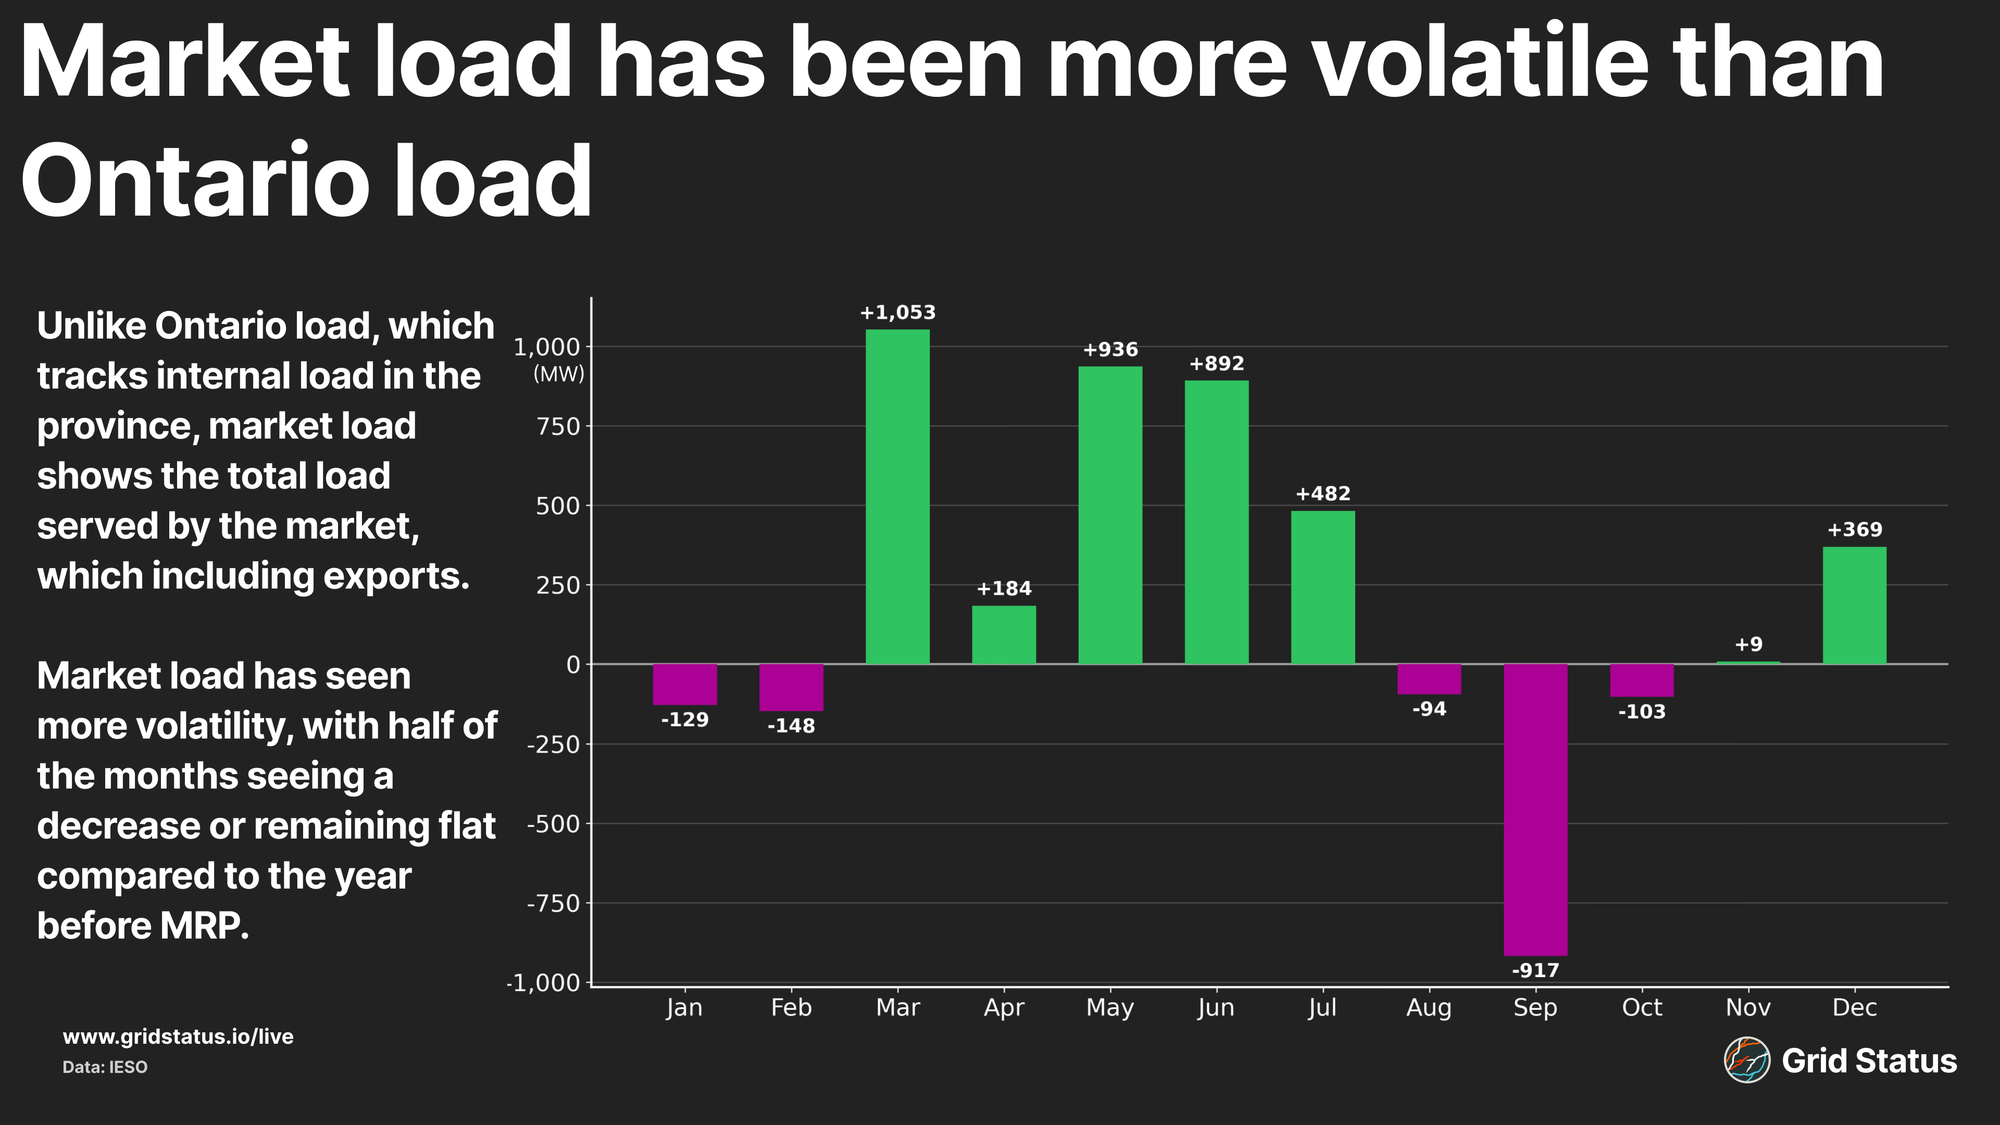
As would be expected by the increase in Ontario load, market load is up year over year, though to a lesser extent.
Market load has been more volatile than Ontario Load, dropping slightly in winter and late summer, compared to the year before MRP, while rising through much of the middle of the year. These swings reflect both increased internal demand and shifts in external flows, as export partners like Québec have drawn more heavily on Ontario year over year.
Not Weird, Just Quirky
Like any market, IESO has its quirks. Since the MRP launch and the increased visibility of market outcomes, it has become clear that the province's volatile load patterns drive pricing swings.
To assess load volatility, I normalized 5-minute load interval swings across markets to account for differences in market size. Taking the standard deviation of load changes within each interval and dividing by the mean load yields a coefficient of variation of 0.4%, higher than any other North American market.
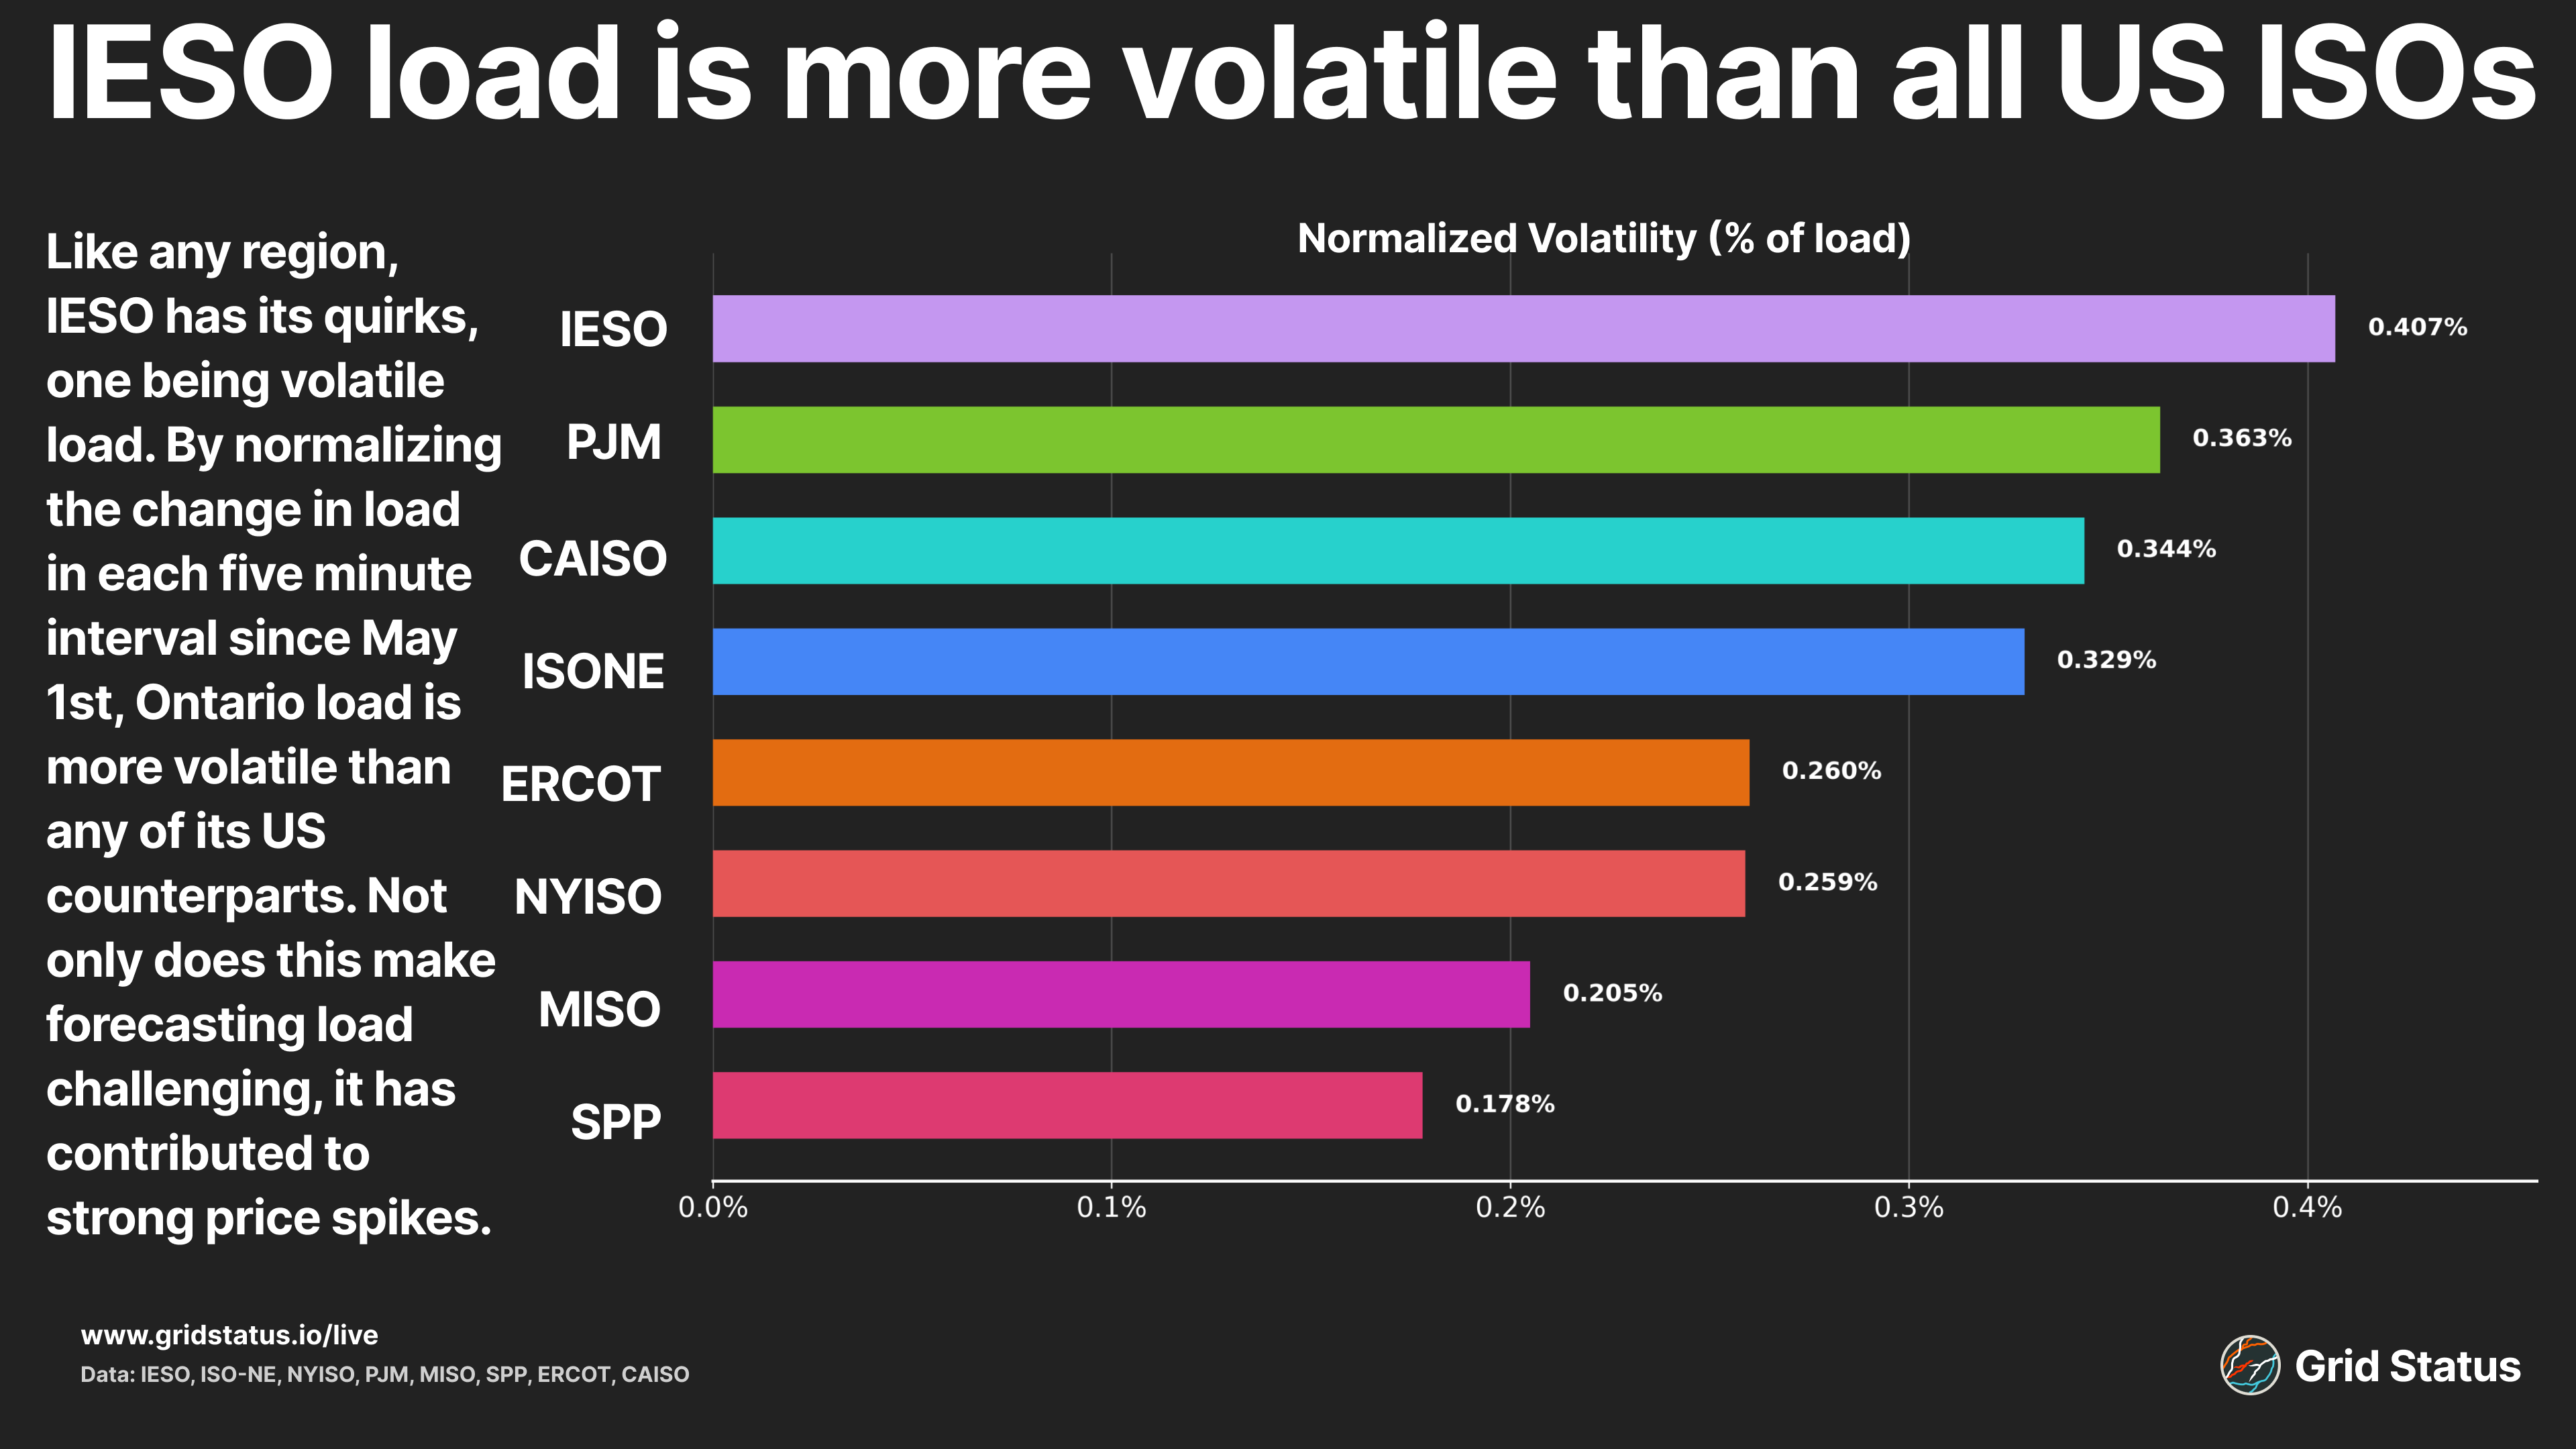
When looking at the average shift as a percentage of load, IESO is slightly behind CAISO, with Ontario Load shifting 0.43% compared to CAISO's 0.45%. This metric is somewhat skewed by the concentration of behind-the-meter solar in CAISO. The impact of BTM solar becomes even clearer when ISO-NE, which sees an average shift of 0.41%, is included in the comparison.
While BTM solar is present in Ontario, it has nowhere near the market penetration of CAISO or ISO-NE, indicating that factors beyond solar generation dropping off drive the swings, potentially including active loads in the market.
In addition to its swings in load, the components of IESO’s newly minted LMPs have seen strong swings, particularly when nodes are at the market's price floor of -$100/MWh.
During the first week of nodal pricing, Des Joachims, a hydro-electric generator on the border of Ontario and Québec, saw its LMP drop to -$100/MWh due to nearby congestion. While the price itself is not uncommon, as numerous nodes have seen pricing hit the market floor, the component costs of the LMP were notable.
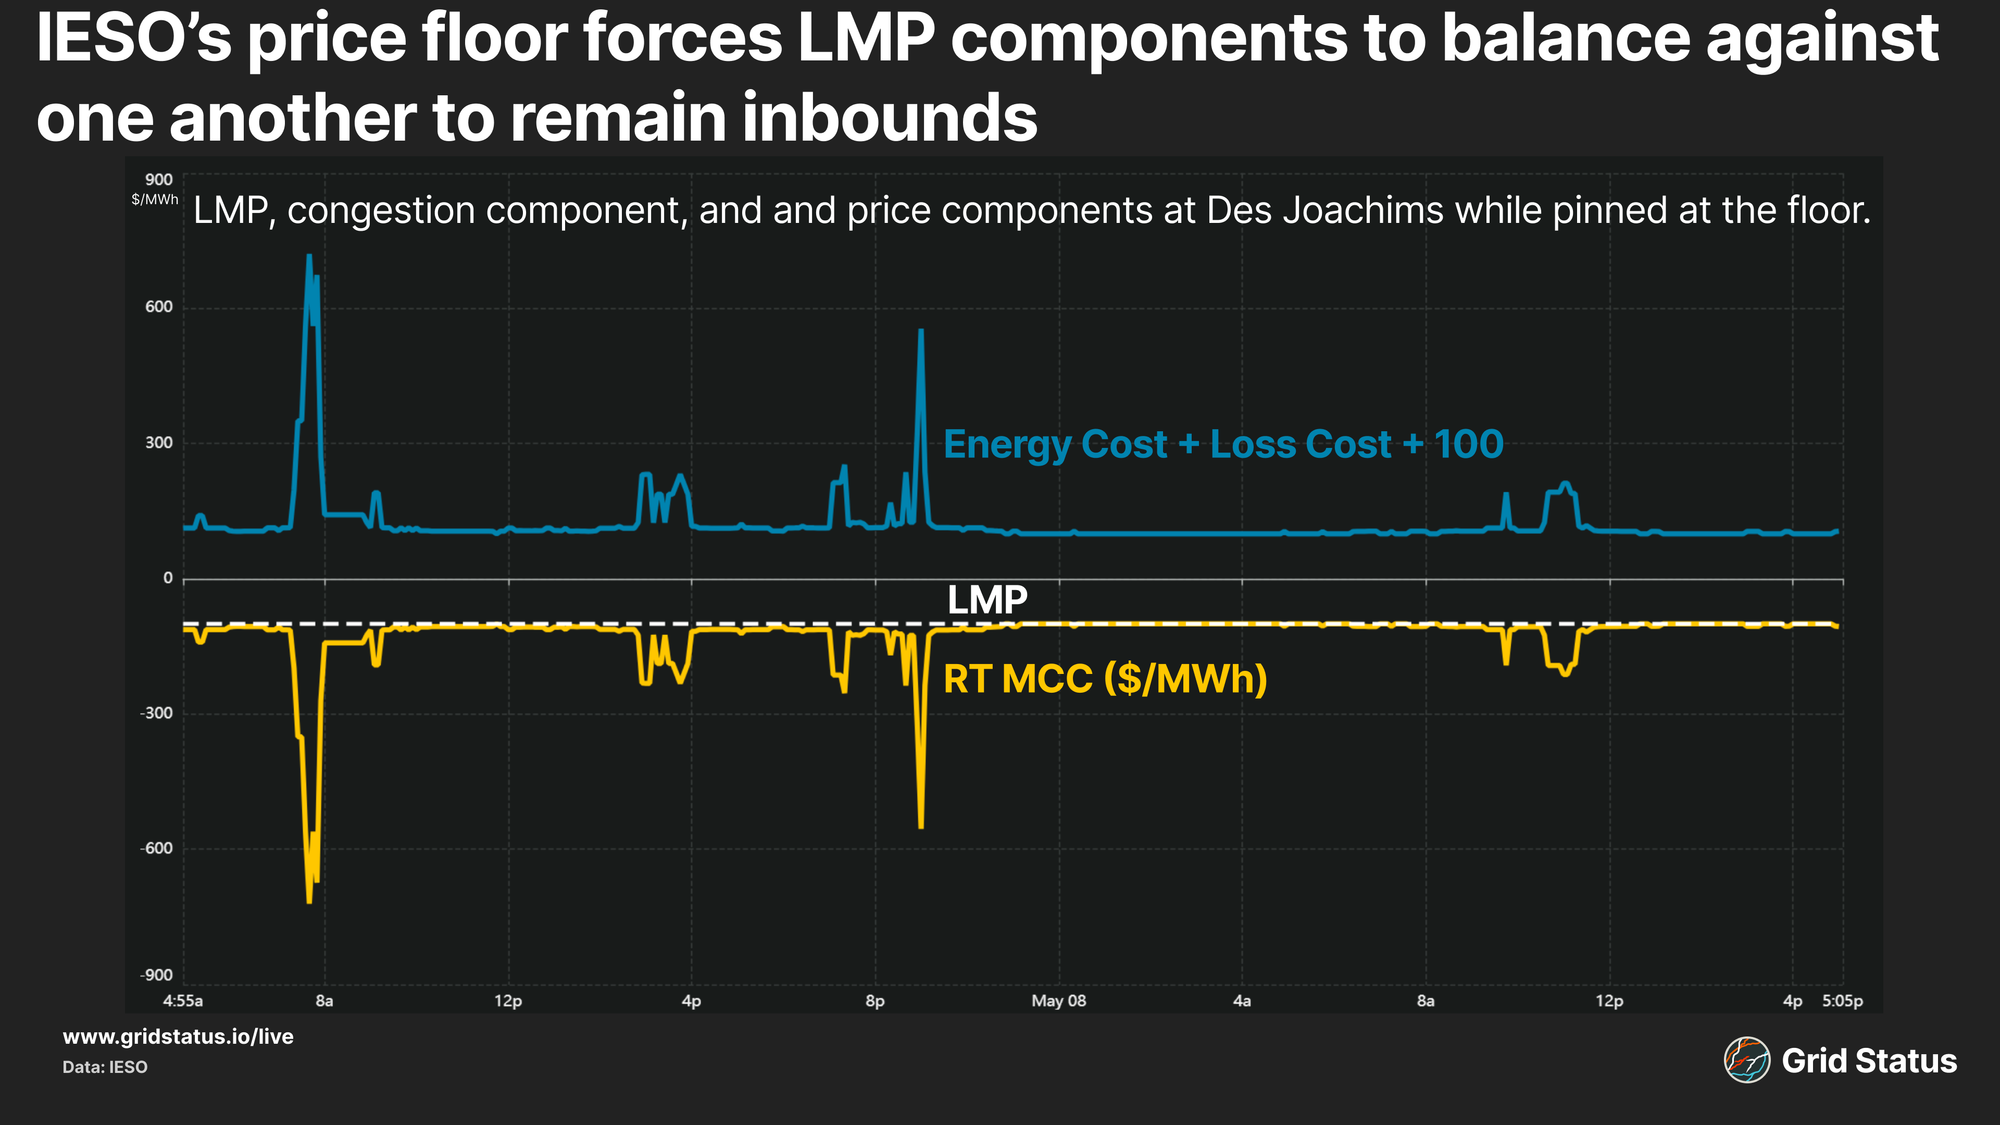
For the entire timeframe in which the constraint was active, the congestion cost component of Des Joachims LMP tracked the node’s loss cost + system energy costs + $100.
The congestion cost component of an LMP should reflect the value of a particular location in solving the system’s current set of constraints. At the edges, IESO’s published prices are different. Their price floor appears to force components of the LMP to balance against each other in order to remain within the administrative price boundary.
At a Loss
Demand is not the only unusual aspect of IESO's renewed market. Loss costs have been notably high.
Often overlooked when analyzing LMPs due to their limited volatility, marginal losses reflect the costs of transmitting electricity. As power flows across long distances, some is lost to resistance in the physical lines. Like congestion, loss costs can be positive or negative, with negative prices indicating that injecting a MW will increase overall losses, and positive prices showing that it reduces system losses.
Since loss costs were introduced in Ontario, they have largely tracked congestion trends, with locations further from Southern Ontario seeing negative losses.
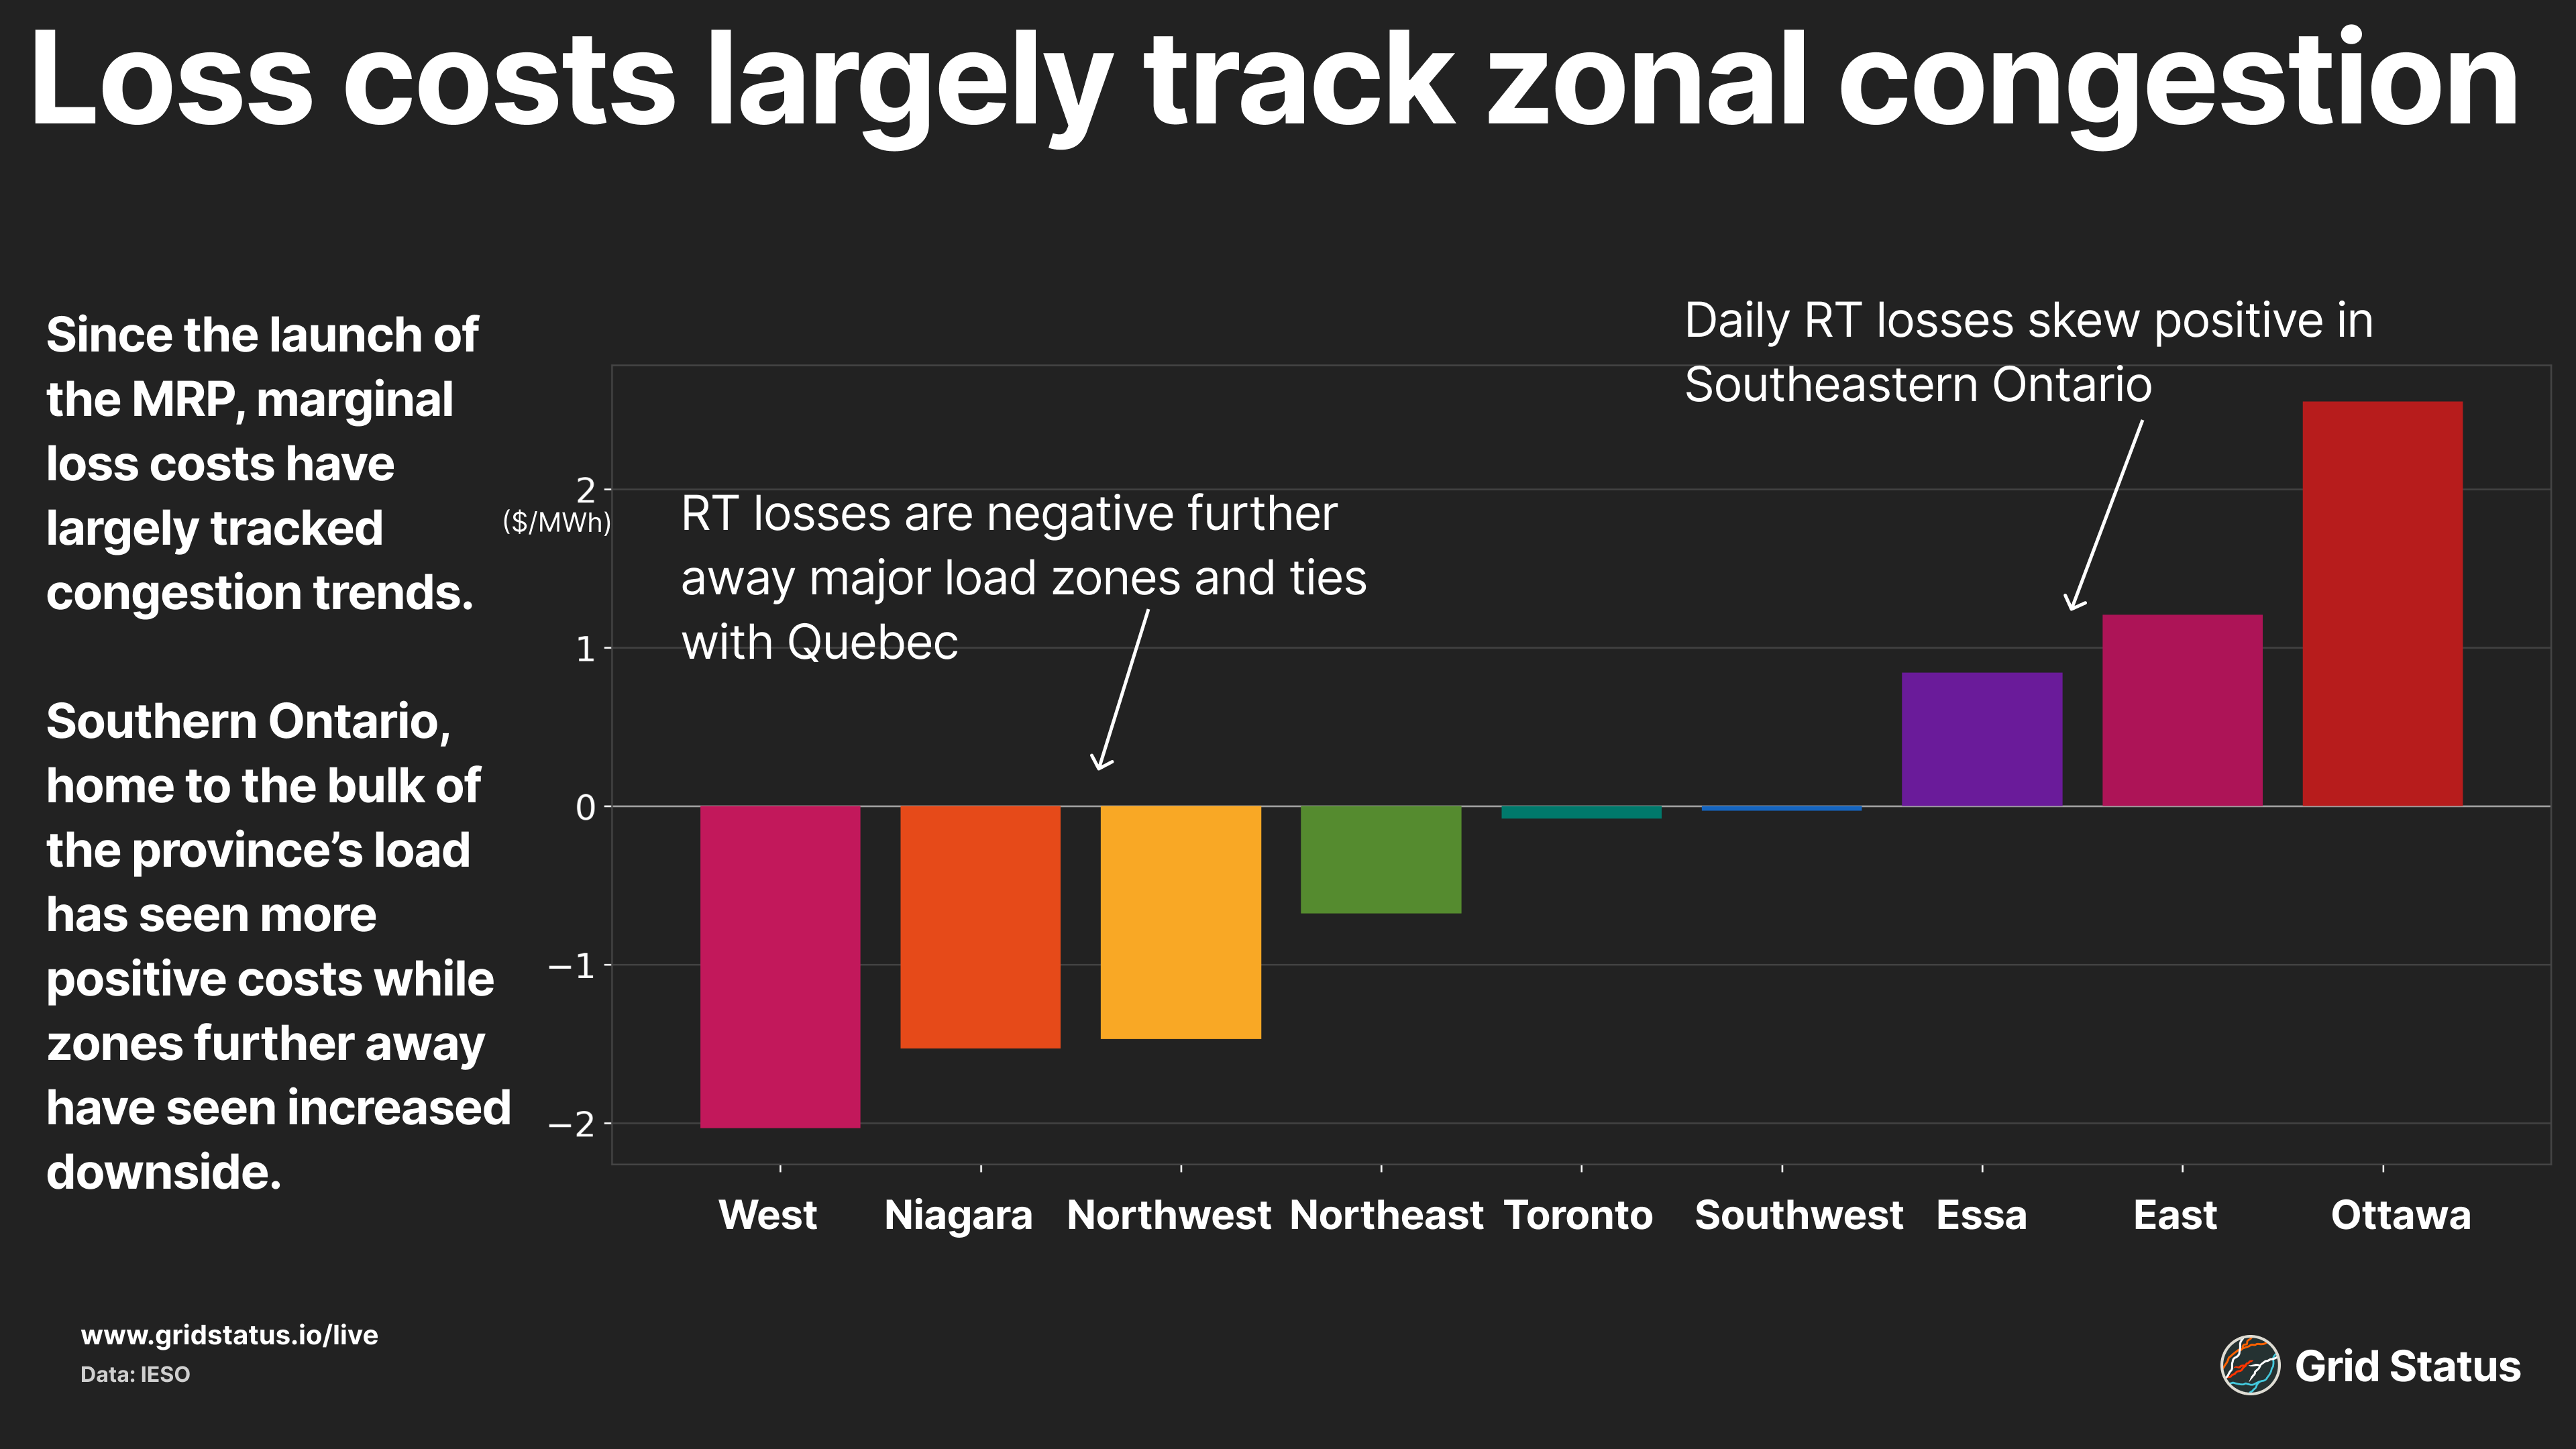
West and Niagara, along with the remote Northwest and Northeast, have seen the most negative loss costs, due in part to distance and likely also to ties with neighboring US regions, Michigan and New York. On the other hand, Ottawa, East, and Essa have seen the most positive loss costs.
While these outcomes are not surprising, quirks related to loss costs have emerged. Loss costs in IESO have seen wide ranges since MRP, and in some cases, wider than other North American markets. We examined loss costs during June 2025, when much of the Eastern Interconnect saw its peak summer load during a late June heatwave. You can learn more in our blog post documenting IESO's performance during that event. Average real-time losses during the event were negative, and the range across the province was notably wide.
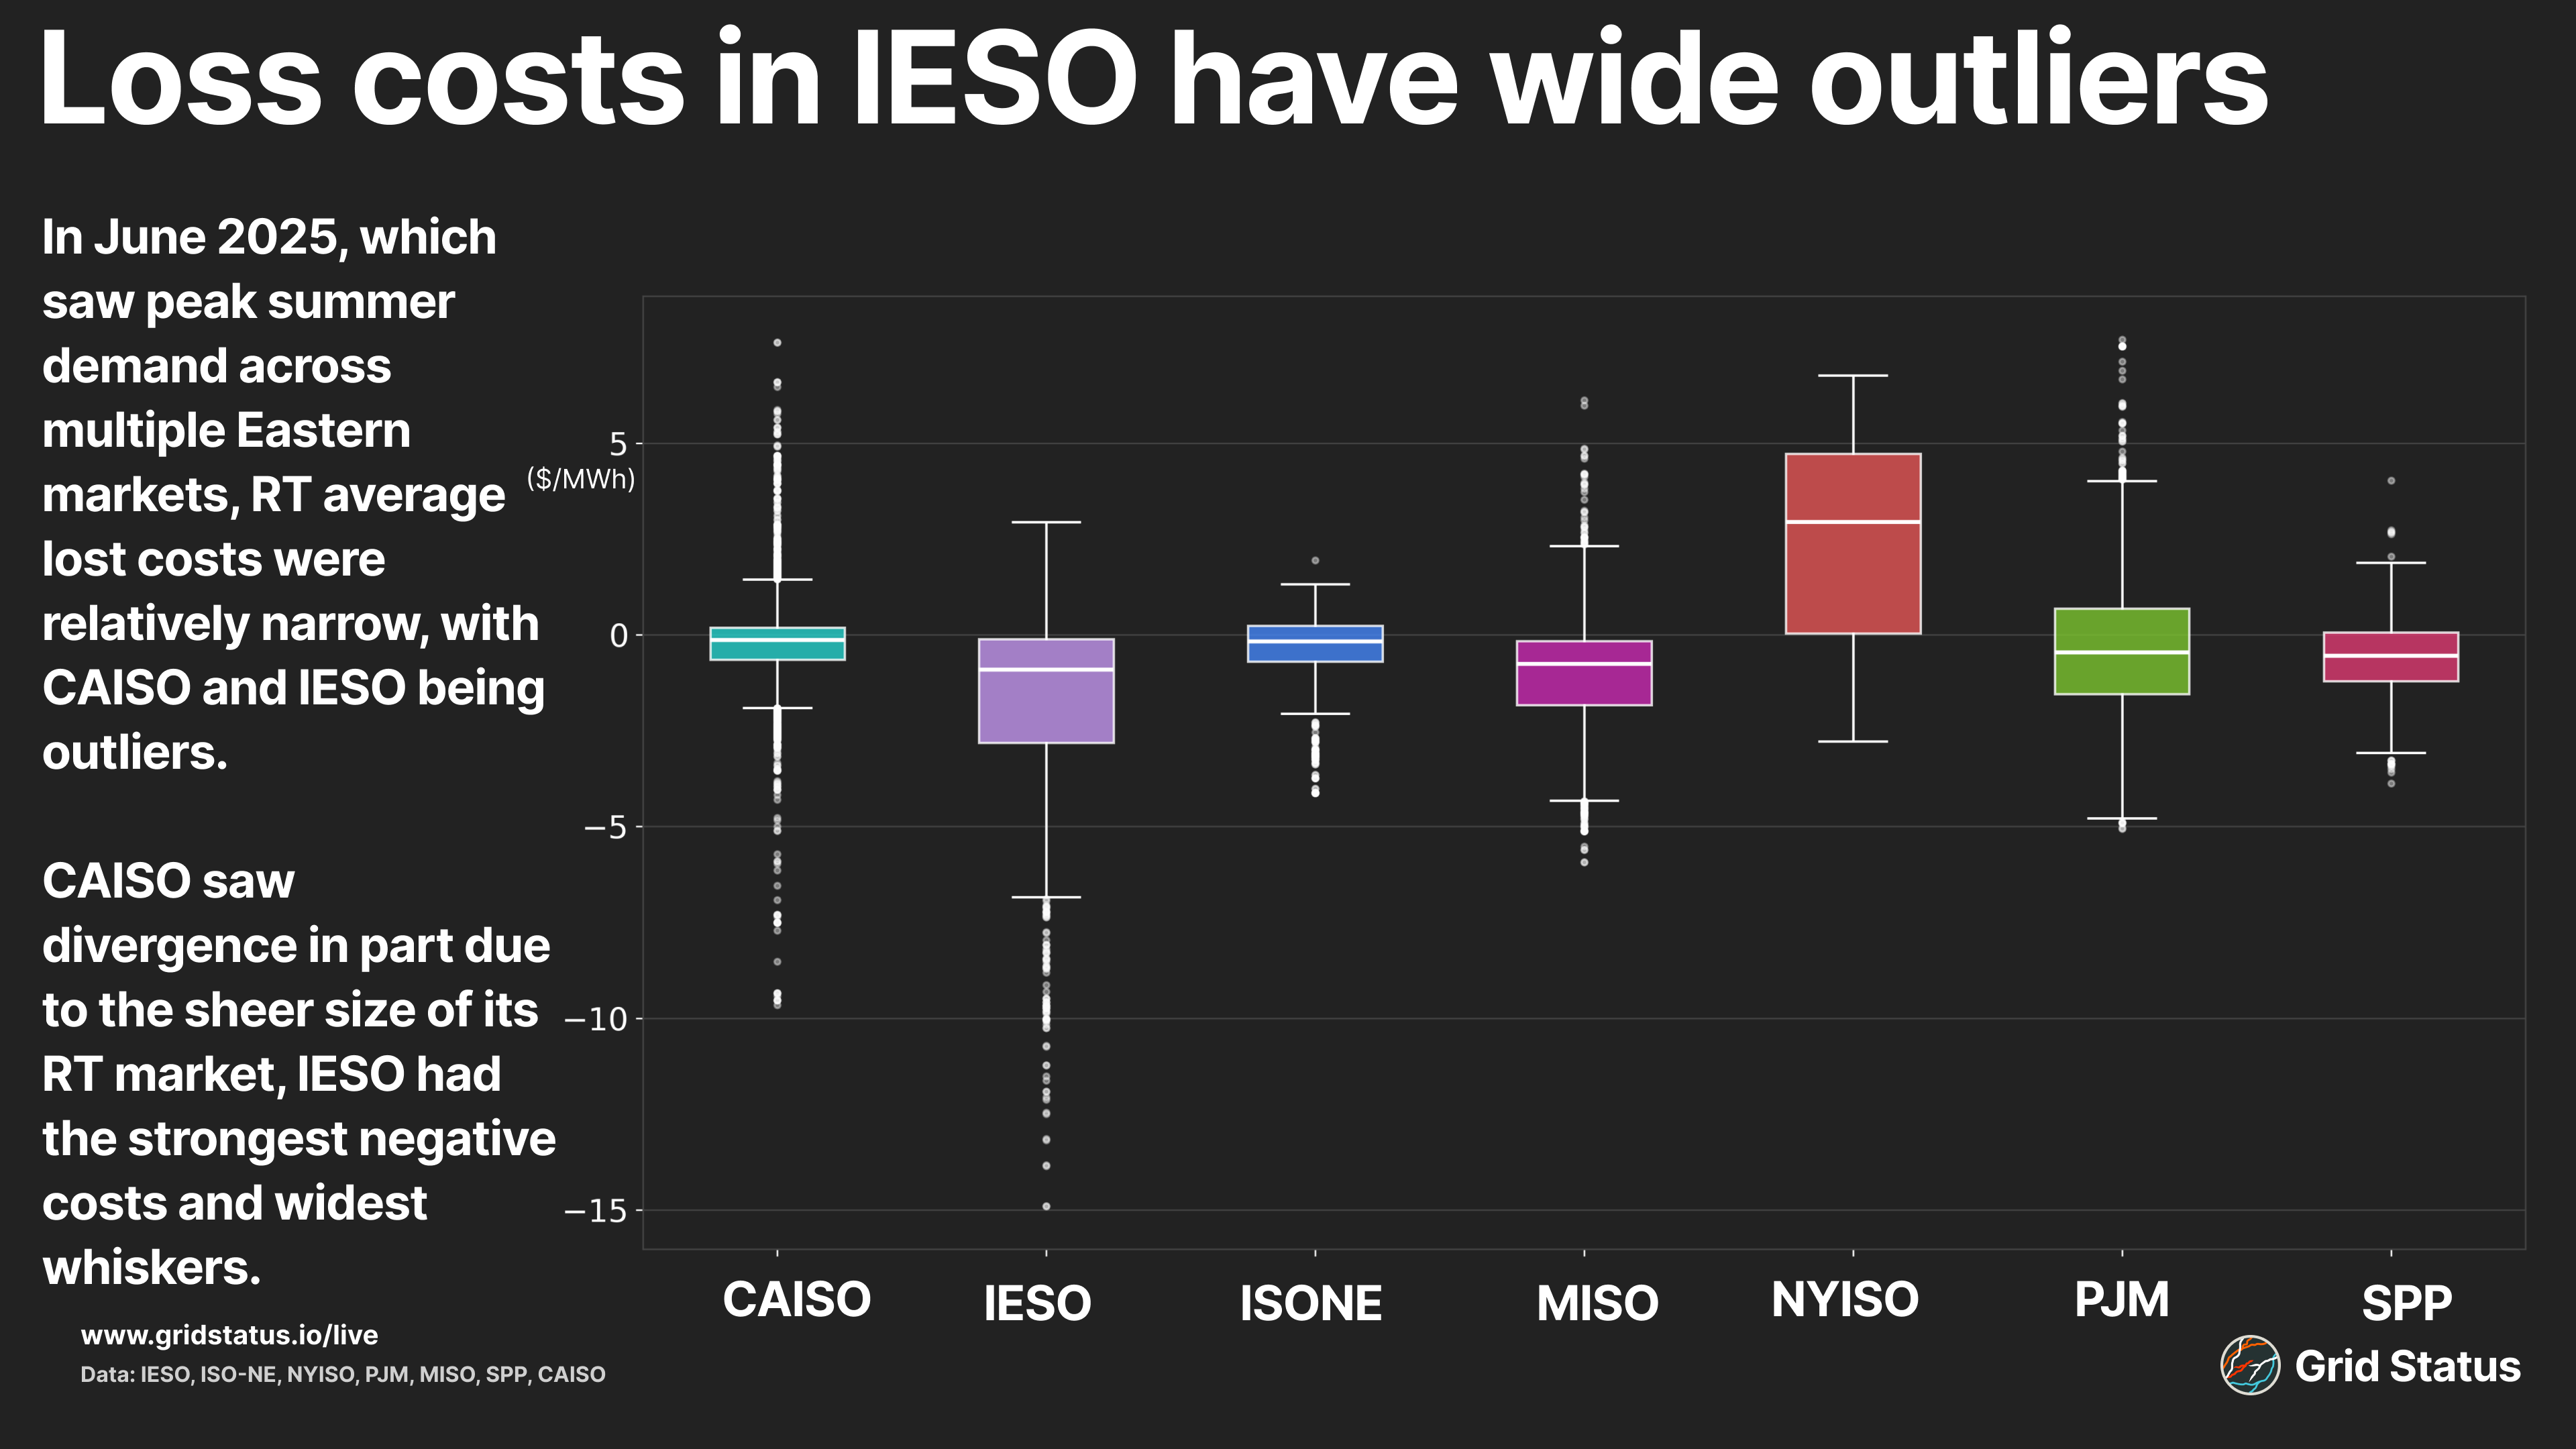
Even as other ISO averages were negative, IESO had the widest range in loss costs and numerous negative outliers. Putting these outliers in context becomes even more notable when compared with much larger markets like CAISO, which calculates loss costs for nodes spanning from Mexico to the British Columbia border.
Changes Abound
Major market changes are relatively uncommon, but as regions cope with the influx of new and more volatile renewable generation paired with the return of load growth, markets across the United States and Canada are embarking on major changes and expansions. CAISO and SPP are expanding their footprints across the West, with SPP successfully crossing the Eastern and Western interconnects with the launch of SPP West, and CAISO has integrated additional BA’s into its Day-Ahead market with the launch of EDAM.
Domestically, Alberta's grid operator AESO, plans to embark on its own nodal market expansion with the Restructured Energy Market program, set to launch in 2027.
As Ontario settles into its first year of nodal pricing, these reforms will reshape how North American power markets operate. We'll track how each one unfolds and what patterns emerge as these new markets mature.