
By The Thermostat's Red Glare
As America barreled towards the 250th, heat set up over much of the Eastern Interconnection, pushing systems towards their own milestones. We break down the expected, the surprises, and the specific pain points across PJM, NYISO, ISO-NE, and MISO.



As the US readied for its 250th Anniversary, grid operators across the Eastern Interconnect prepared to weather potentially record-breaking peaks.
Barely a year removed from the last major heat dome event, high temperatures pushed the grid towards records that have stood since before CDOs and CDSs were in the public consciousness. But unlike the financial crisis and Wall Street, our grid was resilient in the face of widespread heat.
You’ll produce long- and short-form market intelligence, have direct exposure to a wide audience across the industry, work with Grid Status leadership, and help shape the future of the product.
If any of that sounds interesting, feel free to reach out.
We’re breaking down the setup, market outcomes, and steps operators took during a complex holiday week heatwave. Let’s start in the place most befitting Independence Day, the home to Independence Hall, PJM.
I-95 Degrees and Higher
The burst of high heat and humidity in PJM wasn’t a shock. Weather models over a week away indicated heat indices pushing triple digits were in store for much of the RTO.
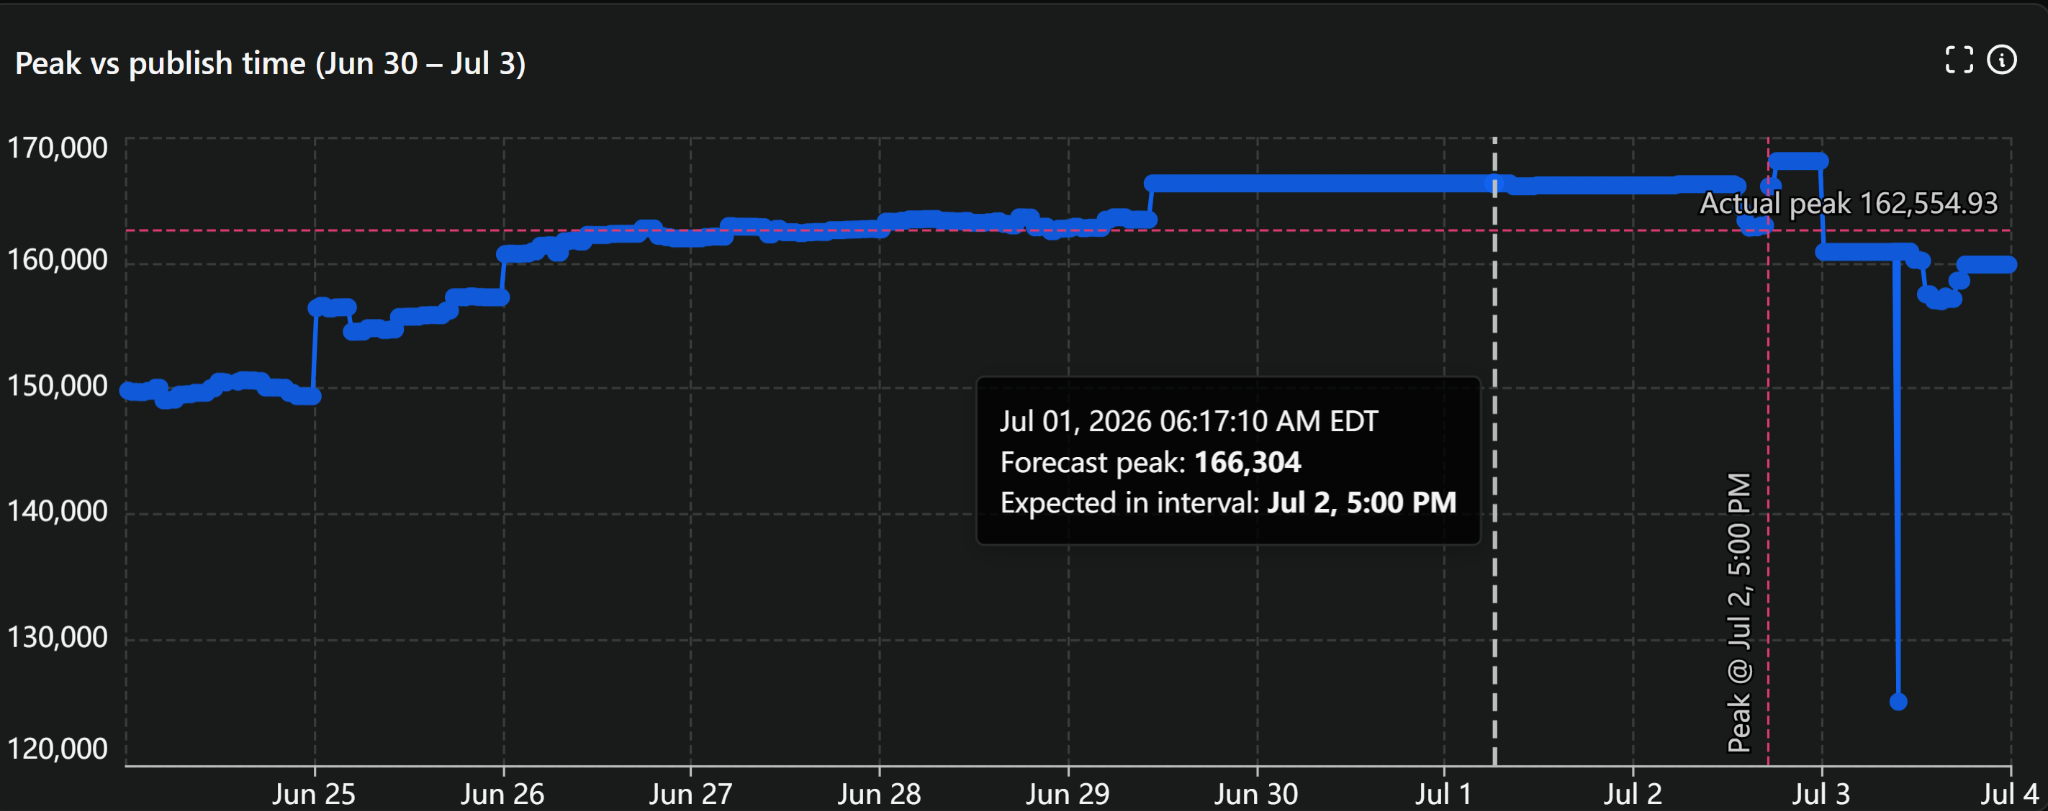
Initial forecasts kept the RTO below 160 GW before increased confidence shifted the focus to Thursday, 7/2. PJM issued its first 160 GW+ forecast for 7/2 on 6/26. This forecast remained largely flat across multiple days.
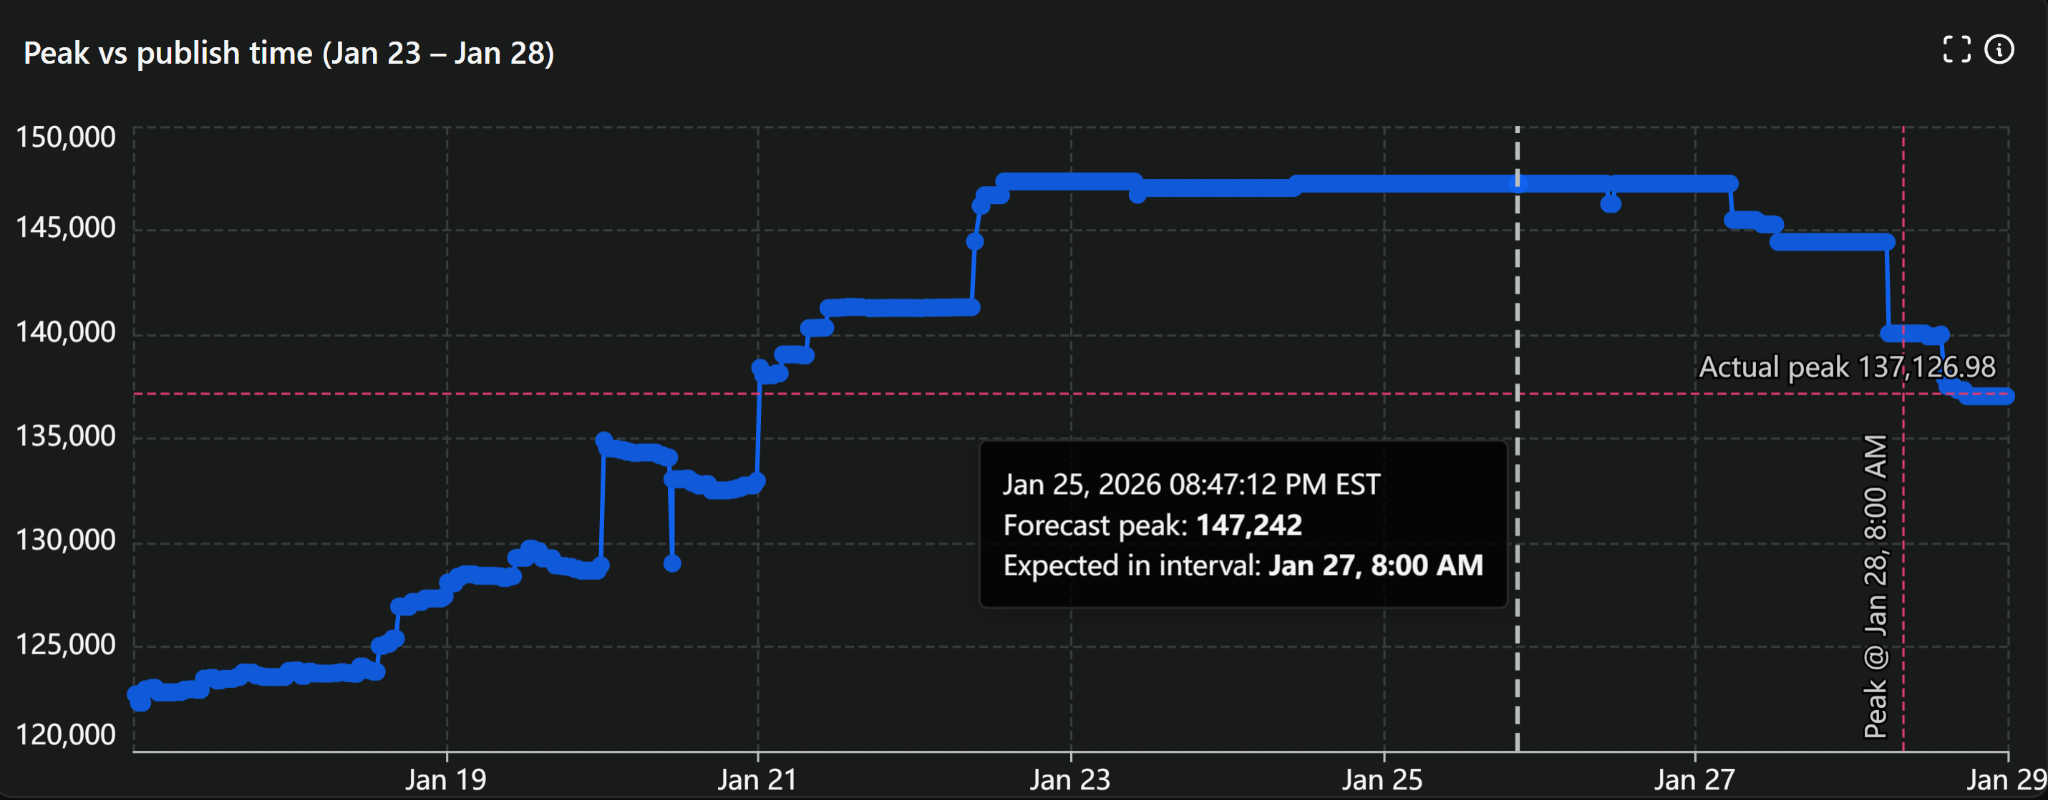
Something similar can be observed whenever a PJM forecast enters record territory, such as with Winter Storm Fern, earlier this year.
Given PJM’s wide territory, far western portions of the RTO saw heat and humidity build earlier in the week. At the same time, eastern PJM was still experiencing warm temperatures, lower dew points, and weaker absolute highs, which helped to limit the overall cooling response, keeping system-wide peaks comparatively weak over the start of the event.
By midweek, the highest heat indices pushed into Eastern PJM, including key demand centers along the I-95 corridor. This drove even stronger demand peaks as almost all of the RTO was under an intense heat dome, with heat indices pushing well into the triple digits.
With high heat indices across the region, and despite demand-side action in the form of demand response and voluntary load reductions, preliminary hourly demand peaked at 162.5 GW on July 2nd.
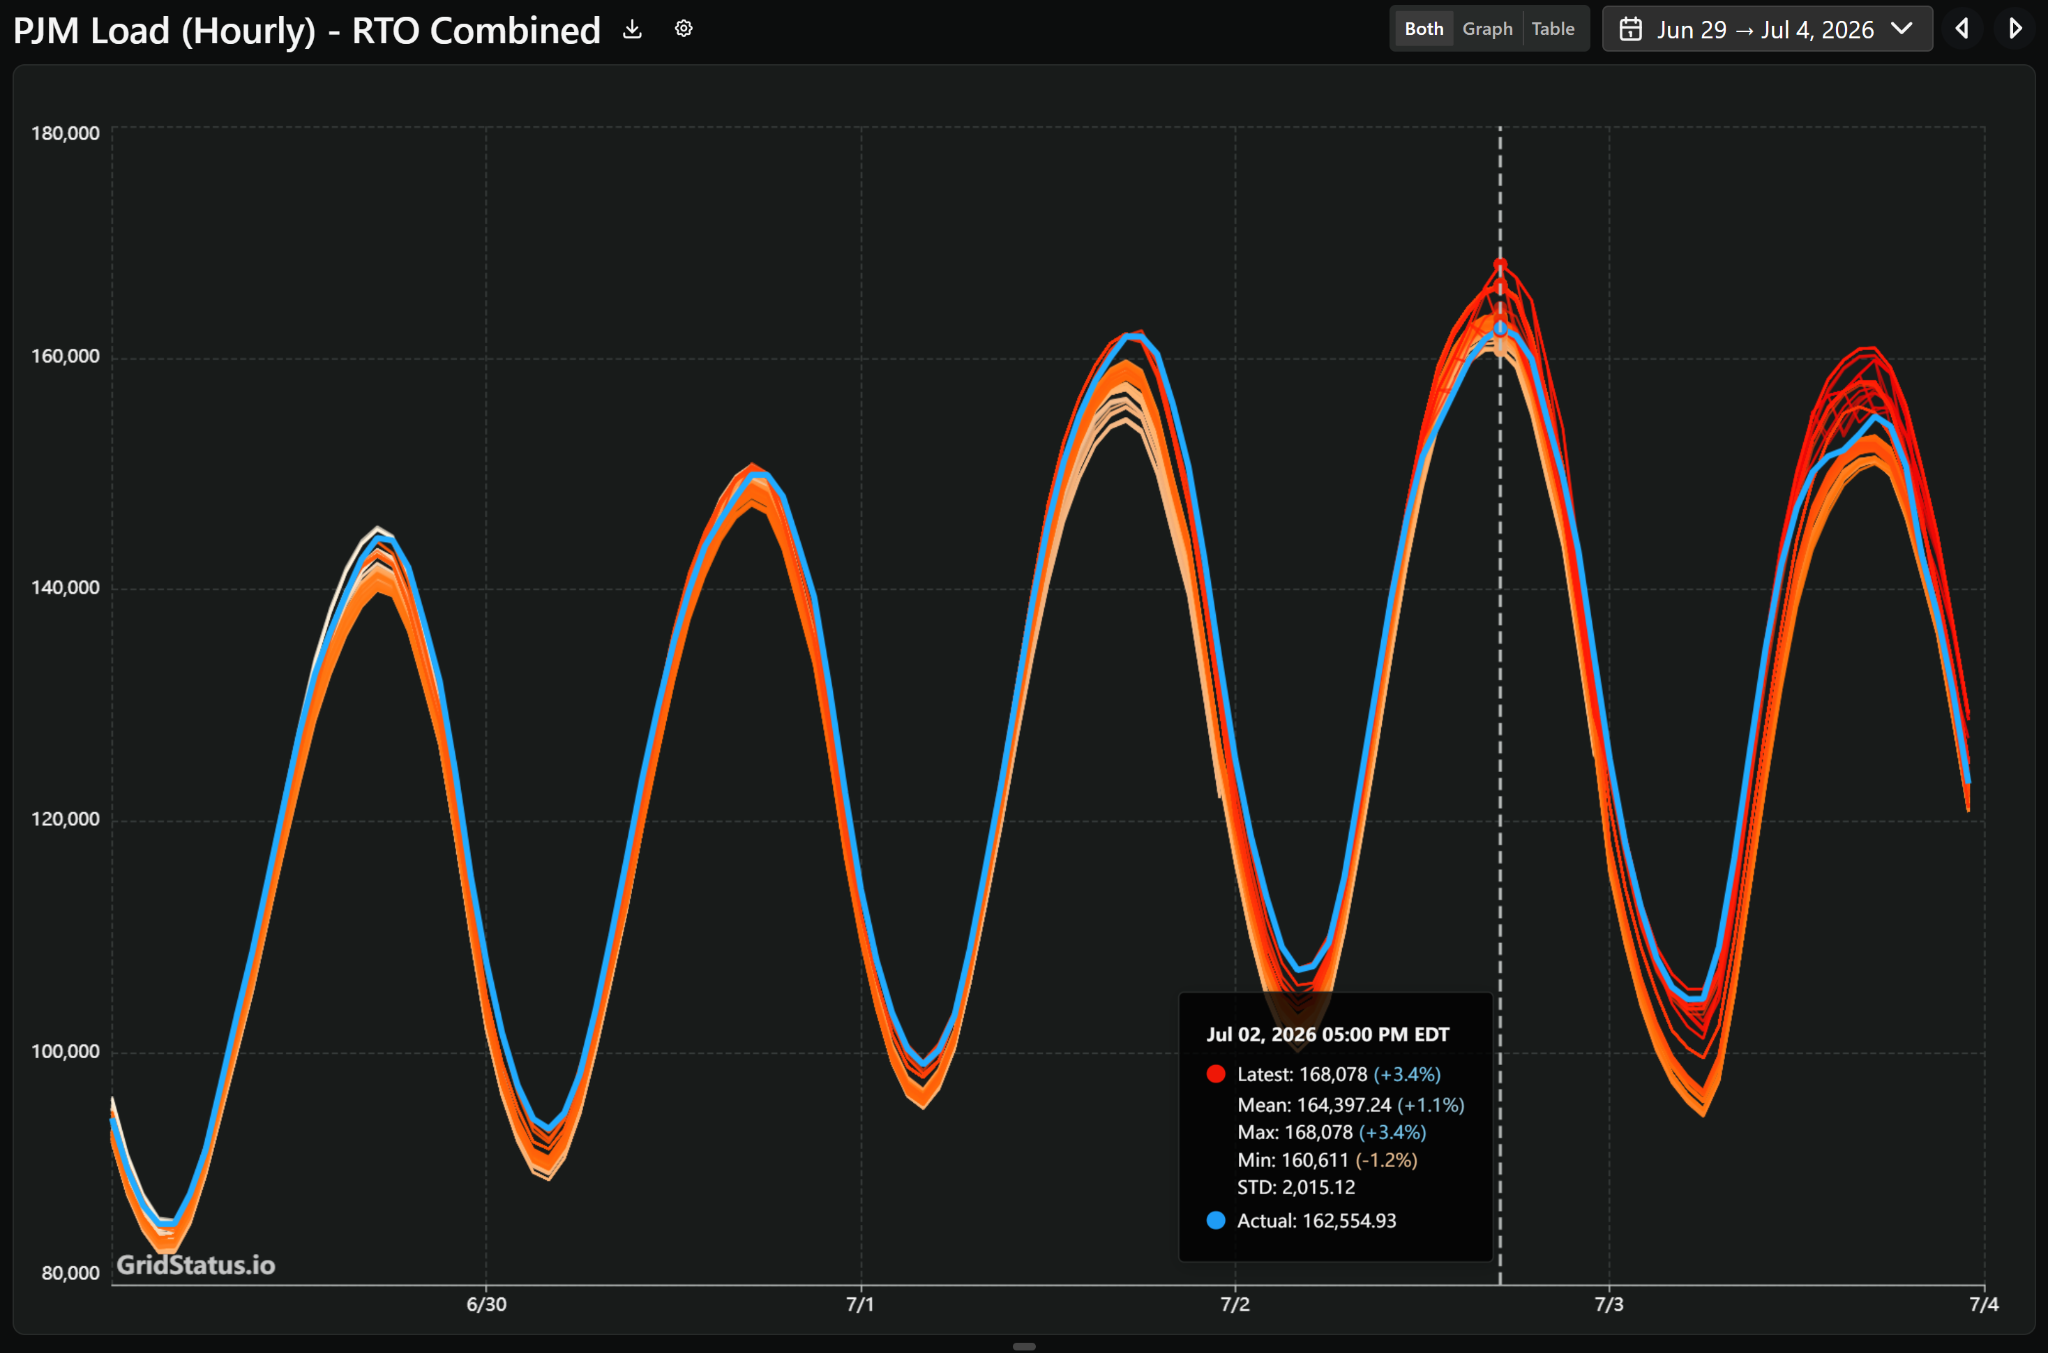
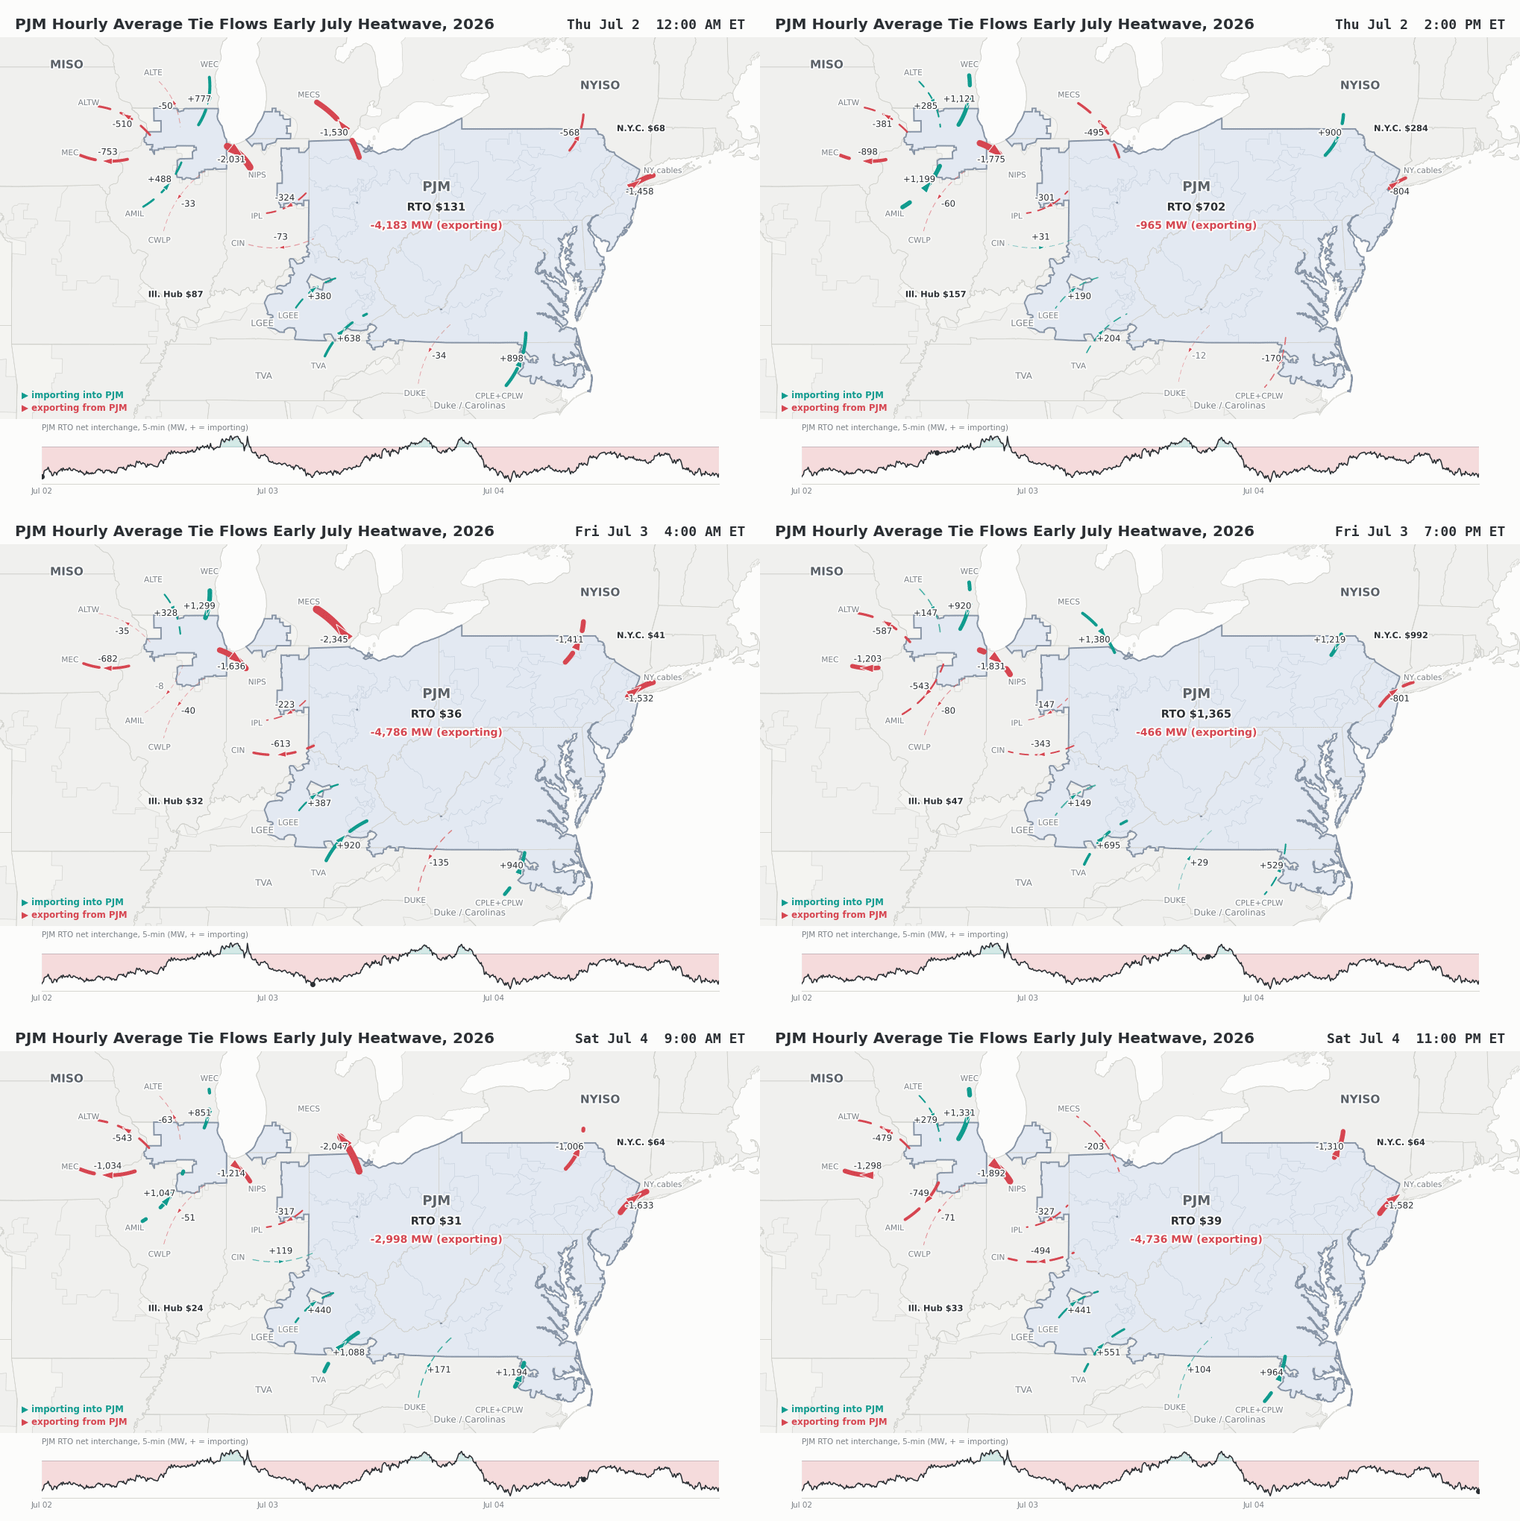
By Friday, 7/3, the highest heat indices were concentrated in Eastern PJM, leading to a disproportionate level of cooling load in the Mid-Atlantic and South. This concentration of cooling load helped to amplify power flows into the region, which only complicated operations as the RTO balanced the impacts of the 4th of July holiday observance.
Mid-Atlantic Congestion
With high demand across the RTO came congestion, leading to extreme swings in both nodal and zonal level prices. Two zones that saw tremendous levels of upside were Dominion (DOM) and Delmarva Power and Light (DPL). Despite different load drivers, they are geographic neighbors and can share common outcomes during extreme events as power struggles to flow towards demand.
In DOM, data center alley is the clearest example. This portion of Northern Virginia is home to the largest existing concentration of data centers in the world, with multiple GWs of existing capacity, and multiple more of planned additions. Despite Dominion experiencing some of the highest zonal prices in both the day-ahead and real-time markets, Northern Virginia still saw disproportionate levels of upside relative to its zone.
We can see the impact of data center alley congestion and the differing outcomes by examining the ROUNDTBL36.5 KV LD2 node compared to the wider DOM zone. This node is located at a 230kV substation located on site at the Digital Reality Northern Virginia IAD39 data center.
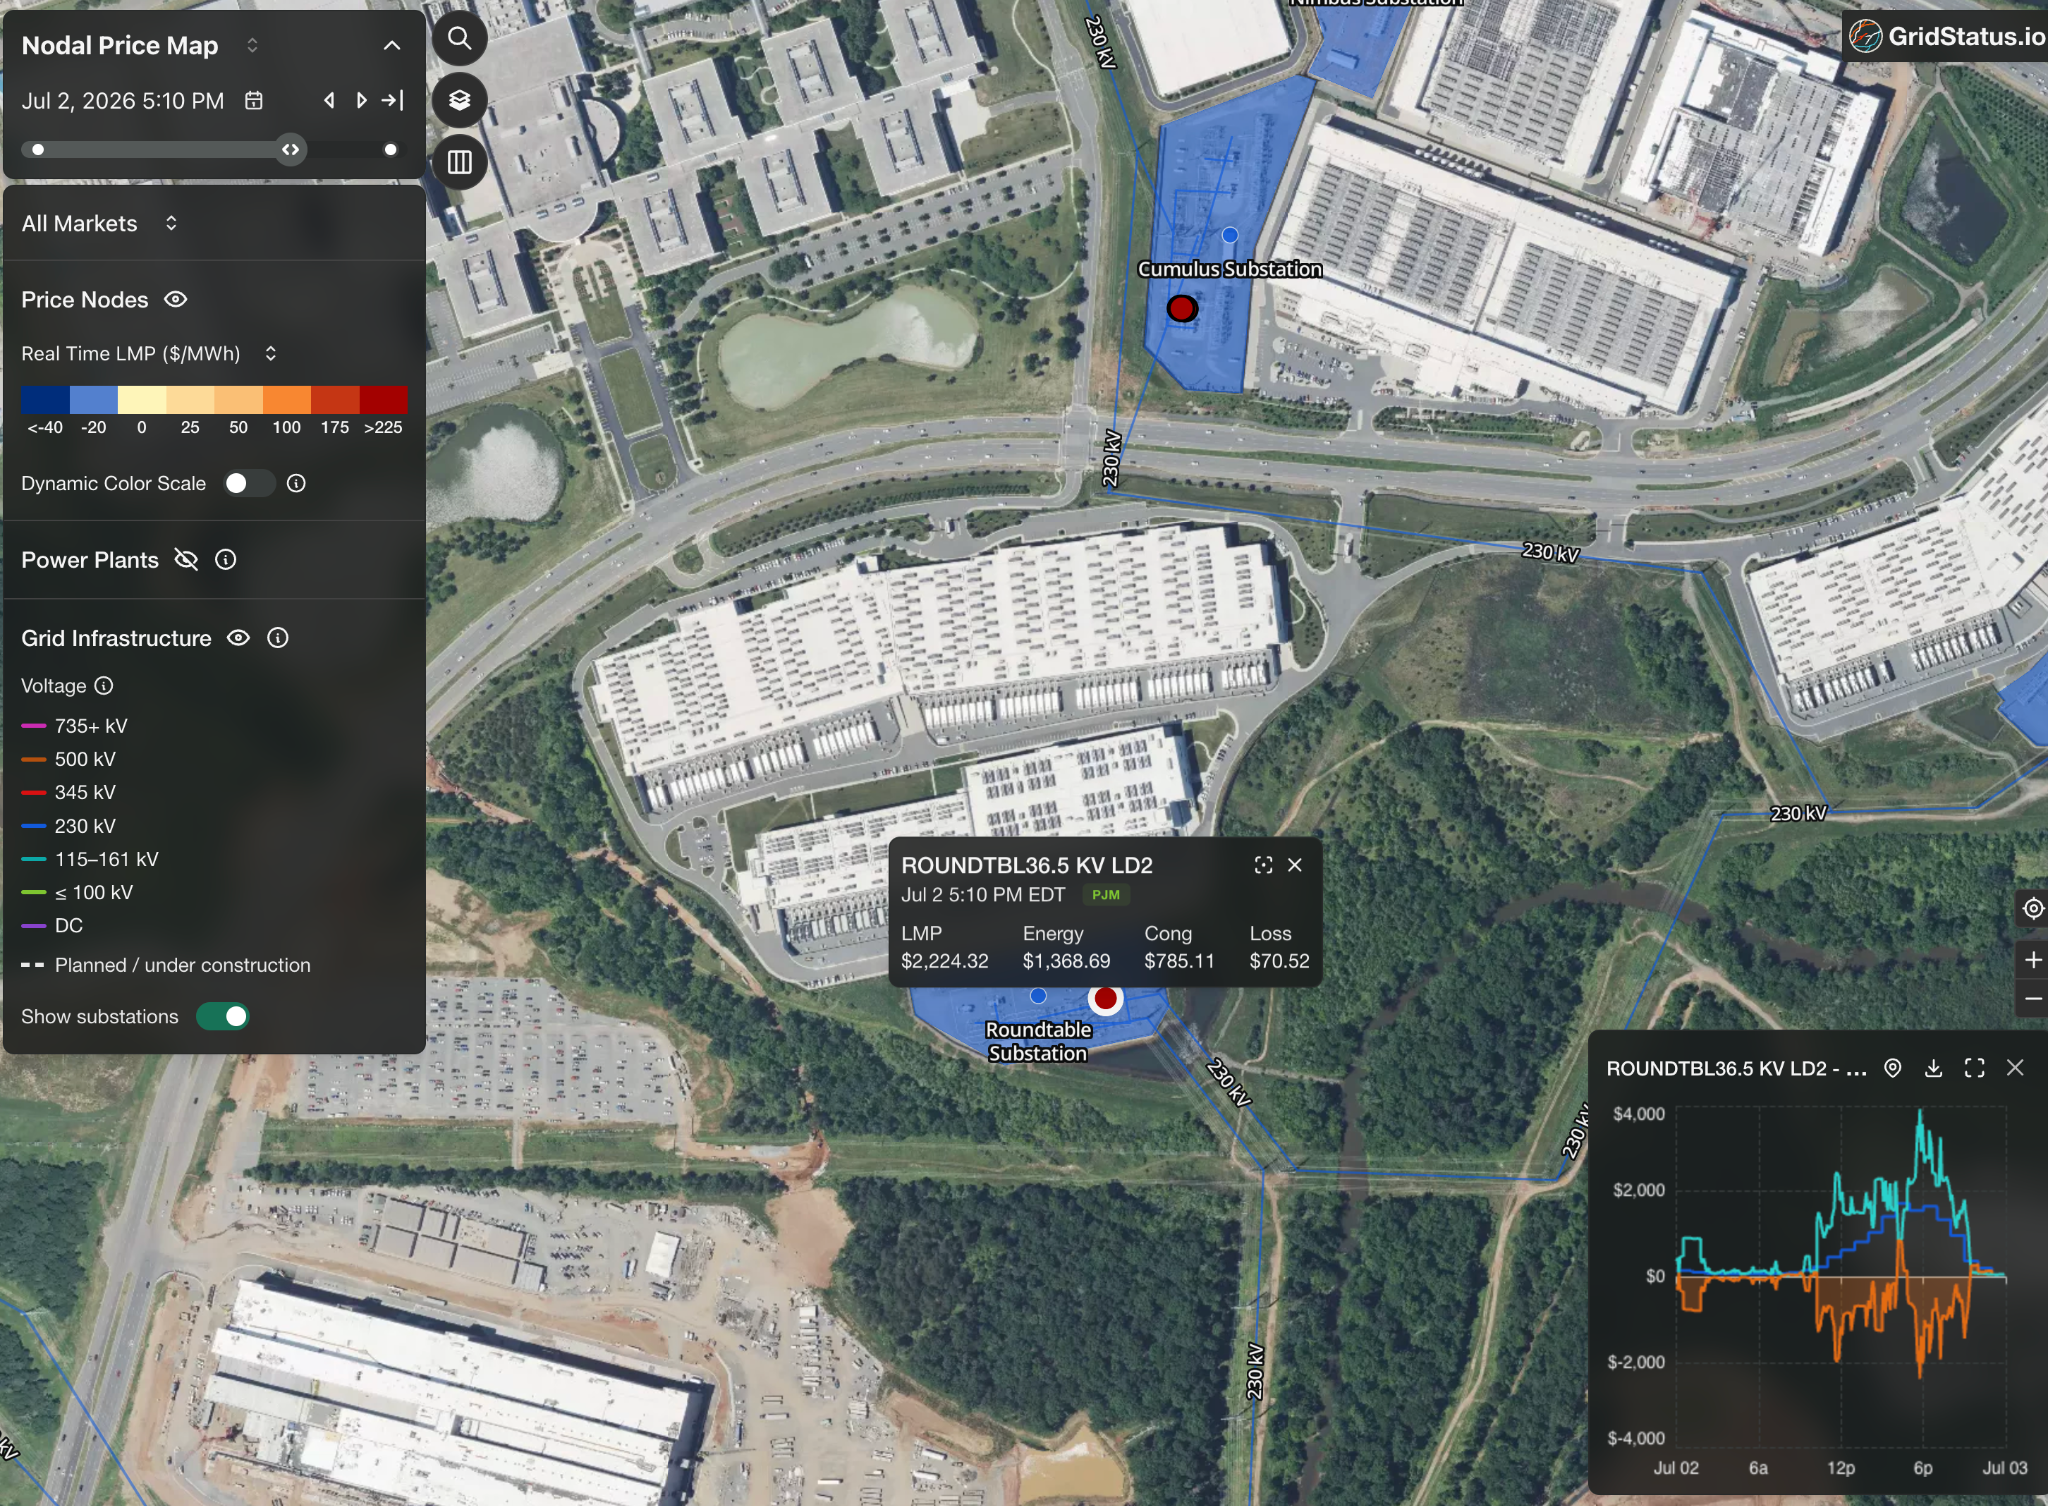
This node saw explosive levels of congestion compared to the wider region.
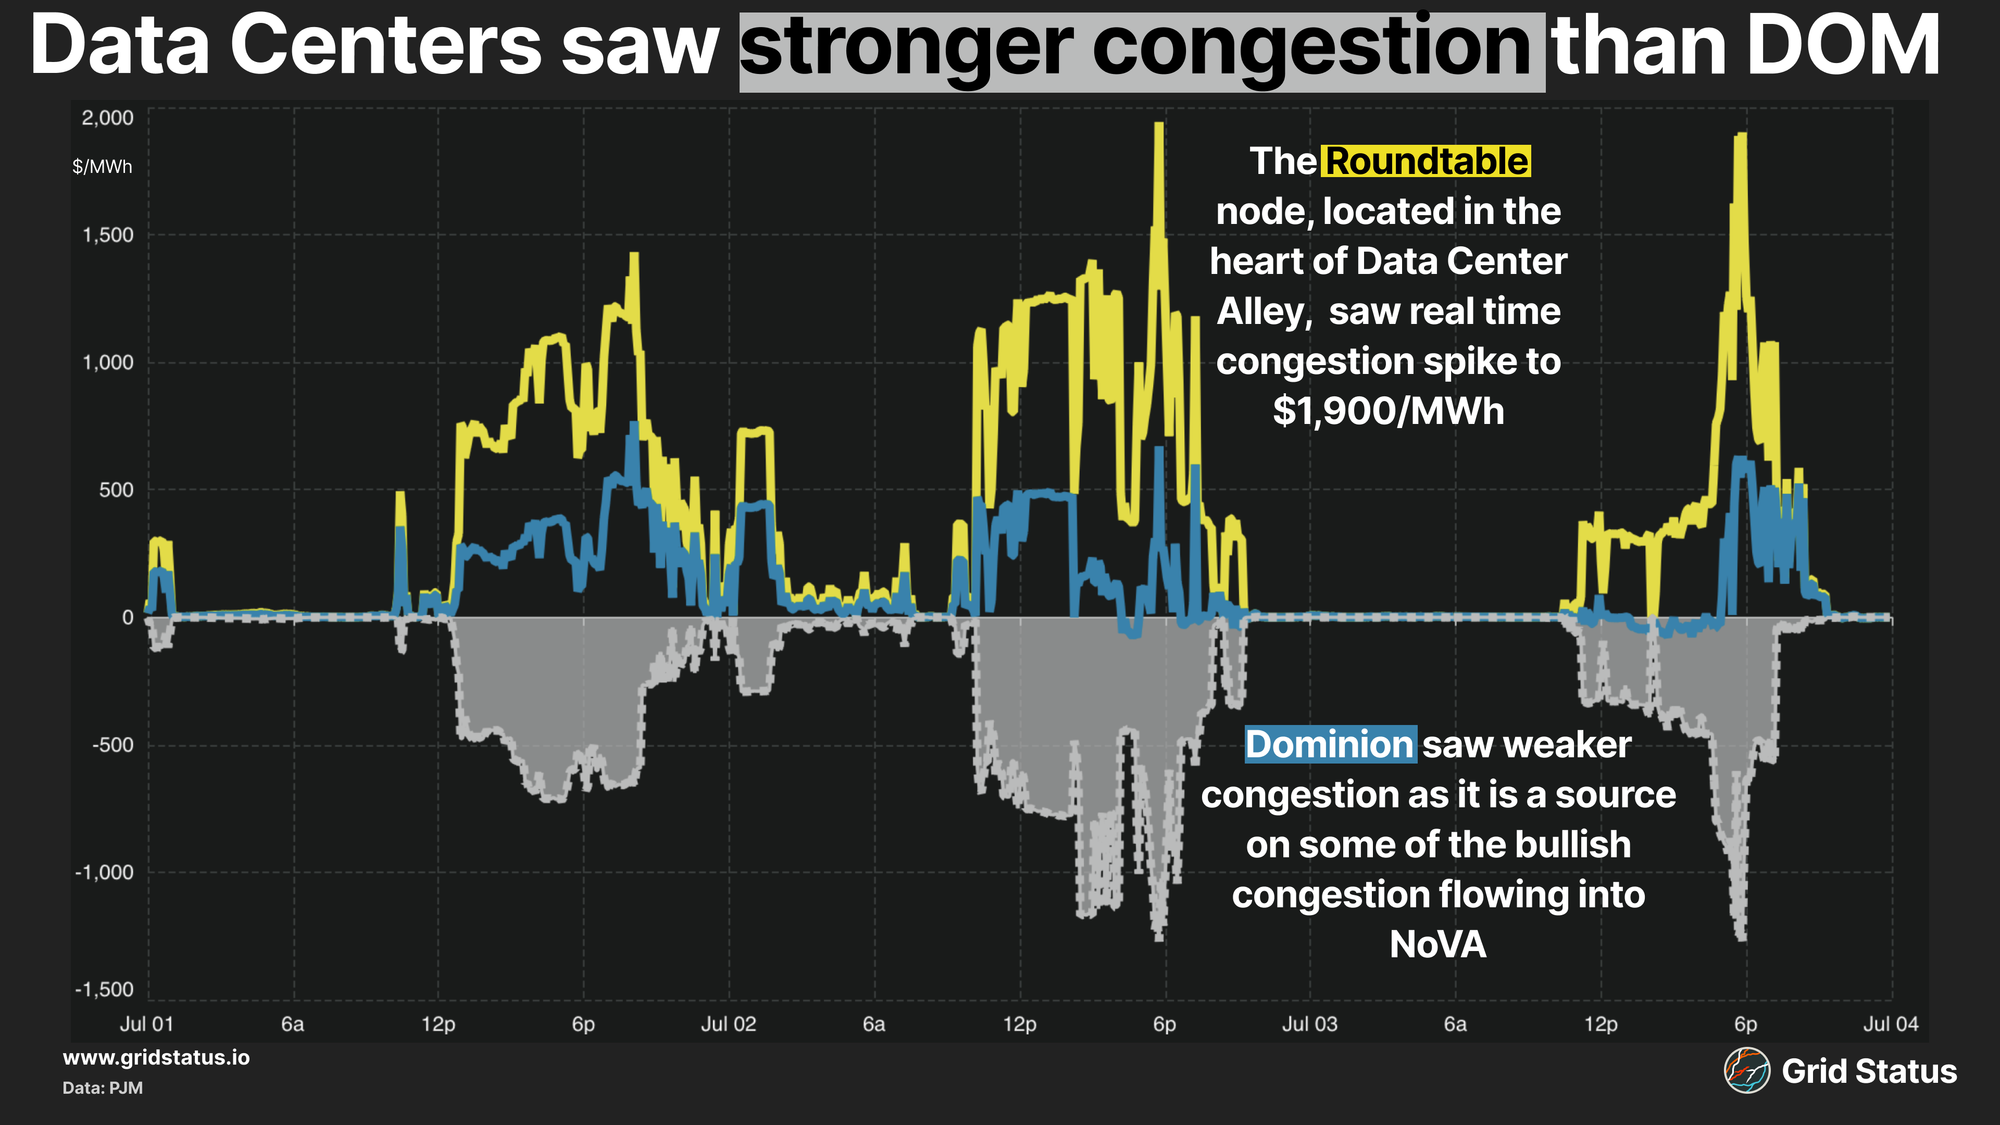
Even though the two directionally moved together, Roundtable often saw a daytime congestion basis to DOM greater than $500/MWh, regularly spiking to over $1,000/MWh in the evening.
During the heat wave, the top real-time RTO-wide constraints included Morrisville-Loudoun, Aquia Harbor-Cranes Corner, Goose Creek XF, and Pleasant View XF. Each of these constraints sent disproportionate upside to data center alley compared to the DOM zone, reflecting challenges flowing both N-S and S-N into the region.
This nodal/zonal spread was not limited to Dominion, as CONCRDDP69 KV CONCRD, a 69kV load node in rural Southwestern Delaware, saw extreme volatility compared to its zone.
Delmarva Power and Light (DPL) is no stranger to volatility, as during high demand, power often tends to hit natural bottlenecks flowing down the peninsula. Additionally, limited dispatchable generation, largely oil peakers on the Southern half of the peninsula, complicates flows.
These factors led to strong congestion over the second half of the week as high heat indices drove extreme congestion, with CONCRDDP69 KV CONCRD sitting on the sink of Concord-Laurel, Fruitland-Loretto, and Cool Spring-Milford.
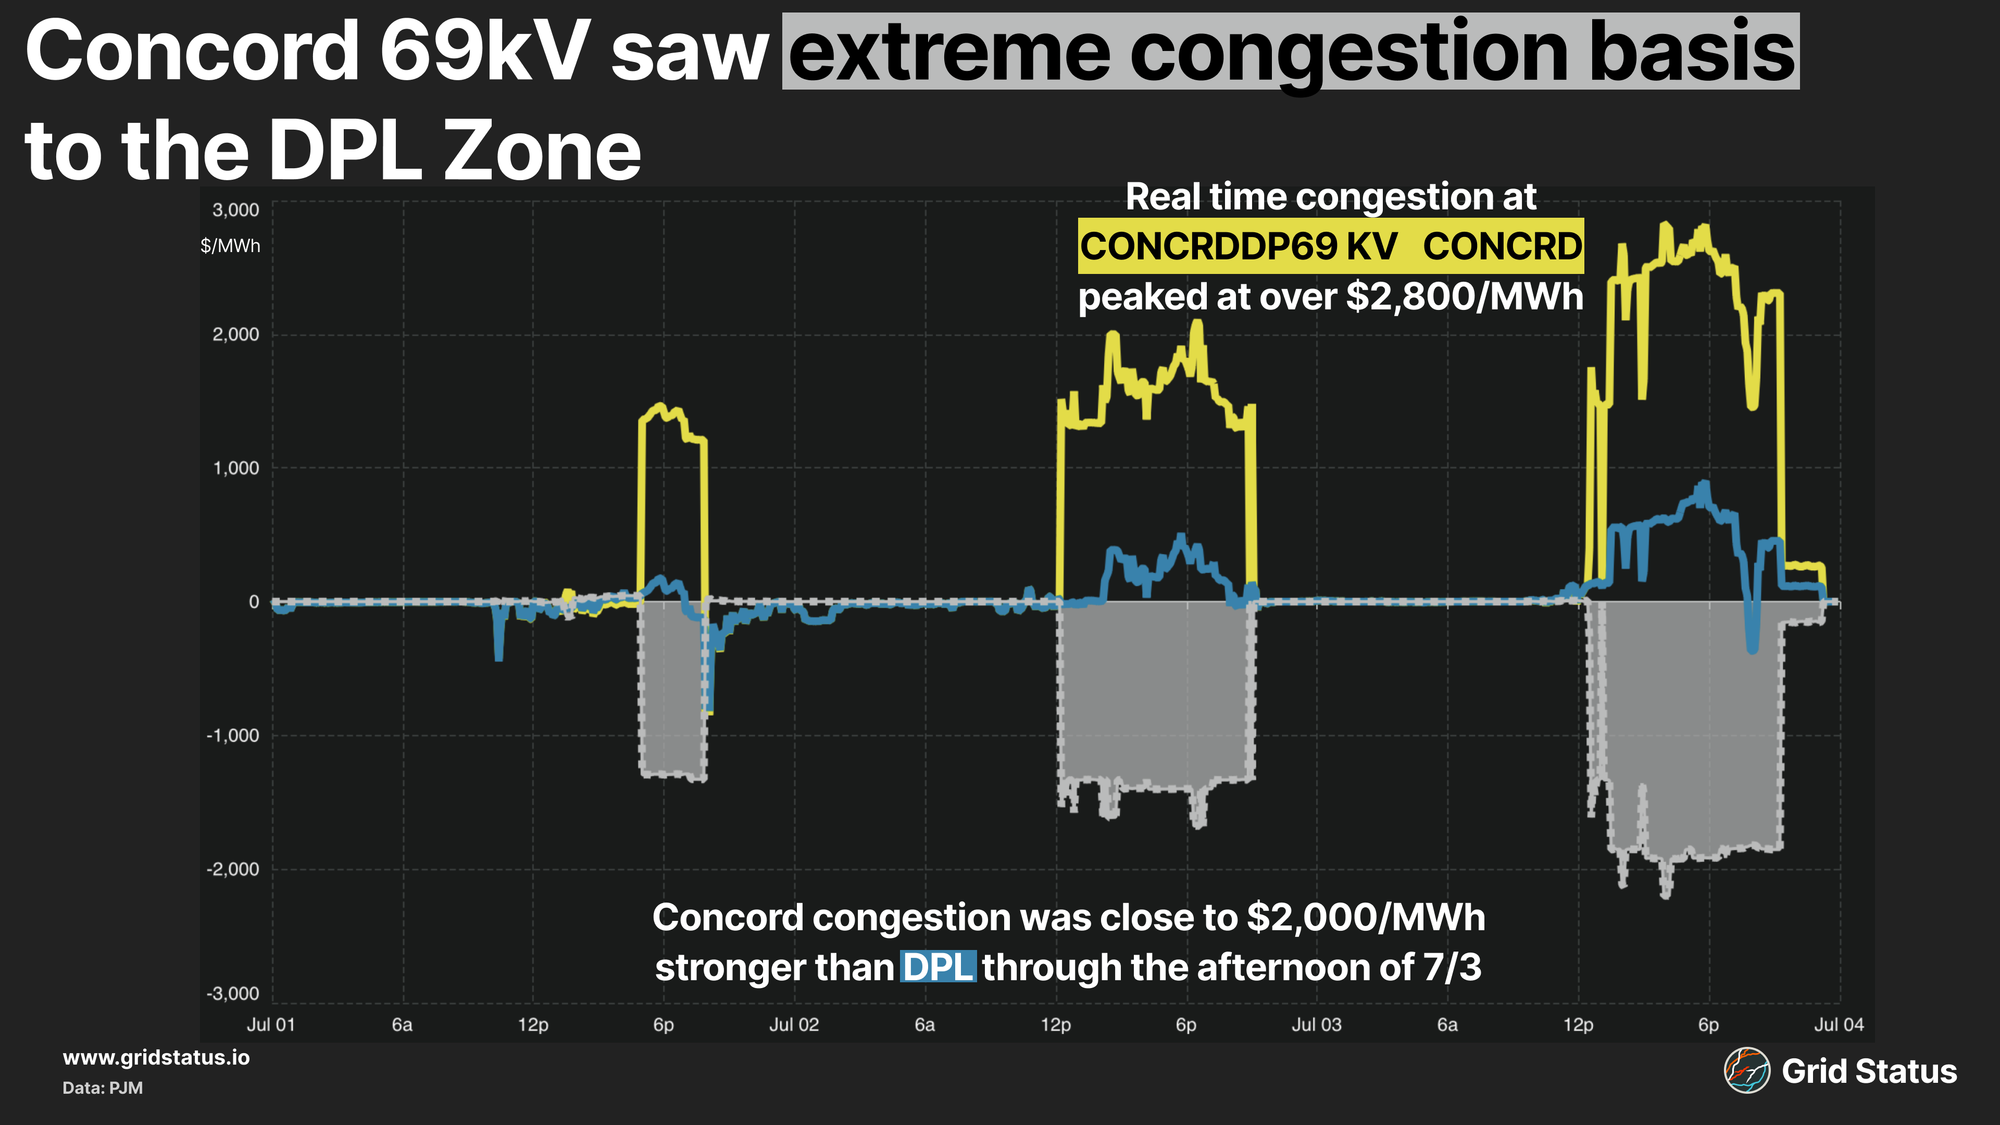
RT LMPs at CONCRDDP69 KV CONCRD often exceeded $4,000/MWh over the afternoon and evening as congestion costs blew past $1,000/MWh to nearly $3k by the 3rd, well above the DPL zone congestion price of $900/MWh.
Market-wide DART spreads flipped by the time the holiday weekend fully hit.
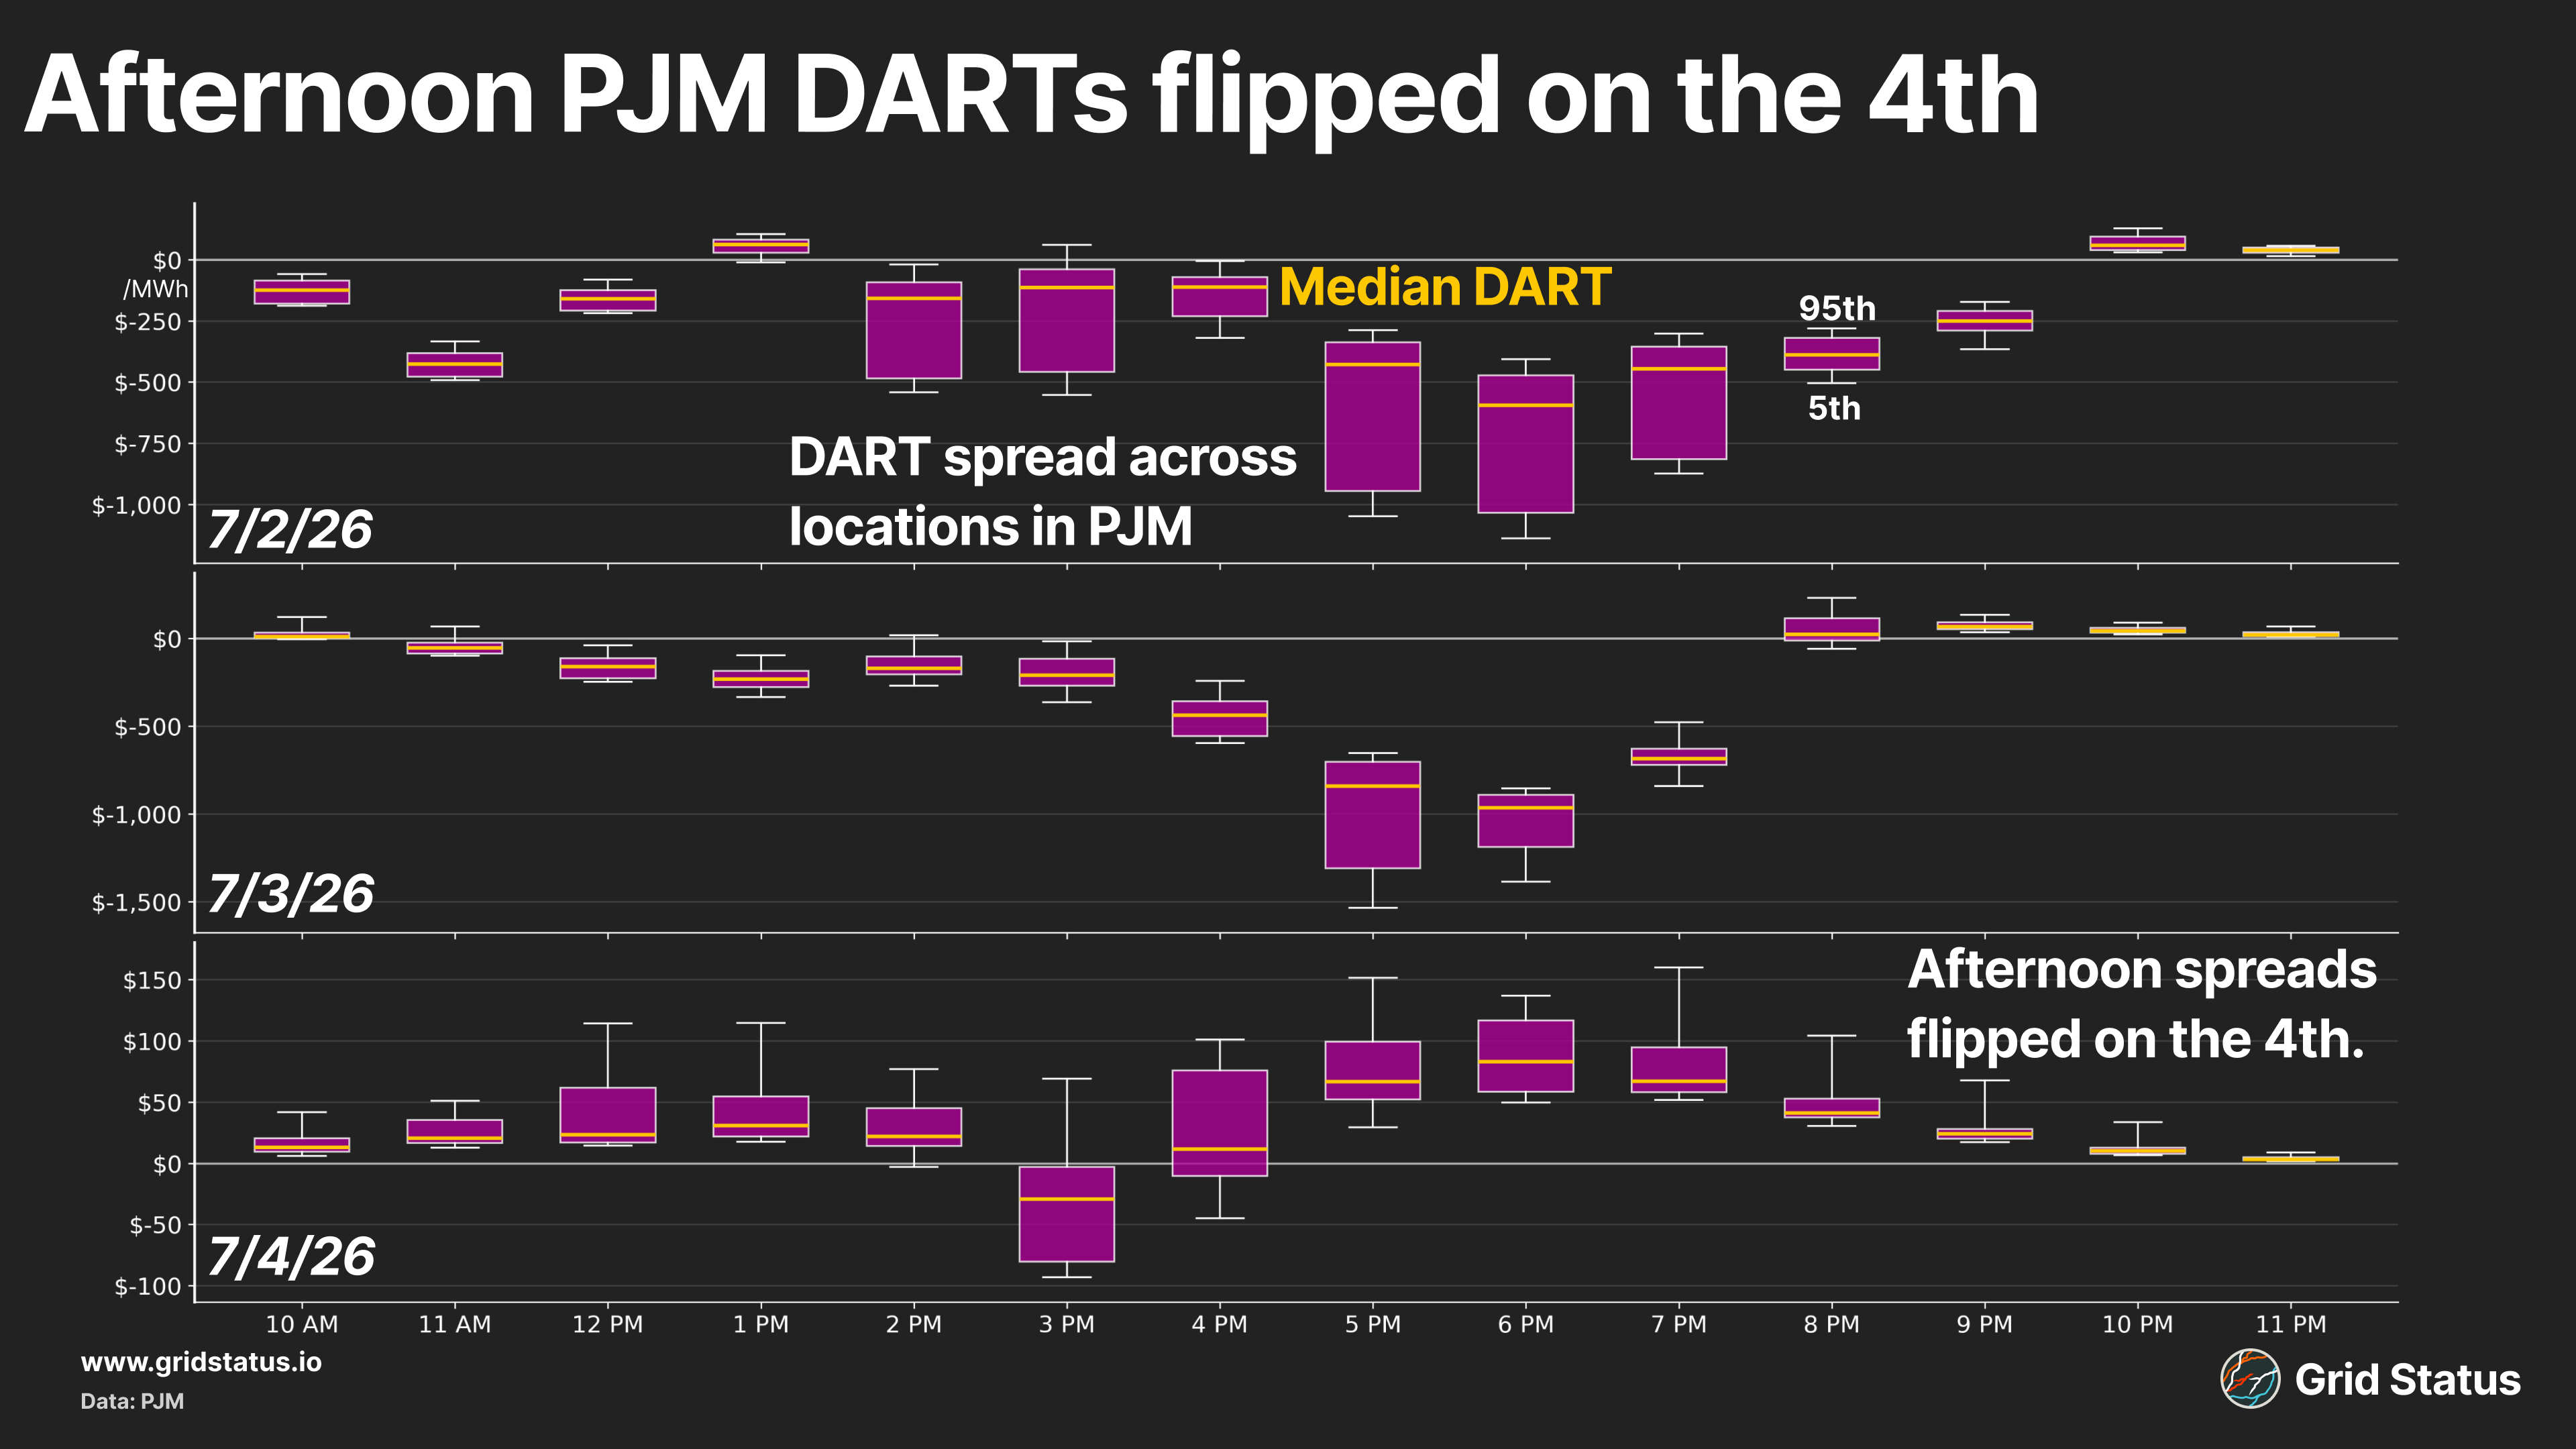
While real-time prices beat the day-ahead across nearly all market locations on the 2nd and 3rd, the market reversed over the peak demand period on the 4th.
Demanding Demand
During the height of the heat wave, PJM saw demand resources reduce consumption, both as a result of demand response activations but also voluntary load reductions.
Similar to other large markets, large loads are subject to demand charges based on their contribution to peak load during the 5 coincidence peaks in PJM (5CP). Given the clear 5CP risk posed by Thursday, industrial load visibly reduced consumption to avoid exposure.
The impact of this response was visible in both the shape of load and the regions that saw this verify.
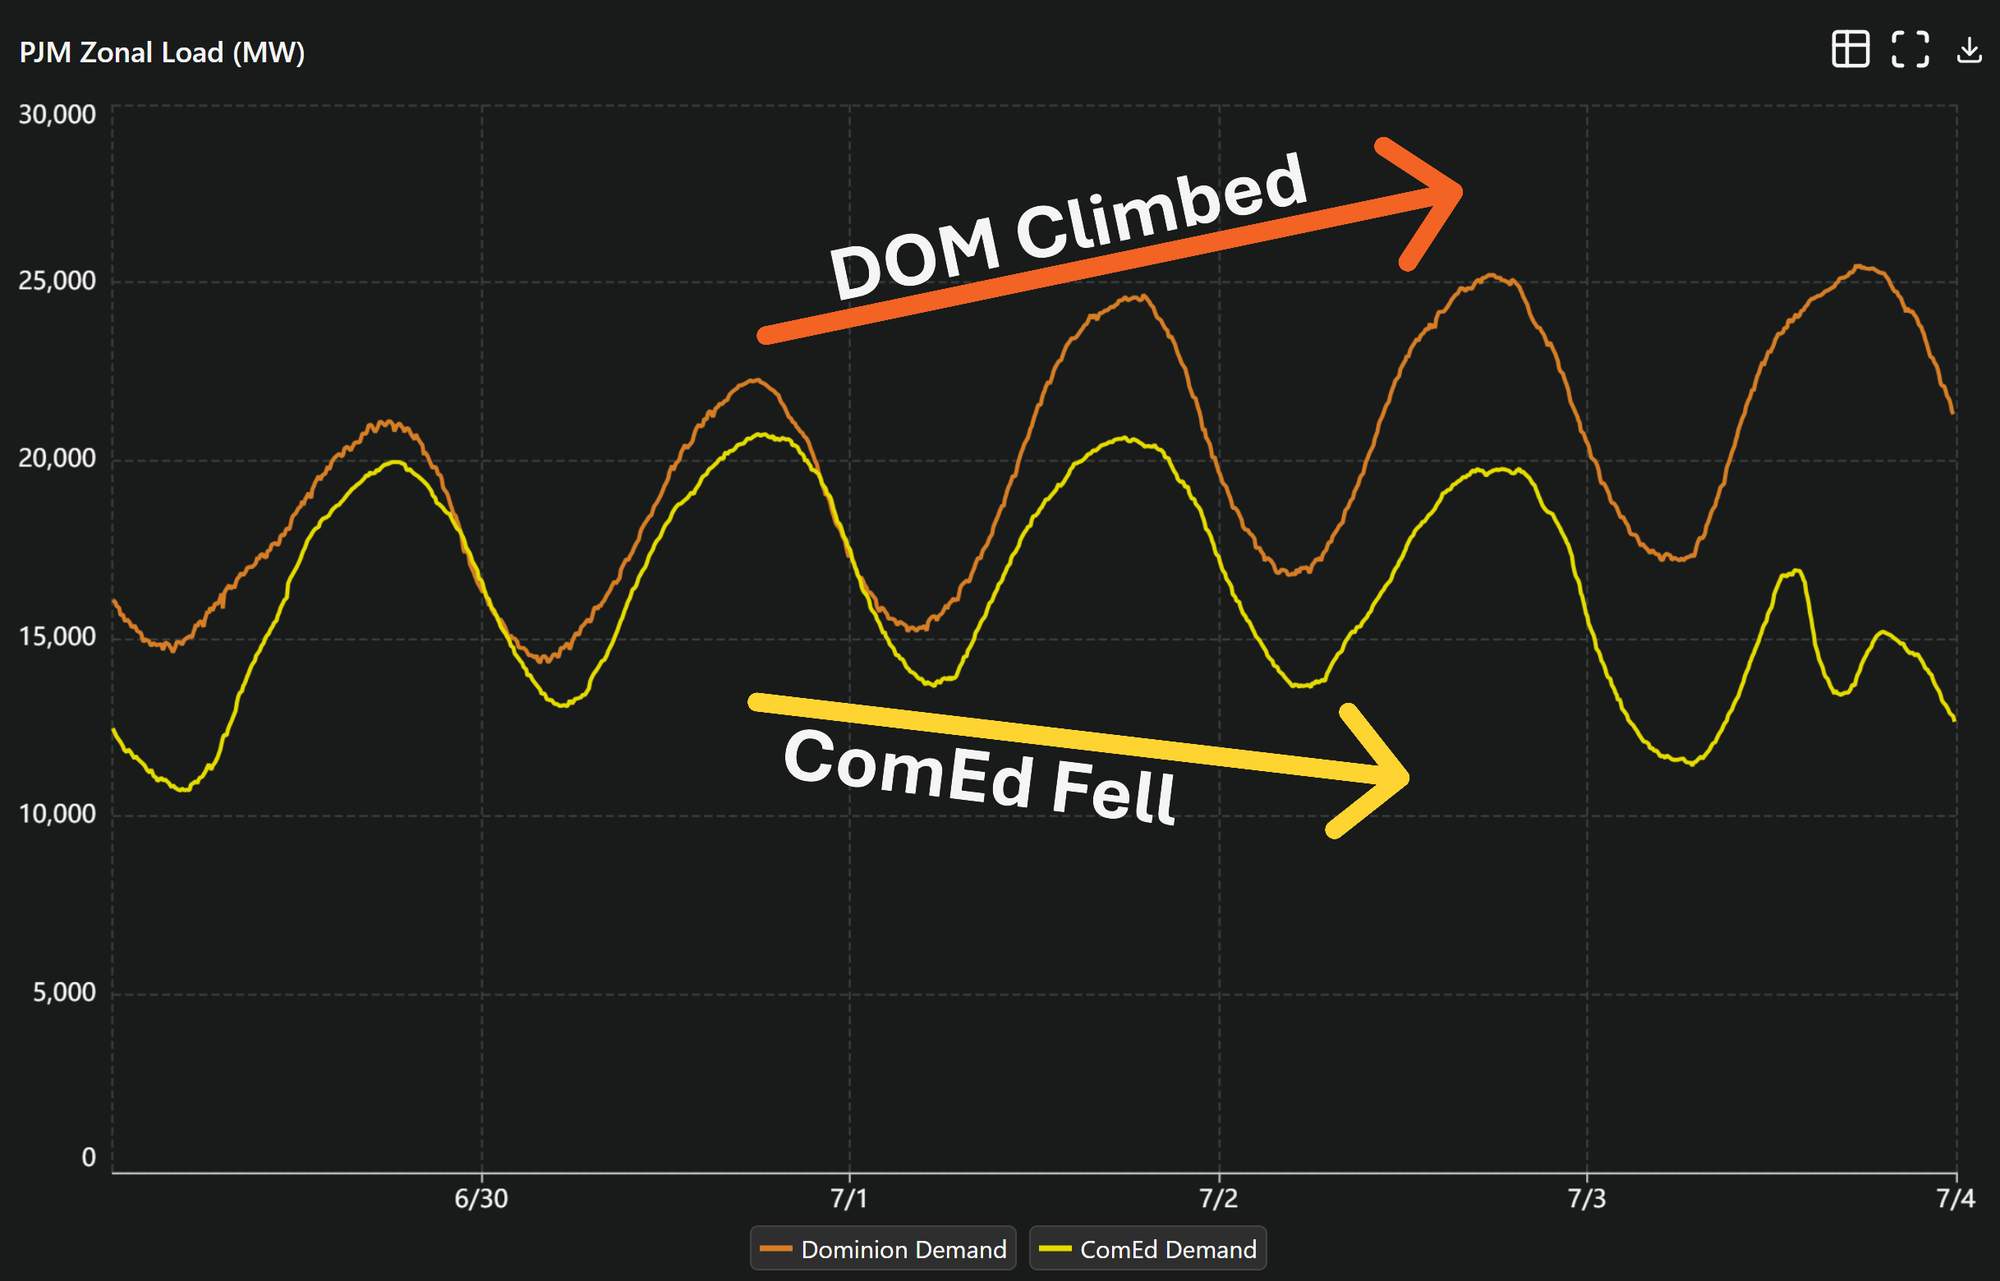
AEP, arguably PJM’s most diverse geographic zone, is home to a large percentage of industrial load, much of which is in Ohio. On 7/2, AEP load was notably flat over the afternoon, likely as a result of voluntary demand reductions from industrial users to avoid demand charges.
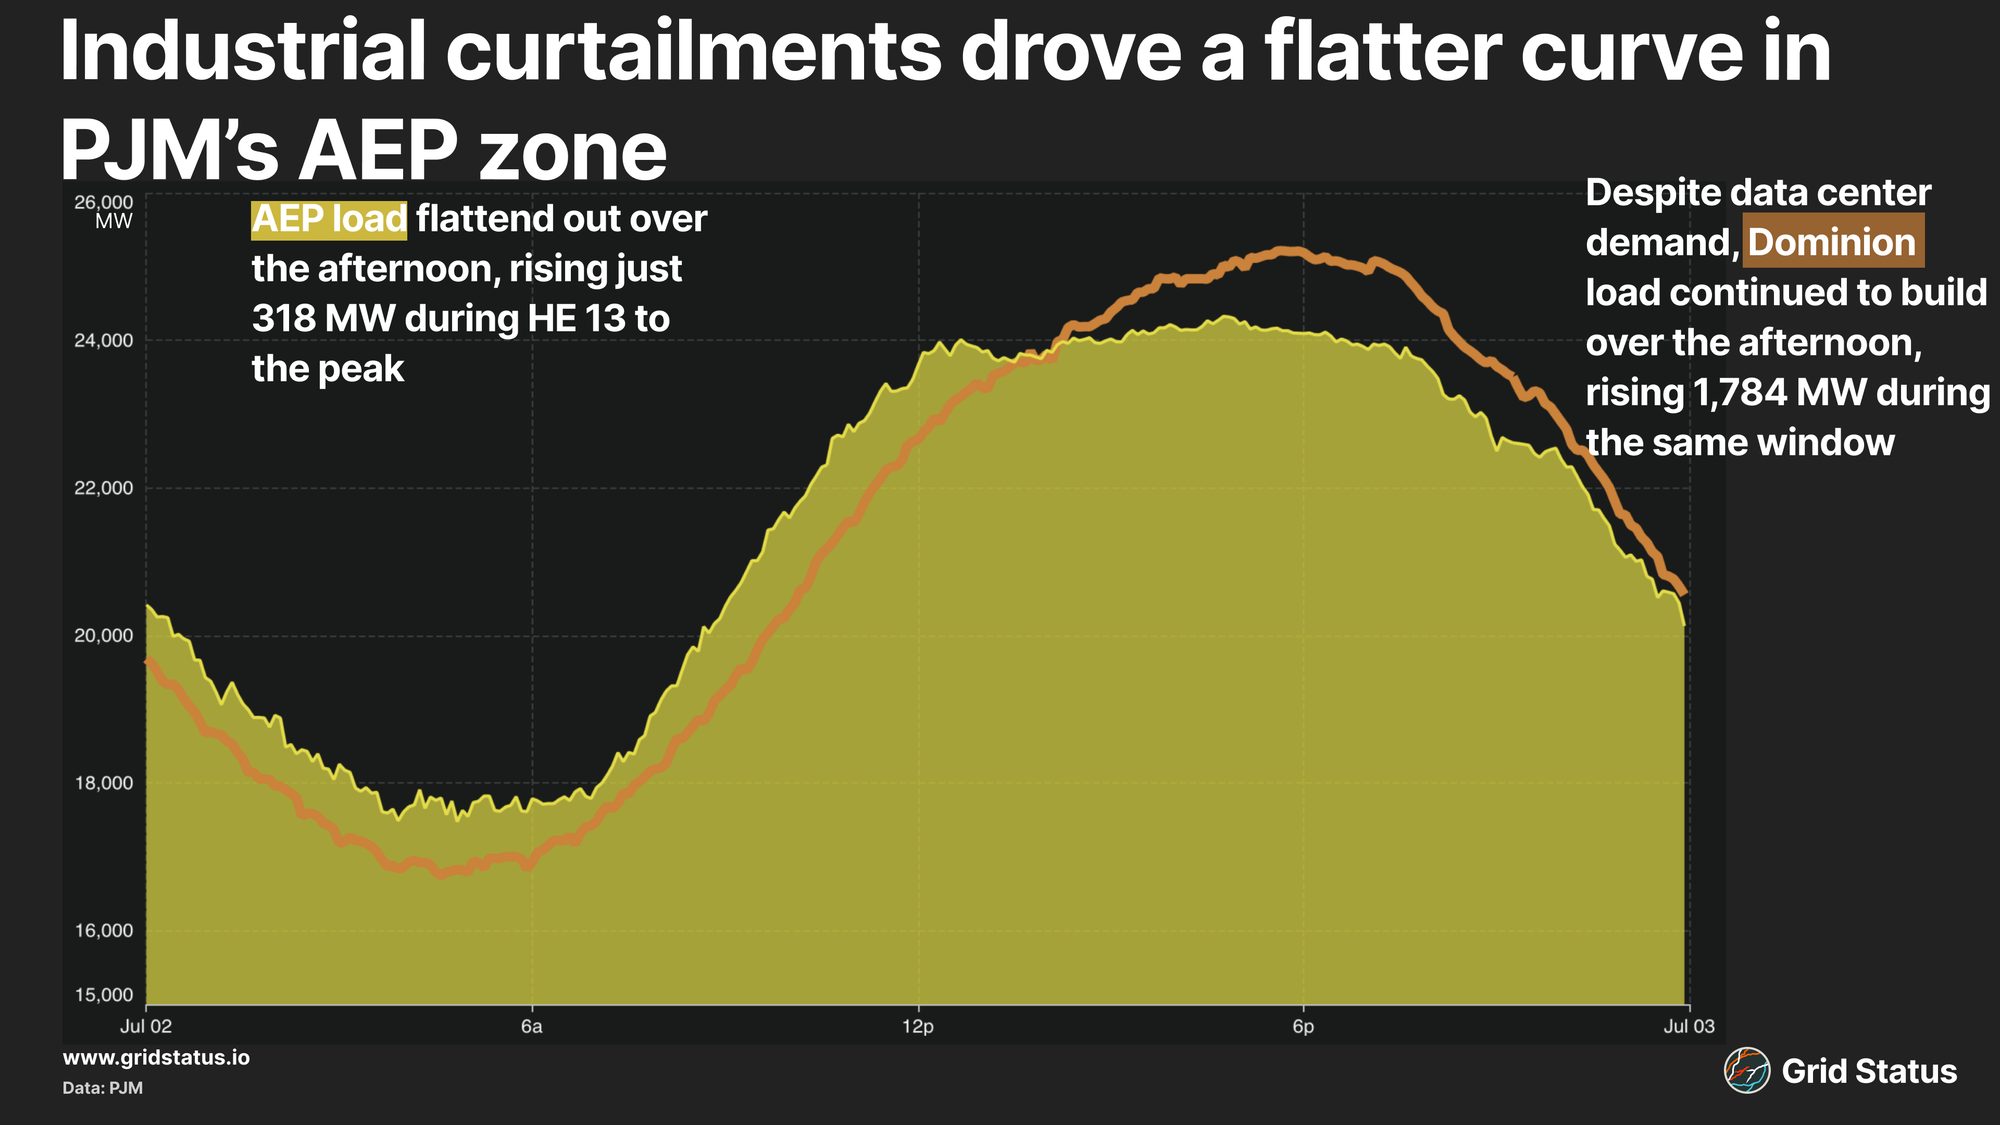
These voluntary reductions helped to flatten the peak, with load only rising 318 MW over the afternoon, reflecting a scant 1% increase over peak cooling load hours. This behavior was not seen in other regions of PJM, even those which, like AEP, are also home to large concentrations of data centers.
Over the same time period, DOM saw load continue to increase, reflecting the impact of cooling demand across both its residential and commercial customers. While load only rose 318 MW in AEP; Dominion saw a 1,784 MW increase in demand, a 7% increase. Not only did load in DOM continue to rise over the afternoon, but the zone also peaked nearly an hour later than AEP, despite it being further to the East.
Beyond the impact of voluntary load curtailments due to 5CP exposure, demand response (DR) was activated multiple times during the event.
PJM estimated that 6,113 MW of DR was activated on July 2nd, as well as an additional 5,037 MW on July 3rd. Without these activations, PJM estimates that it would have smashed its longstanding demand record, hitting 168,158 MW during HE 18 on July 2nd.
Even with DR activations reducing load, energy price volatility was seen across much of the heat wave. During the start of the heat wave, real-time energy prices during the daytime often underperformed day-ahead energy price clears.
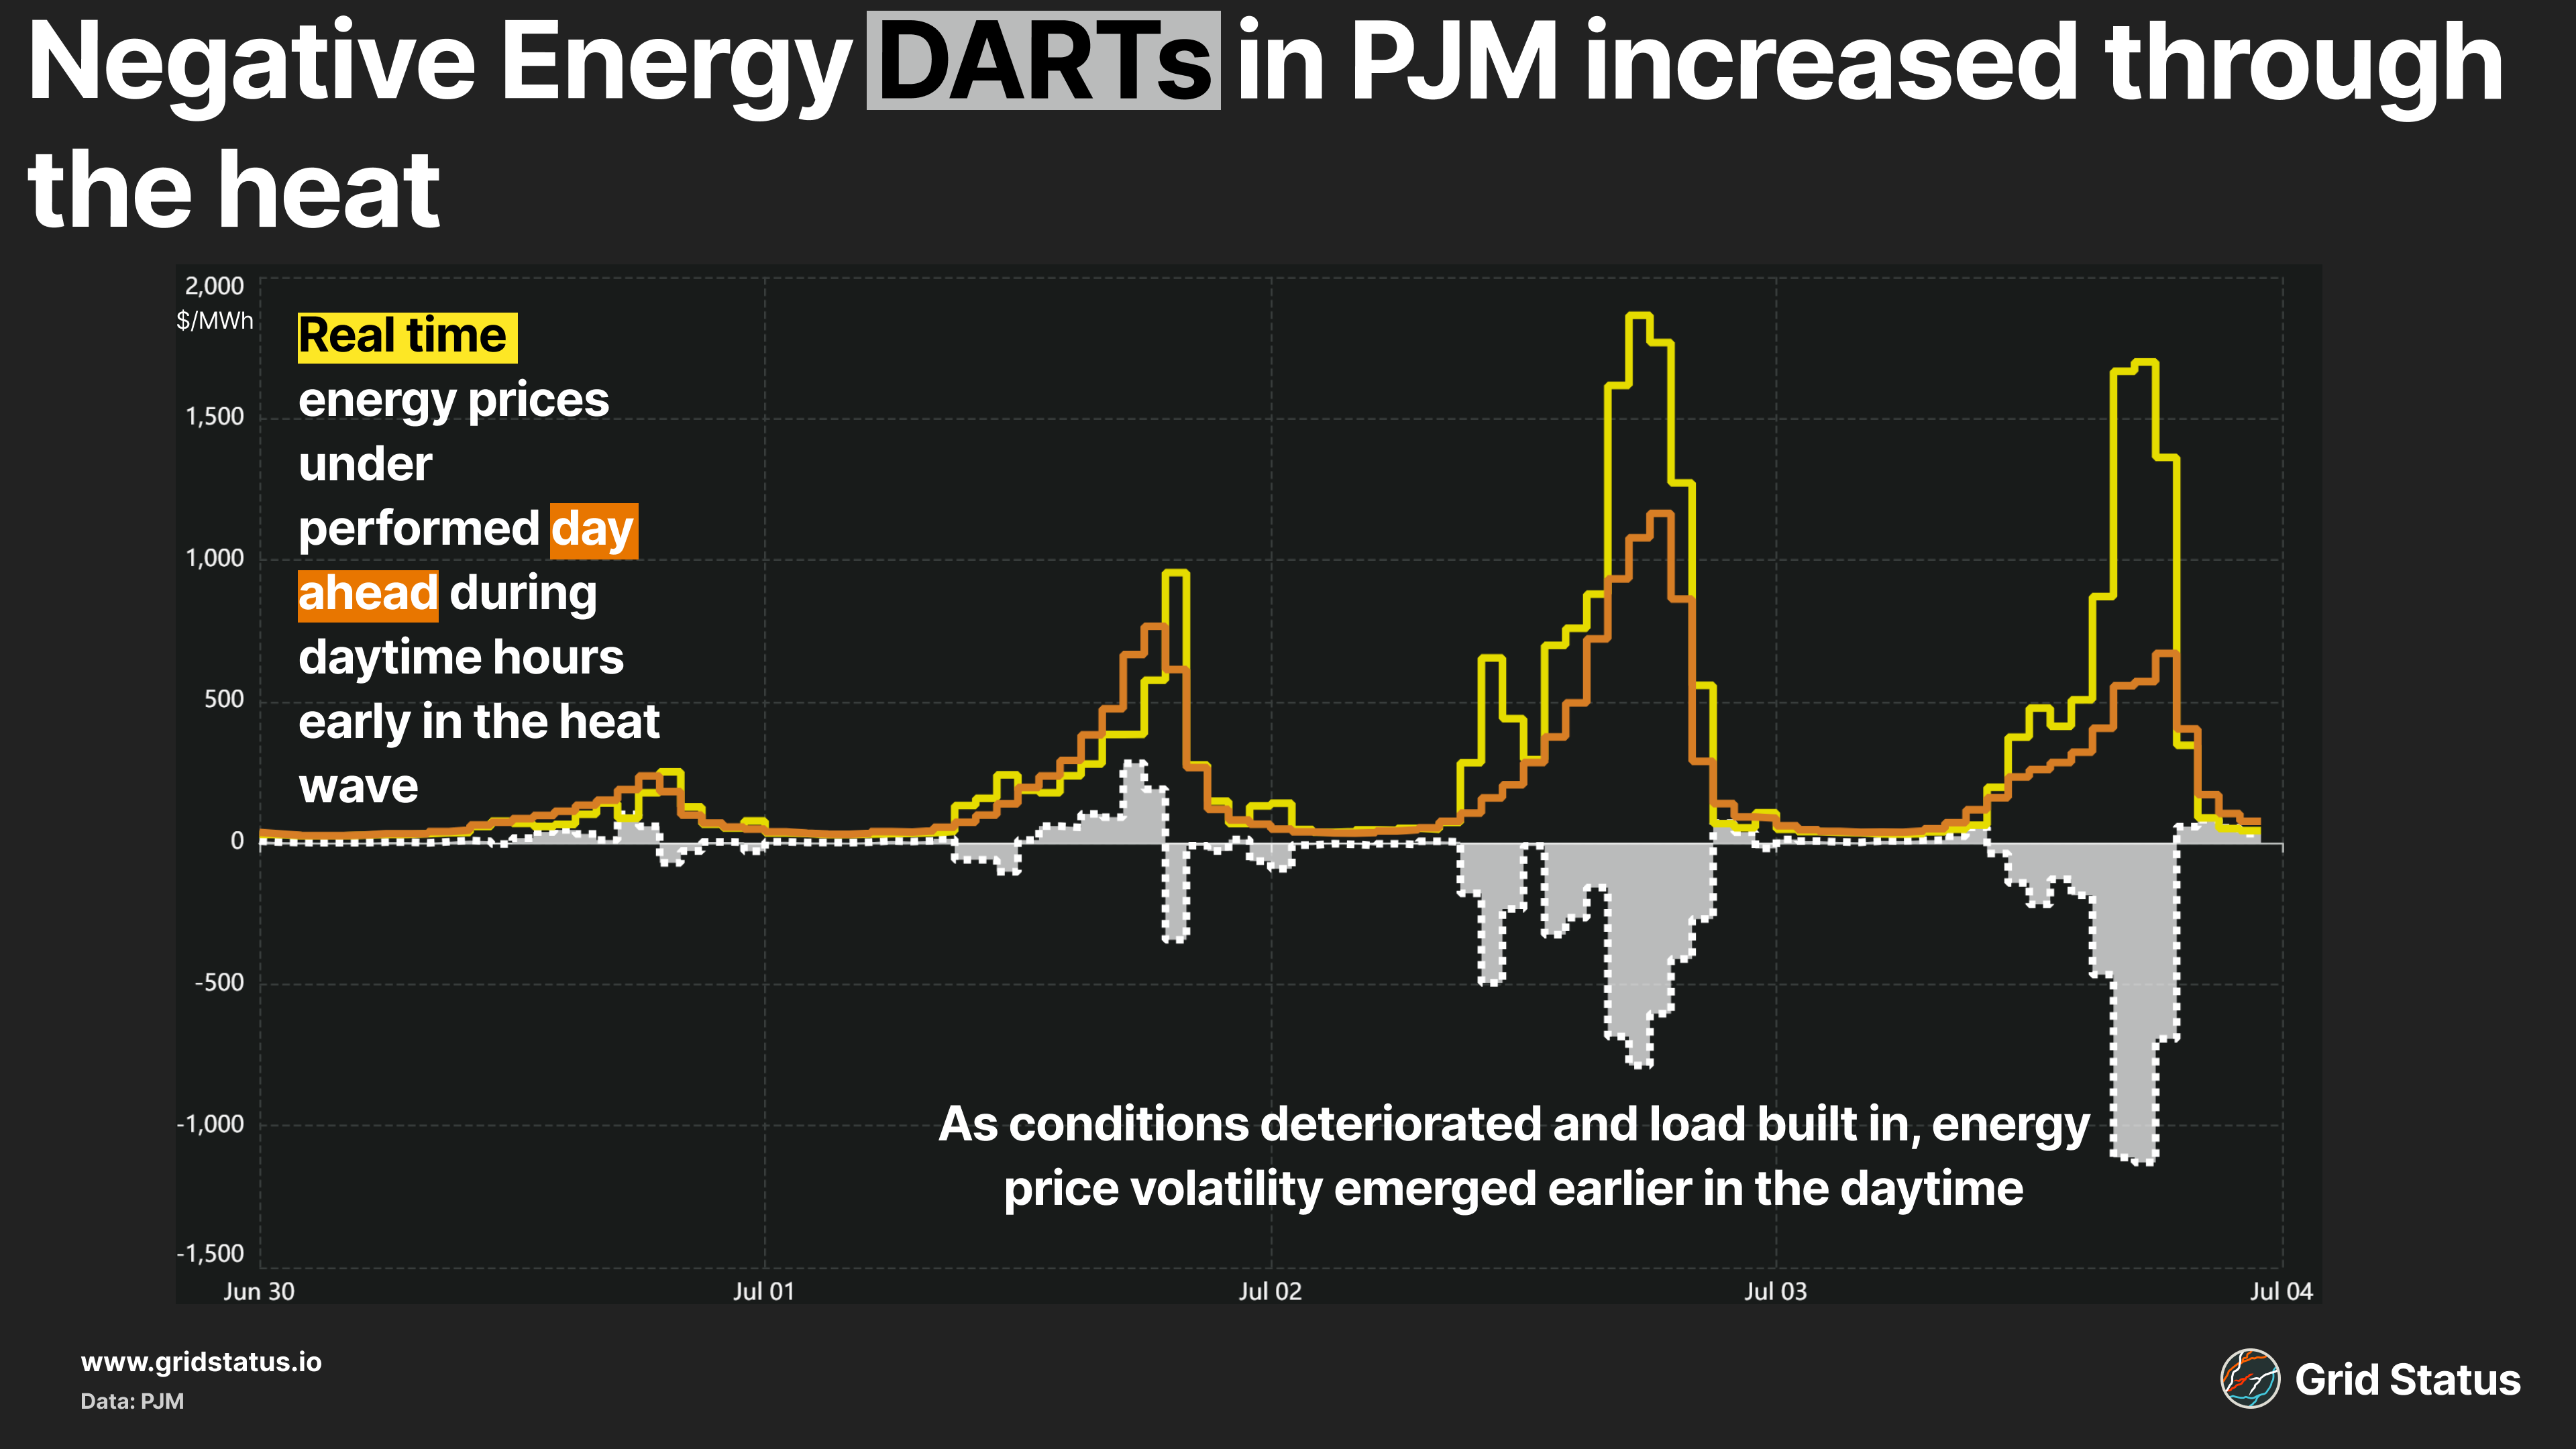
As the heat wave continued, and as more of the I-95 corridor experienced high heat and humidity, volatility emerged earlier in the day, not just limited to the net load peak.
A Slow Revolution in New England
As heat indices pushed into triple digits across New England leading up to the 250th, the grid turned to a historic fuel, albeit one no longer sourced from whales: oil.
Summer heat waves like the one seen at the start of July typically result in the return of oil to the New England supply stack. While oil generation in the Northeast spikes during the winter, driven by heating demand and pipeline capacity constraints, oil generation in the summer is often simply a matter of meeting peak demand.
New England, for the time being, remains a summer-peaking region, with peak load often occurring on the last day of a prolonged hot and humid weather event. While the region anticipates an eventual transition to winter-peaking as a result of heating electrification, it's expected to remain summer-peaking through at least the mid-2030s.
While oil did return to the supply stack this year, overall burn was down year over year.
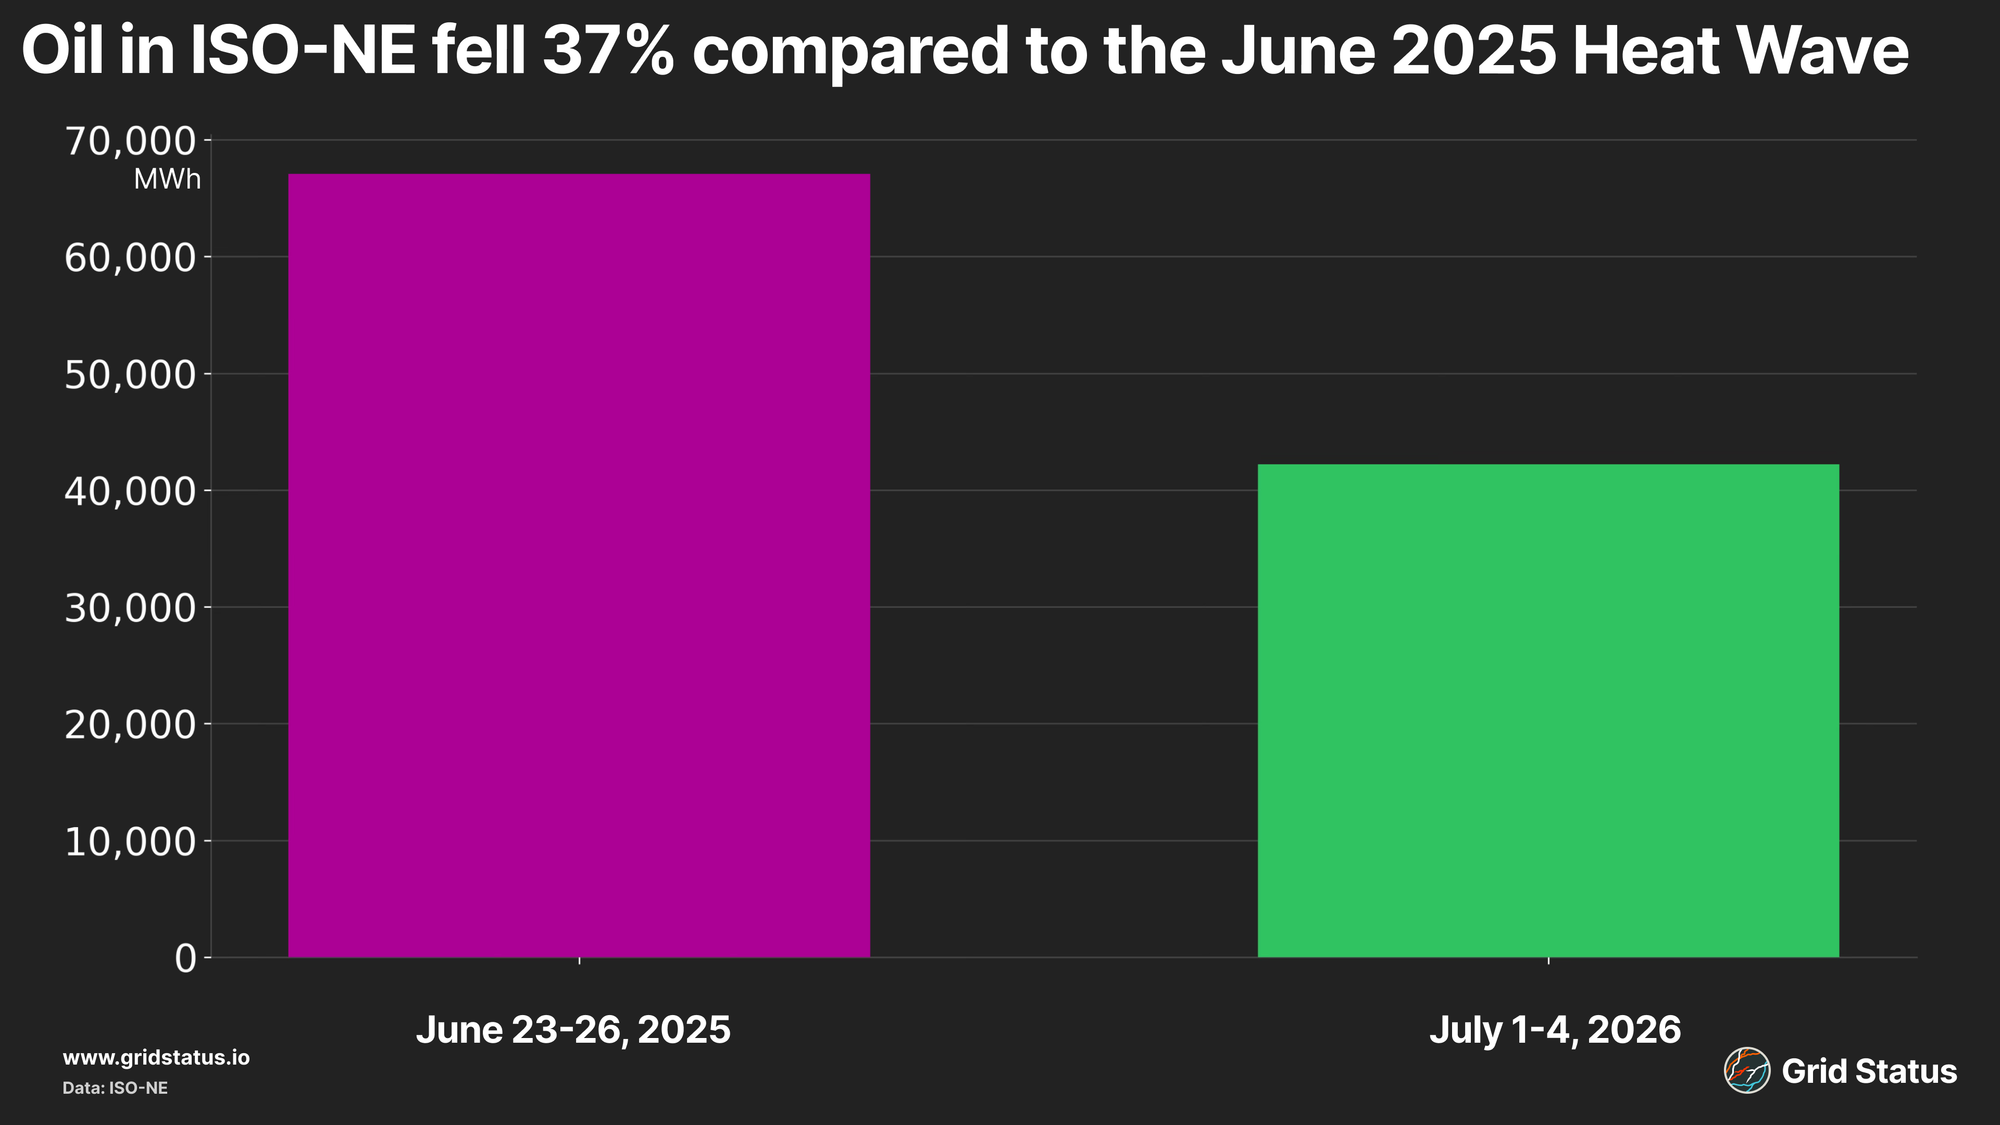
During last year’s heat wave, total oil generation was 67,072 MWh, whereas this year, oil generation was 42,202 MWh, down nearly 25,000 MWh.
Not only was the total oil burn weaker, but the fuel’s aggregate output had a different shape compared to the prior year’s heat wave.
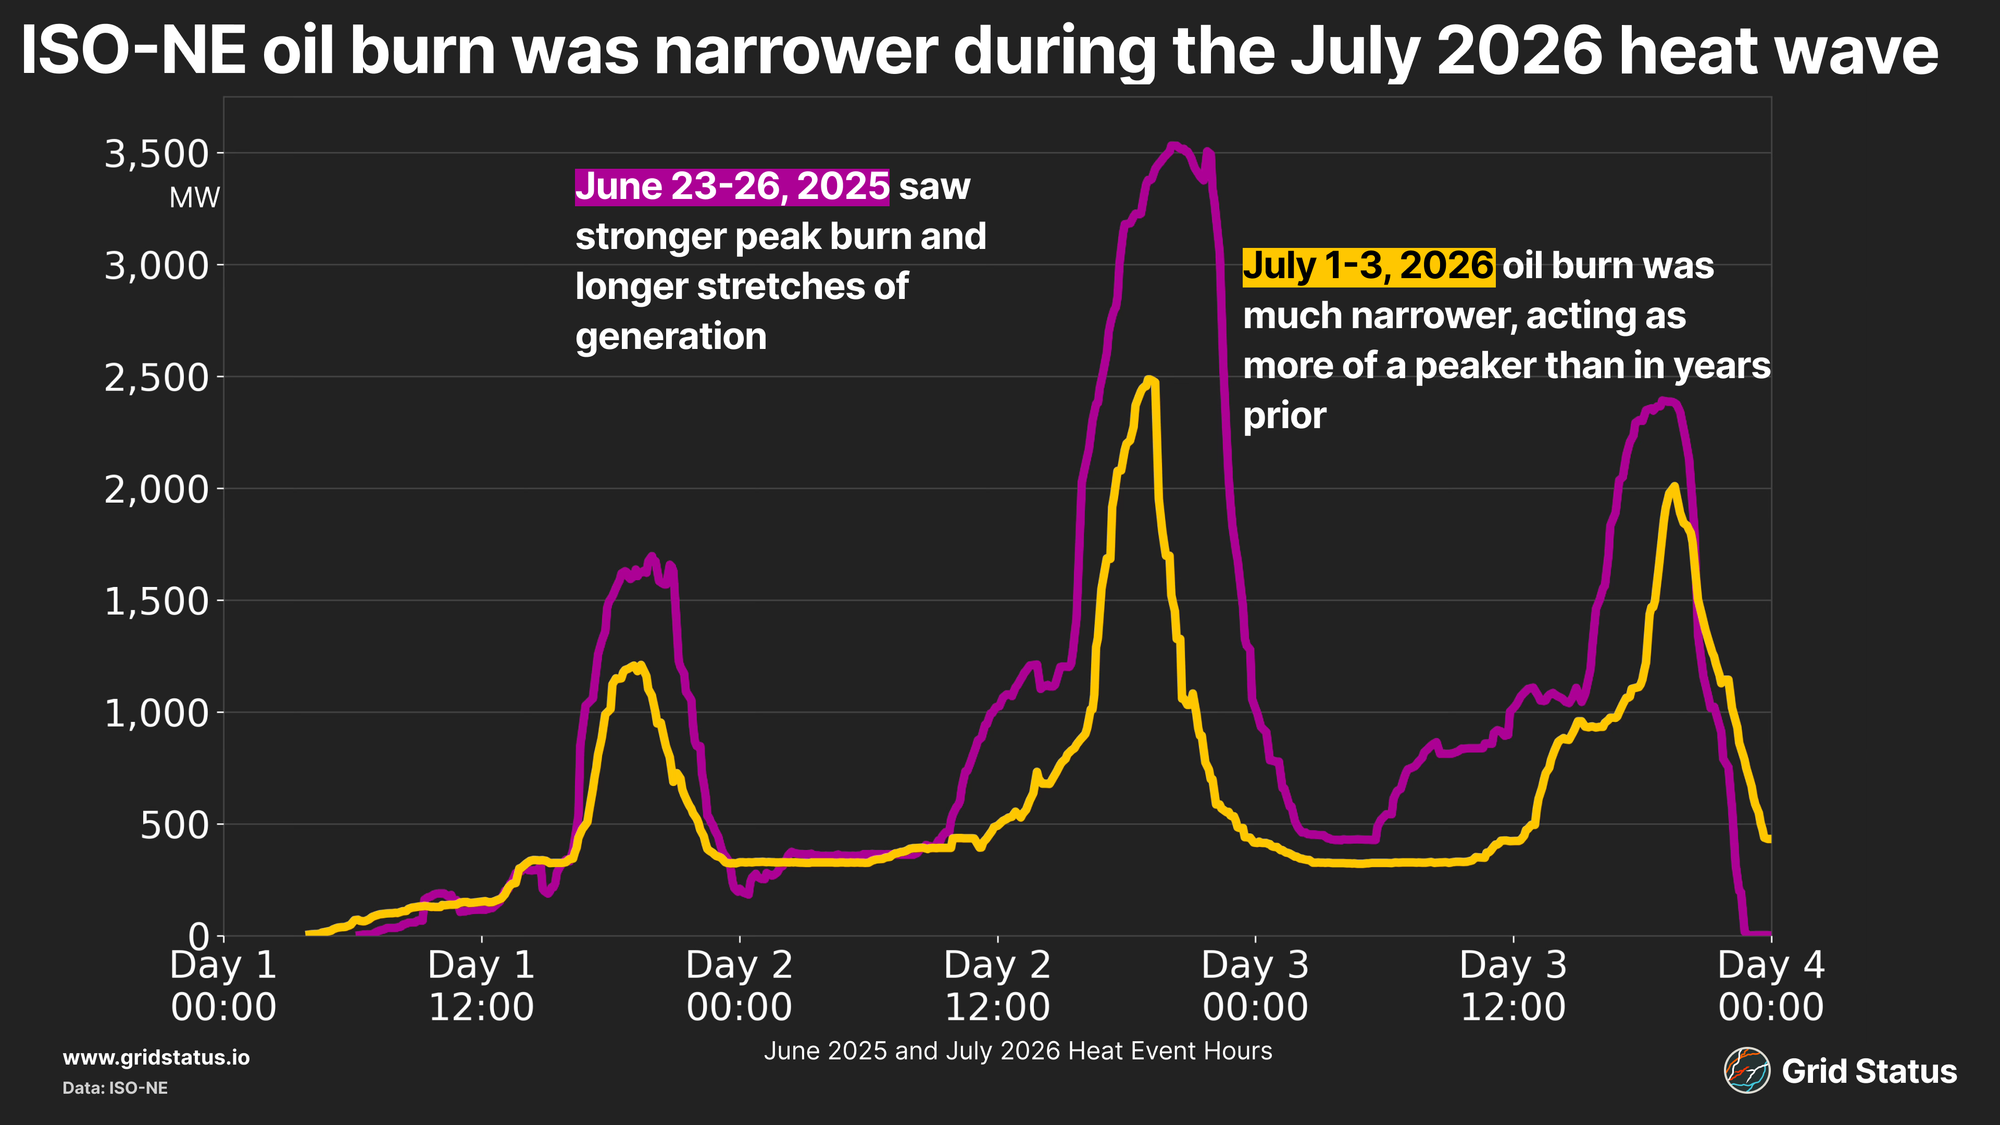
Oil burn had a much narrower shape in 2026, peaking and then declining without sustaining high output. New resources, as well as slightly weaker demand, helped to reduce the need for afternoon oil burn, allowing the fuel to act more as a peaker over the evening.
Did oil pricing (and recent global economics) impact the high LMPs across the eastern seaboard? As the Boston Harbor continued to heat up prior to the 4th, we saw oil set the price during the morning ramp-up and during the late evening when battery discharge fell off.
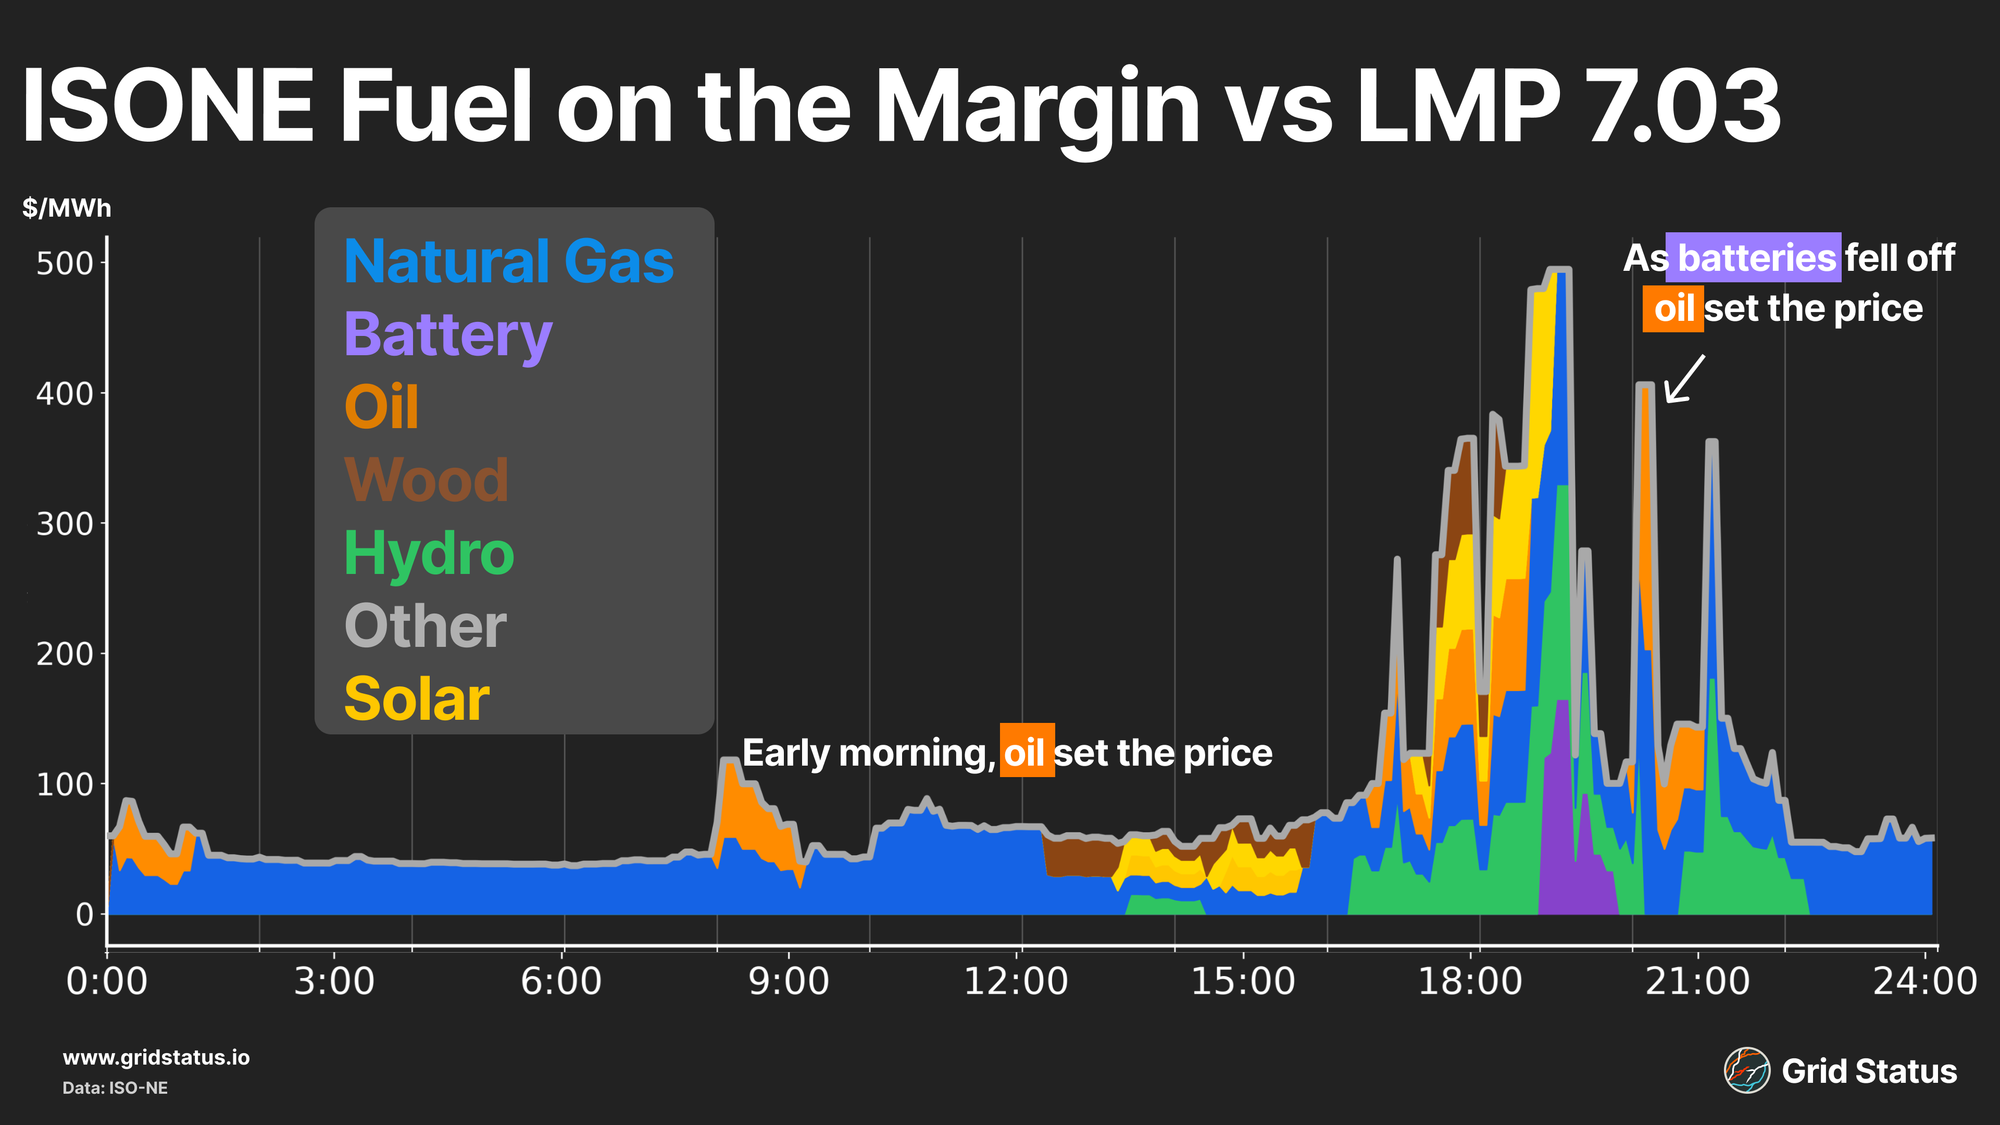
While oil was a contributing factor to these high prices, it didn’t act alone; both battery storage and hydro set similar real-time spikes as the grid needed generation. During the evening peak, ISO-NE, America’s least congested grid, was also experiencing enough localized constraints to regularly have multiple fuel types on the margin.
Winds of Change
While often touted for its higher capacity factor during the winter, offshore wind appears to have helped reduce overall oil burn during this latest heat wave. Throughout the event, winds offshore were particularly strong, helping to bring needed generation into Southern New England, which saw disproportionate levels of cooling load.
Wind generation tended to be strongest during the afternoon and evening, coinciding with both the strongest cooling load and the region’s most delicate time, where BTM solar generation drops. During this recent heat wave, wind in ISO-NE generated ~57 GWh, a 78% increase compared to last June.
Offshore wind played a role in meeting peak demand, and the region has more on the way, although slower than anticipated, as Vineyard Wind has struggled to commission existing turbines and Revolution is not fully operational; the estimated ~500 MW of active capacity helped to drive stronger generation compared to last year’s heat wave. Across the entire event, wind generation failed to dip below 400 MW, a level which roughly represents output from Vineyard Wind alone.
Regional offshore strength was confirmed in a LinkedIn post from Orsted’s VP of Generation (Americas), the operator of NYISO’s South Fork Offshore Wind project. According to the post, “From July 1-4, South Fork Wind delivered nearly 10 gigawatt-hours of locally produced power to Long Island’s grid.” and that, “the nation’s first utility-scale offshore wind farm achieved a 74.7% capacity factor — including nearly 90% on July 2.”
Flows Downeast
Beyond the increase in wind generation, the New England Clean Energy Connect helped to bring additional power into the region. Comparing a 72-hour period across both events, overall flows from HQ into New England were stronger than the June 2025 heat wave across most hours.
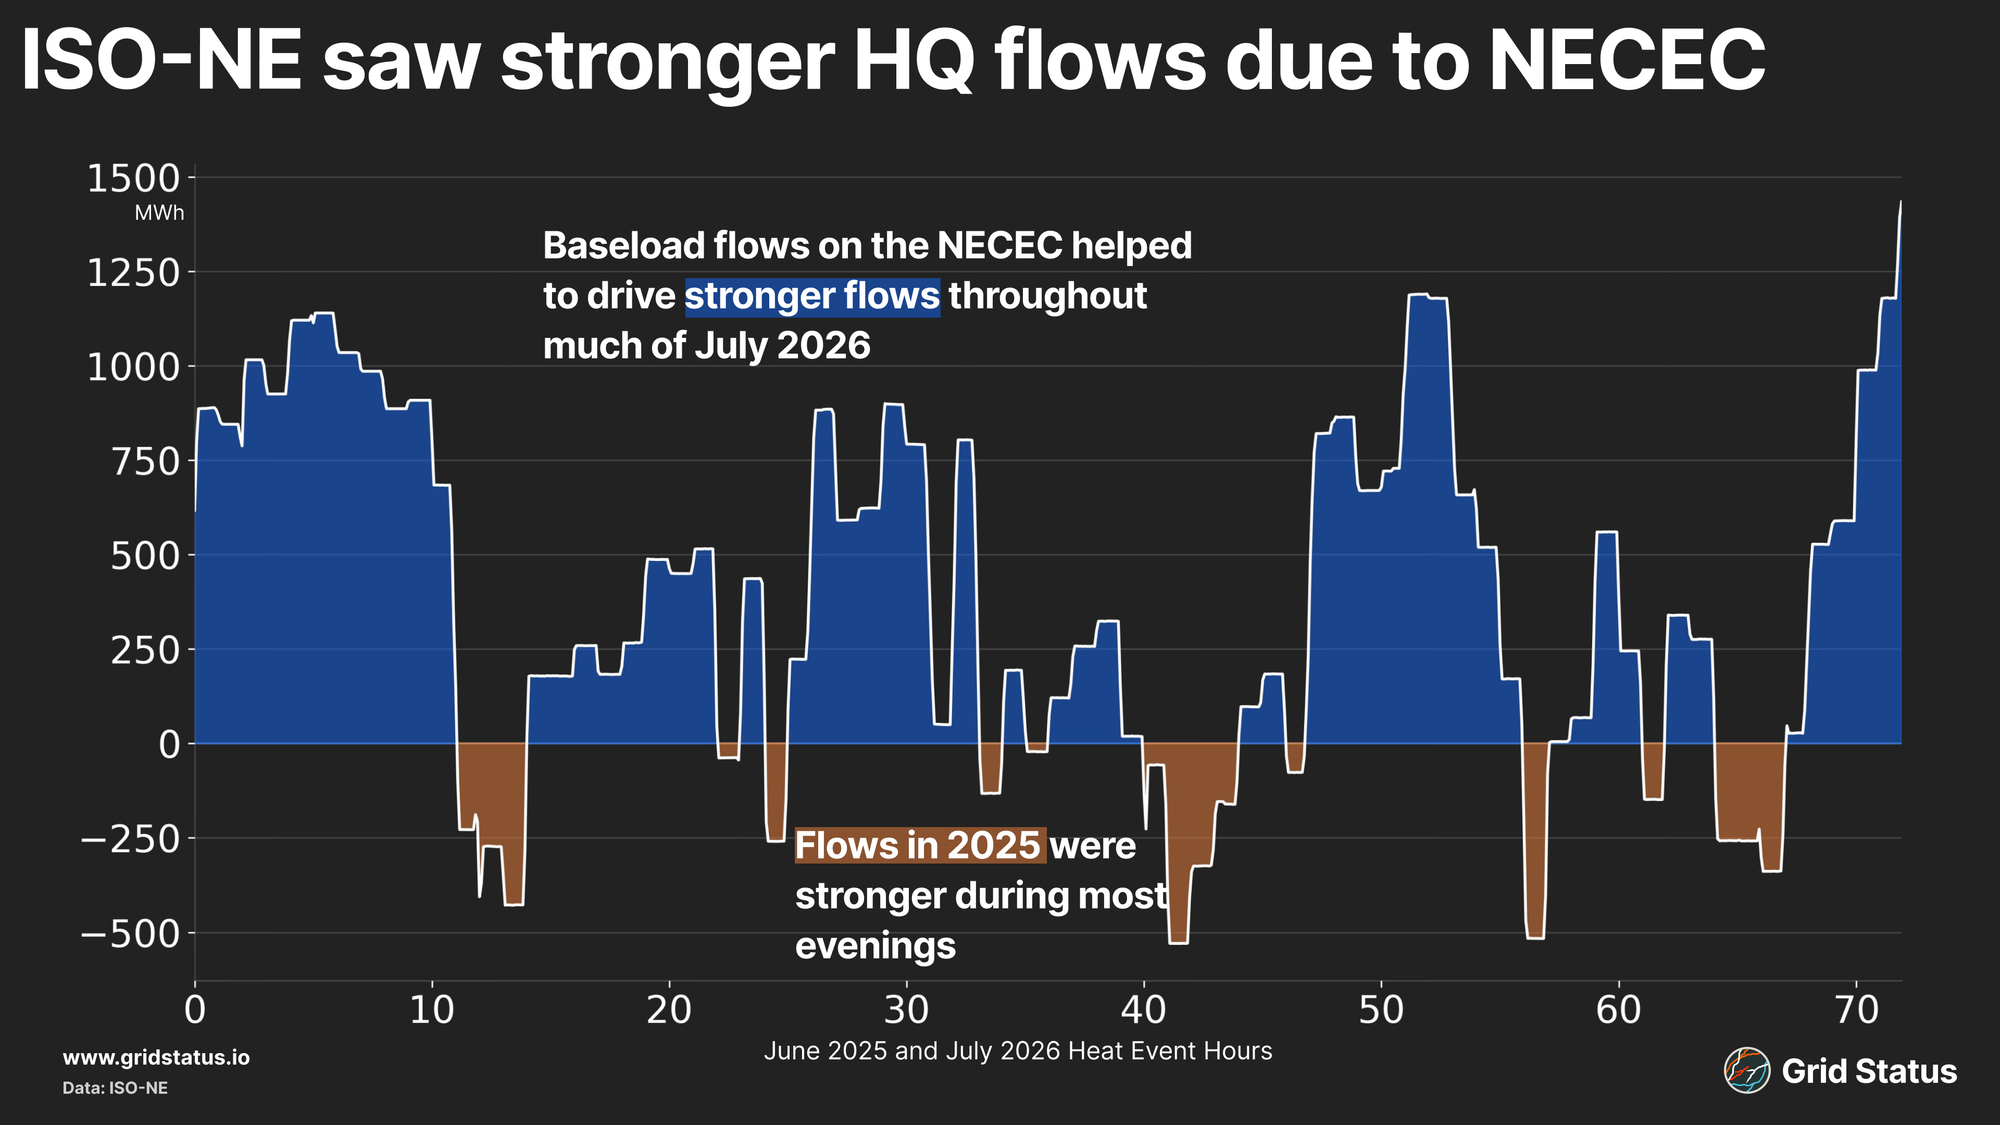
Total flows into New England increased by ~27 GWh compared to last June’s heat wave, but this was entirely due to flows on the NECEC, which offset declines on older ties. Year-over-year, flows on Highgate dropped -5,773 MWh, and notably, Phase II flows dropped by 45 GWh.
An unintended consequence of the drop in flows on Phase II was the increase in negative congestion in .Z.MAINE. Phase II injects at the Sandy Pond converter station, located around 30 miles, as the crow flies, from the region’s largest load center, Boston. On the other hand, NECEC injects in Lewiston, Maine, located nearly 130 miles away and near additional generating resources like Seabrook.
Injecting in Maine, paired with nearby wind generation as well as other thermals, combined with the clear load gradient between Maine and the rest of New England, kept pressure on what has become the most common congestion pattern in New England, the ME:NH interface.
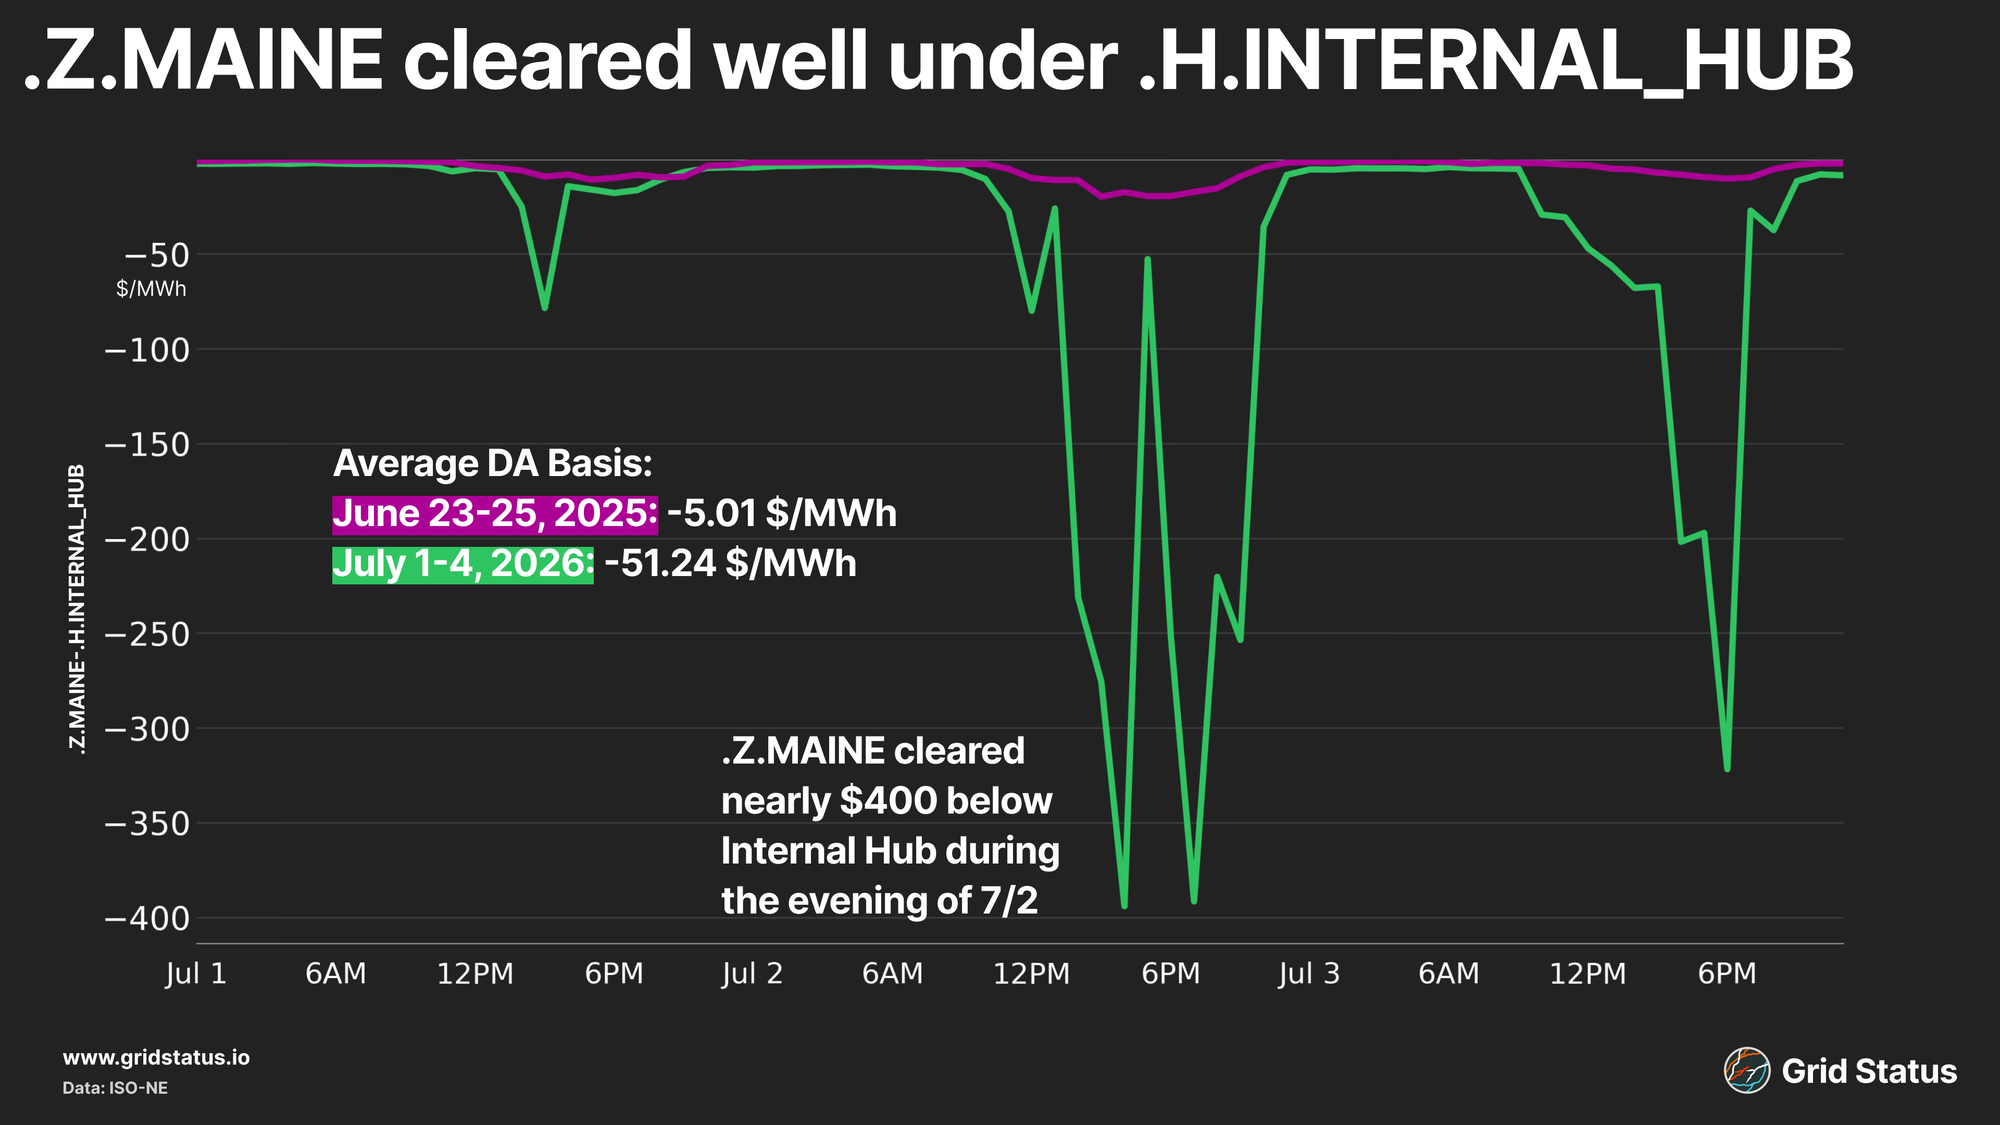
This increase in flows from Maine into the rest of the region drove a wide DA basis, with .Z.MAINE seeing hundreds of dollars of downside over most of the peaks, compared to next to no downside throughout much of last year’s heat wave.
Concrete Jungle Where Heat is Made of
The July heat wave exemplified the challenges facing New York’s grid amidst a stalling energy transition.
Heat indices across downstate New York, and importantly in New York City proper, pushed well over 110 degrees across most afternoons. This alone would drive increased cooling load levels, but the concentration of heat in New York City specifically amplified demand.
New York City load increased throughout the event due in part to the impact of the urban heat island effect. During the daytime, structures heat up after repeated exposure to sunlight, and interiors retain humidity. Structures then hold onto this heat and radiate it back overnight, keeping pressure on cooling load both after sunset and through the daytime.
Despite high levels of load, neither NYISO nor ISO-NE set new records, even with BTM solar added back into total demand for each system.
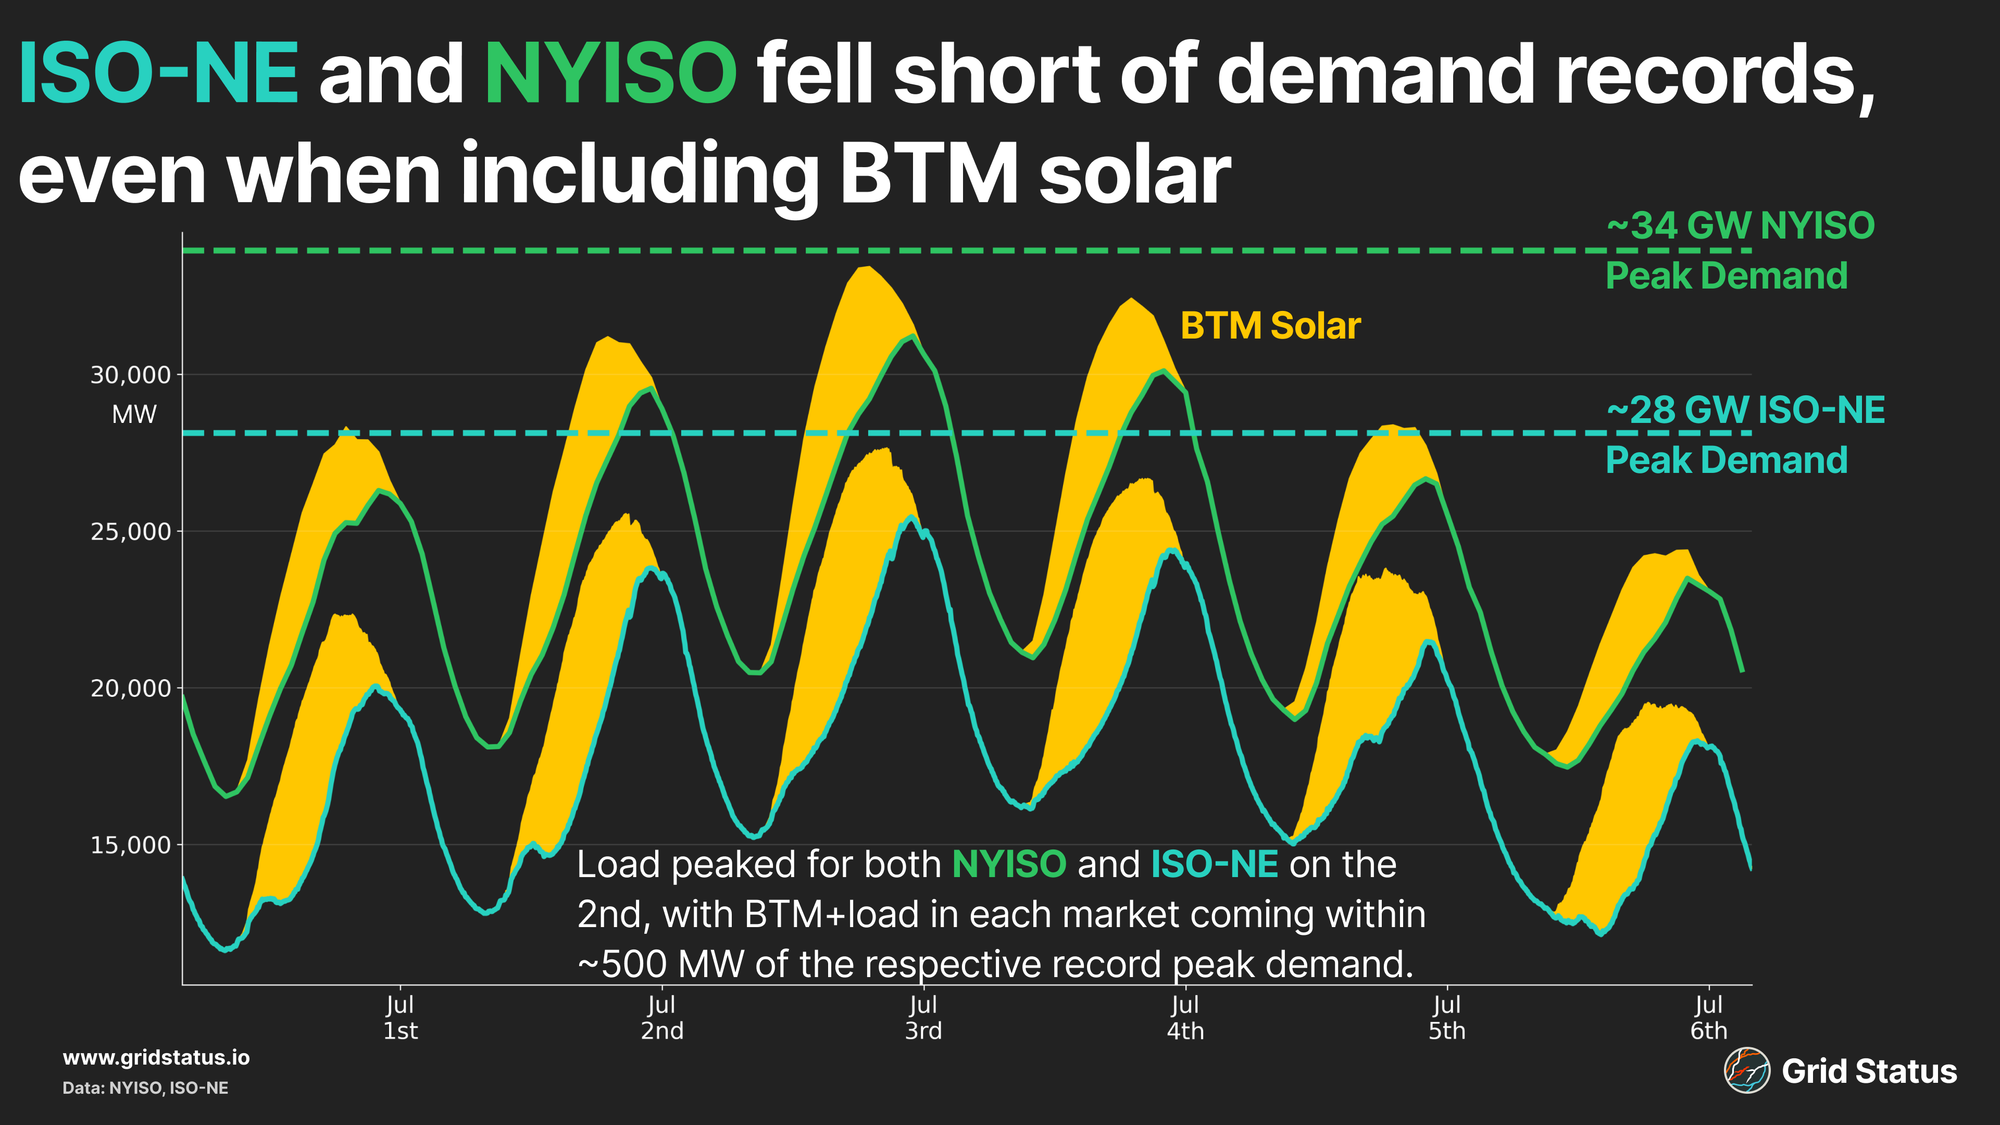
While neither broke their longstanding record, each came within ~500 MW of the all-time peak on Thursday, July 2nd, once BTM solar is accounted for.
Throughout the event, downstate New York saw disproportionate upside, largely due to grid congestion. Downstate is home to the majority of the region’s population as well as load, but is further away from the state's generating capacity. This was visible in the increased basis seen between downstate and other regions, such as Capital.
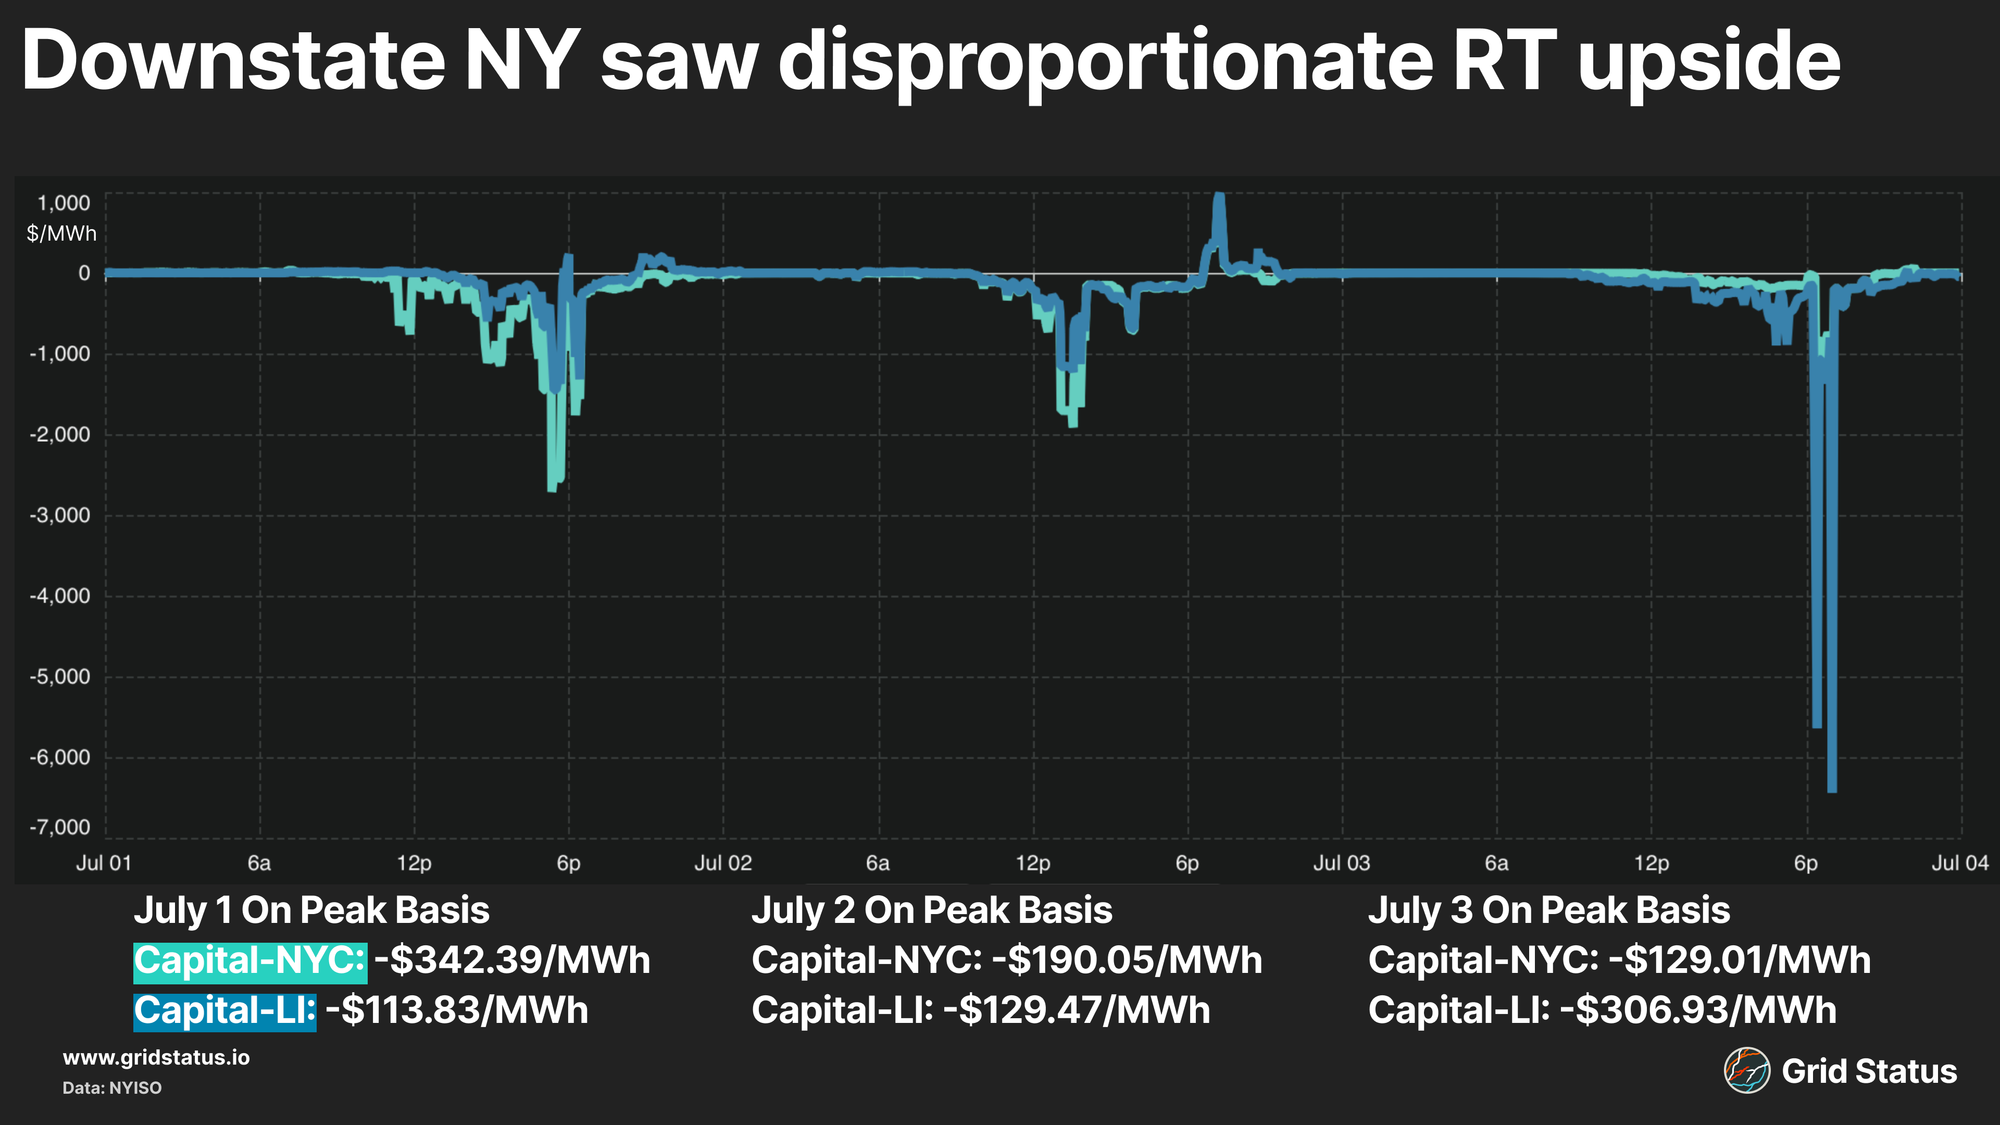
Throughout the real-time, both NYC and Long Island came in well above Capital as localized congestion kept both regions propped up above upstate New York, often spiking to well over $1,000/MWh of basis. Additionally, downstate saw upside due to thunderstorm alert activations that reduced the capacity of already overloaded transmission lines, helping drive $6,000+ spreads over the evening on 7/3.
Despite downstate NY’s increased percentage of load during the second half of the week, we actually saw the basis tighten on 7/2 and 7/3, which looks to be driven by an increase in generation, as well as the activation of flows on a new tie line with Quebec.
CHPE-ing Away at deficits
Similar to ISO-NE, oil generation can return to the supply stack in New York during the summer. One of the region’s quirks is that, unlike markets like New England and PJM that separate oil generation, NYISO lumps oil burn into dual fuel, which encompasses generators that can run on both natural gas and oil, and then the other fossil fuels category.
Despite this, we can see that compared to last summer’s heat wave, the oil burn captured in NYISO’s “other fossil fuels” category was up 10 GWh.
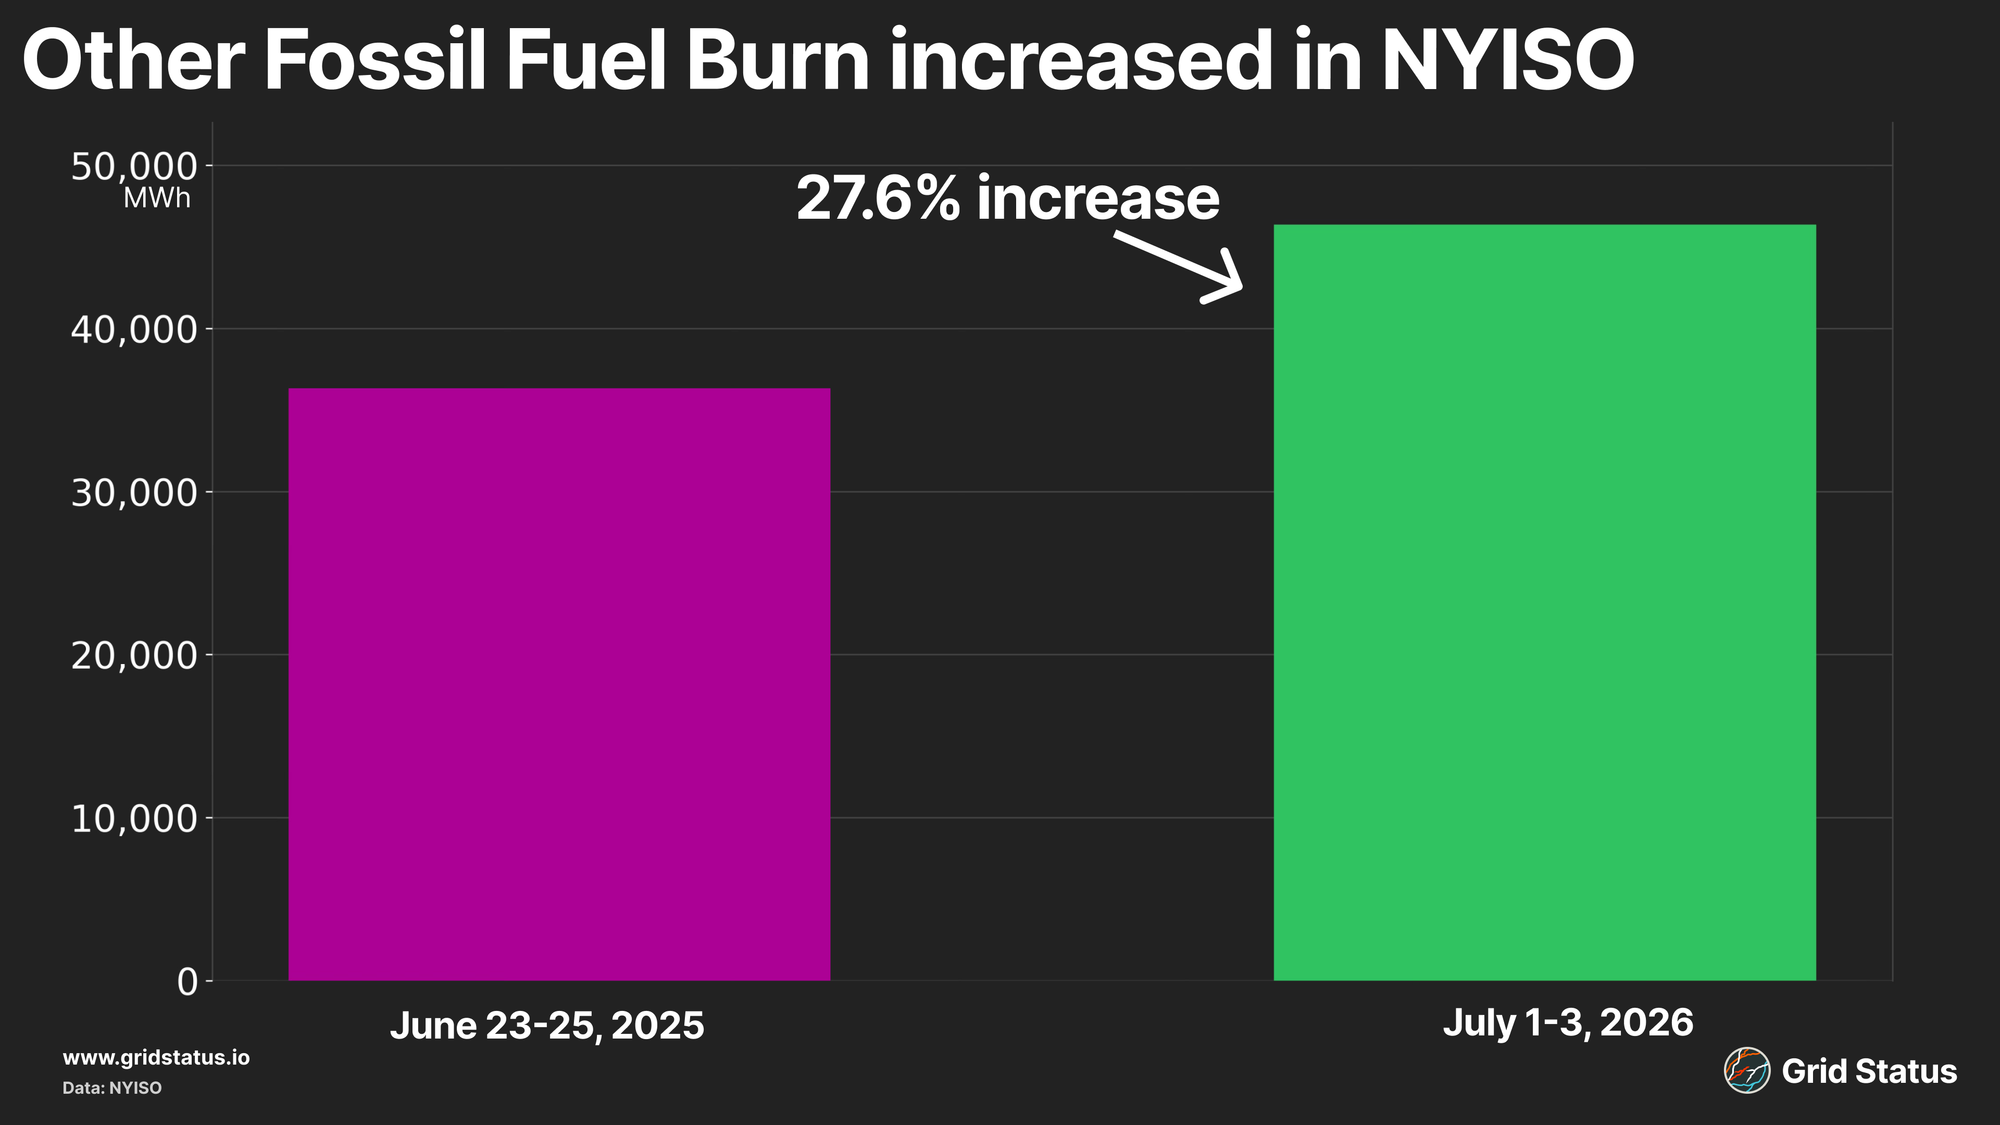
A sizeable portion of this capacity is found downstate, which, given the increase, helped to push back on congestion that was sending upside to both Zone J and K.
Stronger oil burn was not the only change that helped to reduce downstate congestion. Following months of testing, as well as sitting on the sidelines through much of June, which HQ claims was due to its inability to receive full contract value, the Champlain Hudson Power Express (CHPE) ramped up. This long-planned 1250 MW tie line between NYISO and Hydro-Québec was expected to enter commercial operations in June. Joining the two existing ties between HQ and NYISO, Cedars and Châteauguay, CHPE increased total transfer capacity between the two regions, but importantly, brought power into Zone J, interconnecting in Astoria.
Beyond the increase in clean power in a region that has struggled to decarbonize, the injection of power in New York City allowed for the line to avoid the bottlenecks that drove disproportionate Zone J upside, unlike Cedars and Chat, which inject into congested upstate and ultimately reach the Central-East bottleneck.
The start of flows on CHPE was not without challenges, however. Flows were seen over the evening of 6/30 and did not return on 7/1. This drop in flows was due to an outage on the Québécois side of the border, which left the line out of service through 7/1 and the first half of 7/2.
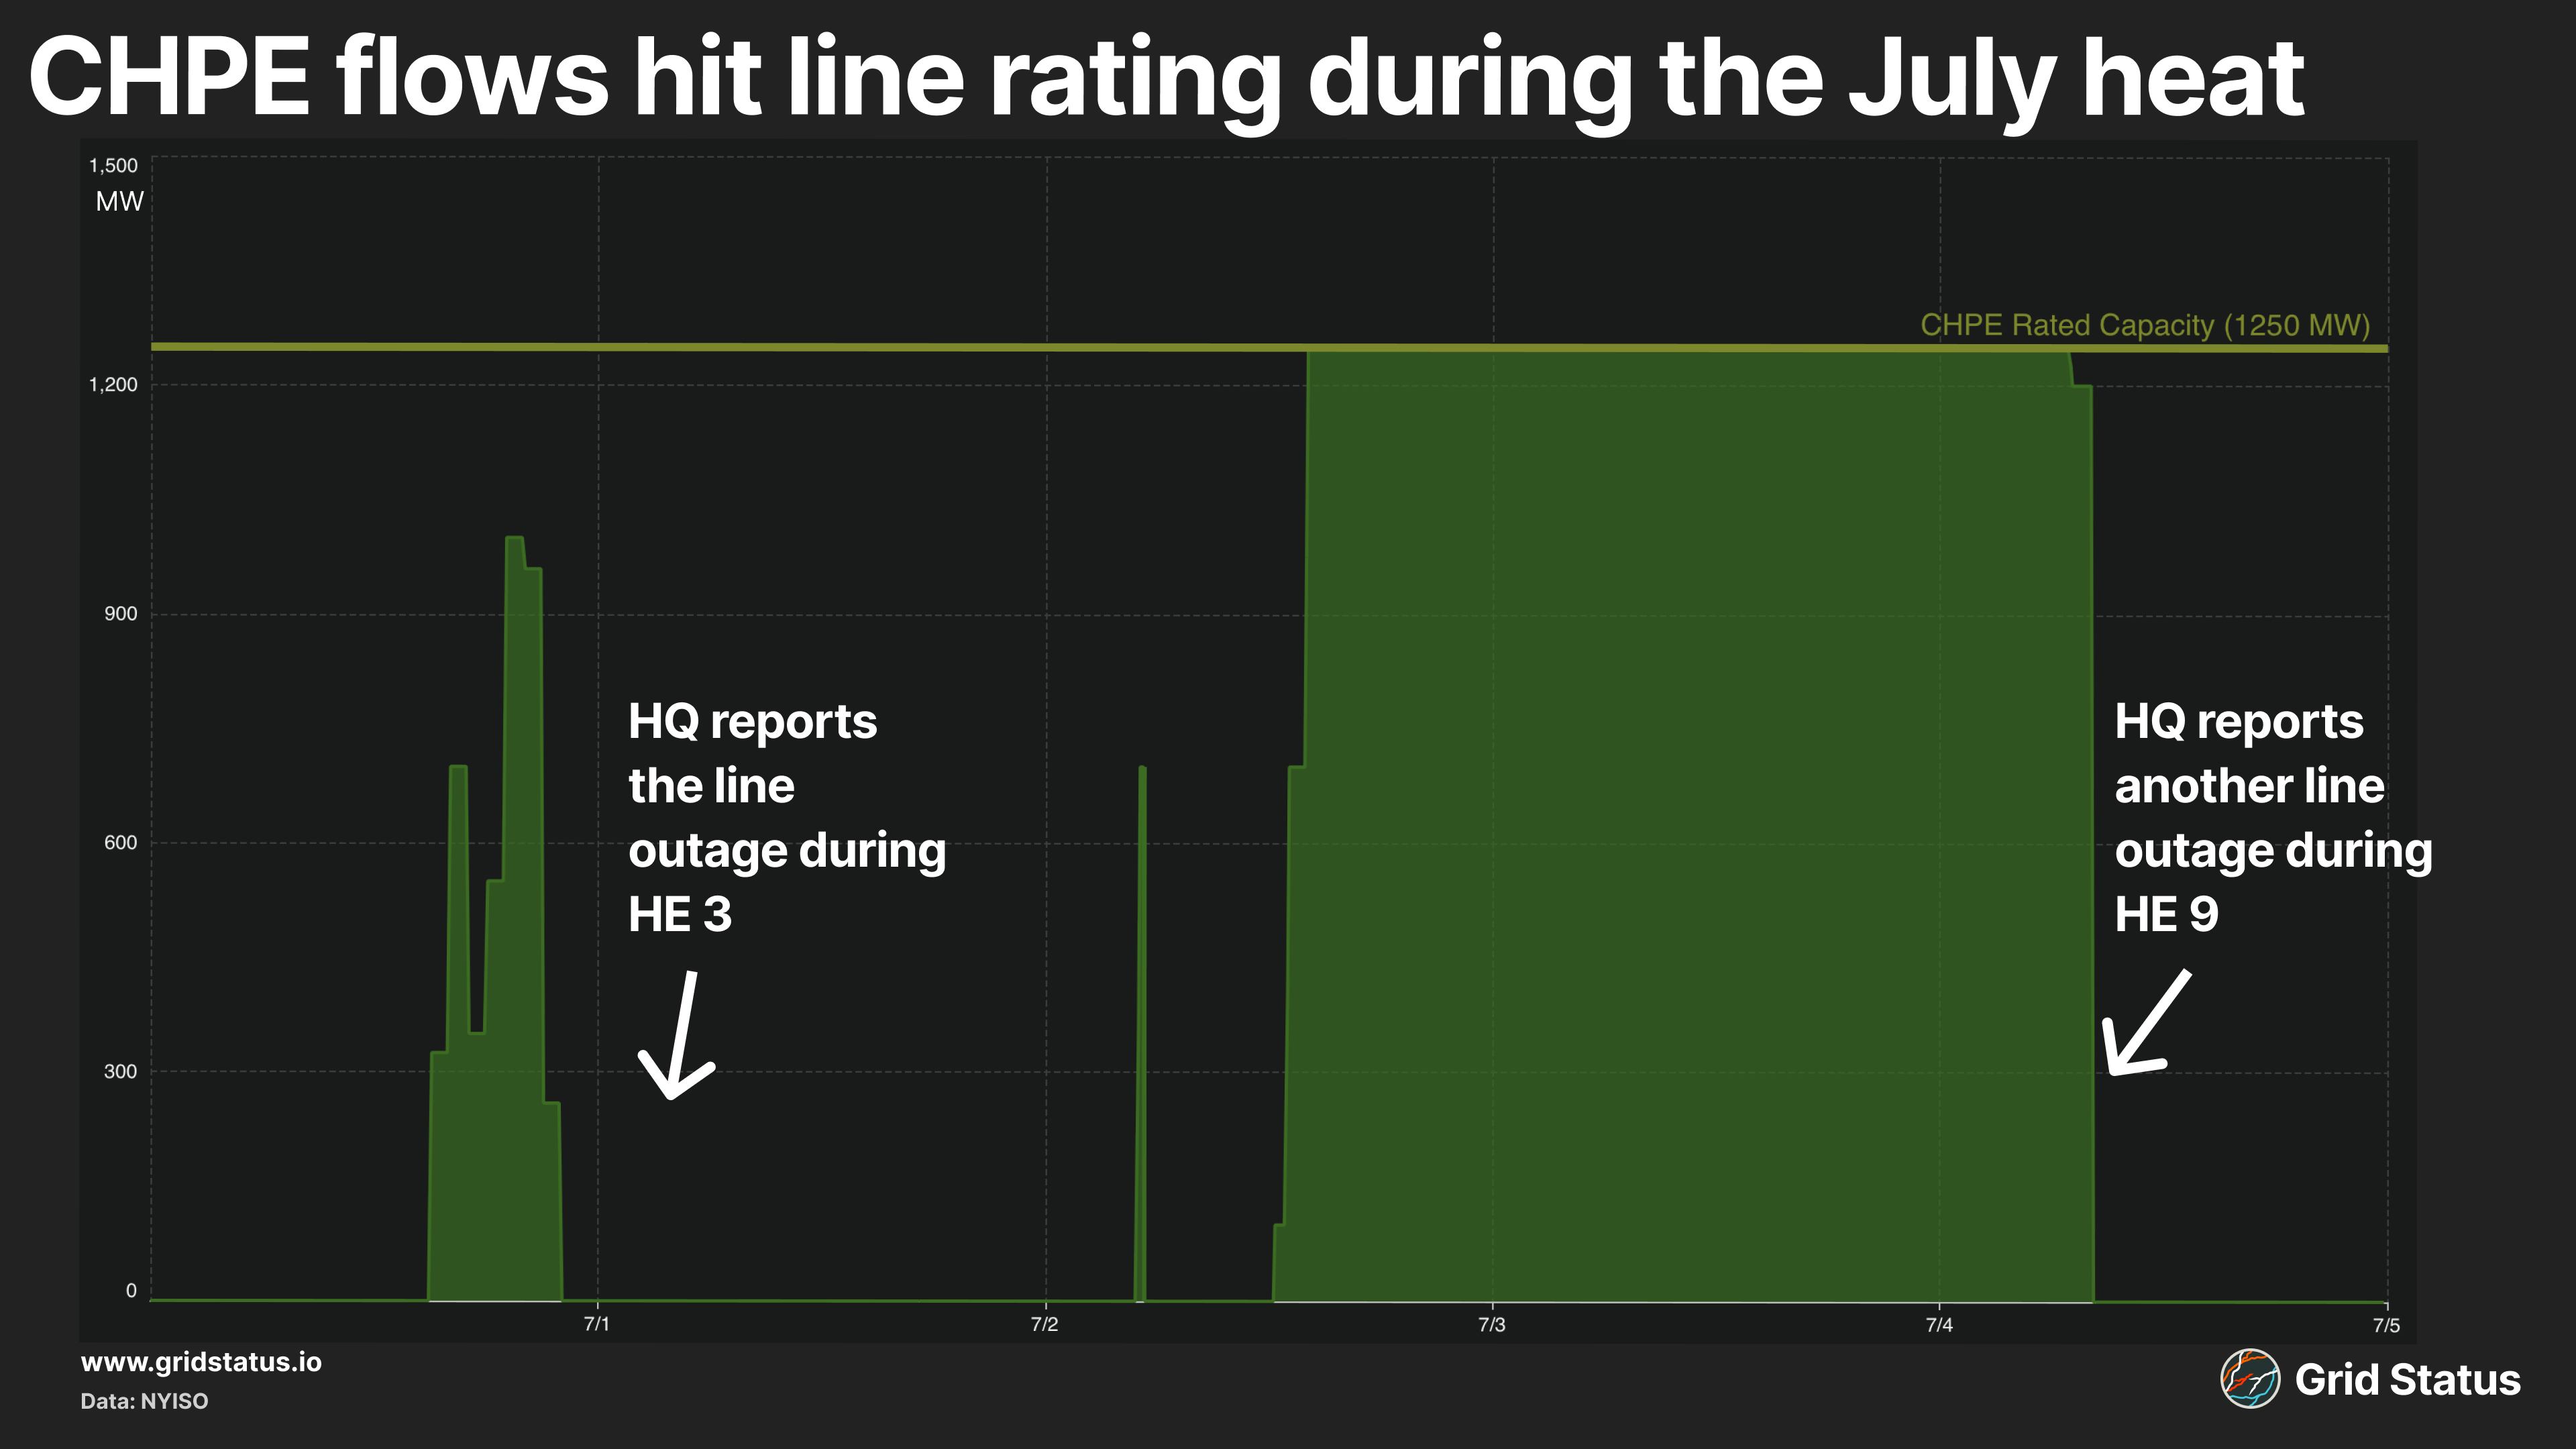
By HE 15 on 7/2, the line reached full output of 1250 MW and remained that way through July 4th, when the line began another unplanned outage. While the line was active, it was able to provide a sizeable portion of the city’s power needs during the worst of the event.
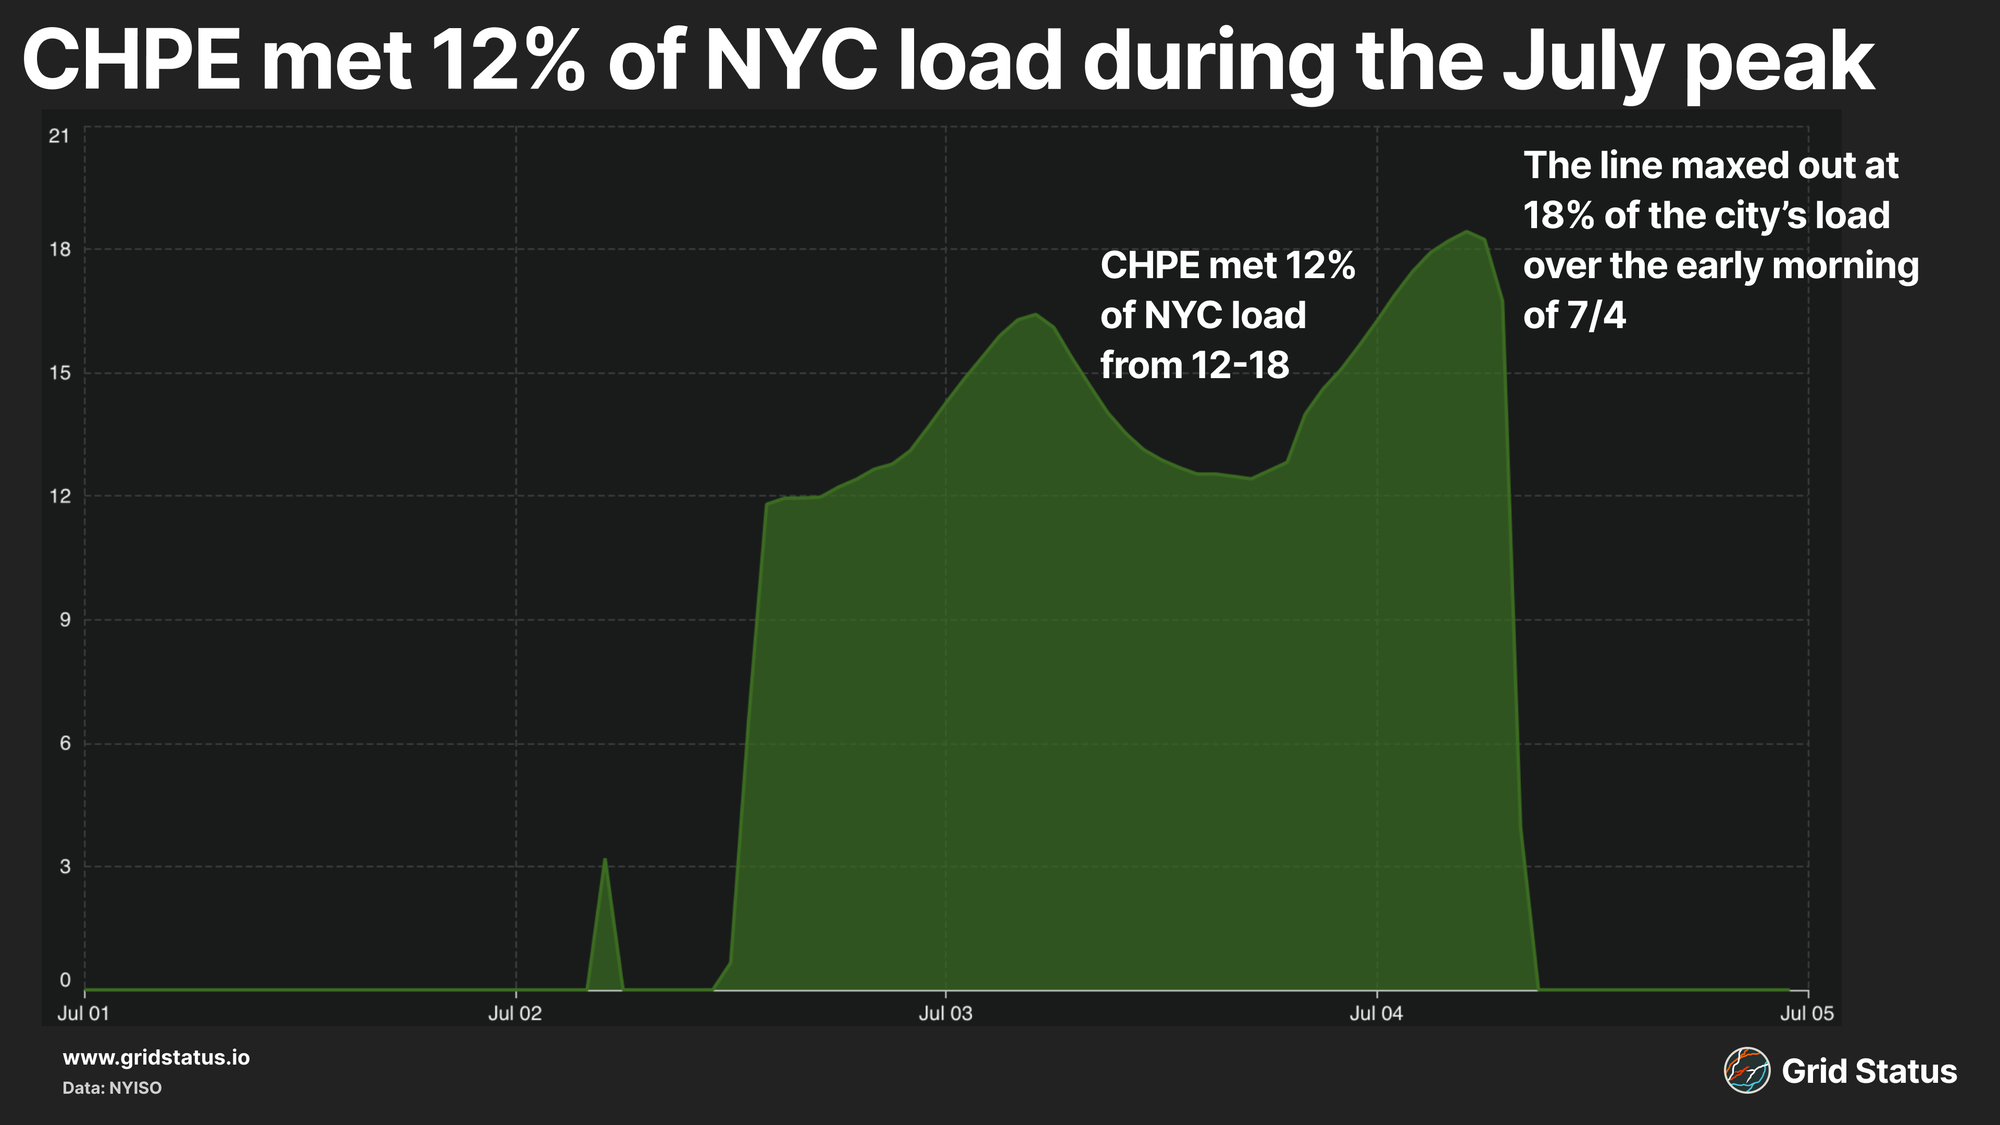
These flows into NYC, paired with the increase in oil generation, helped to reduce congestion downstate over the second half of the week.
Despite the energization of CHPE, net flows from HQ into NYISO were actually down year over year.
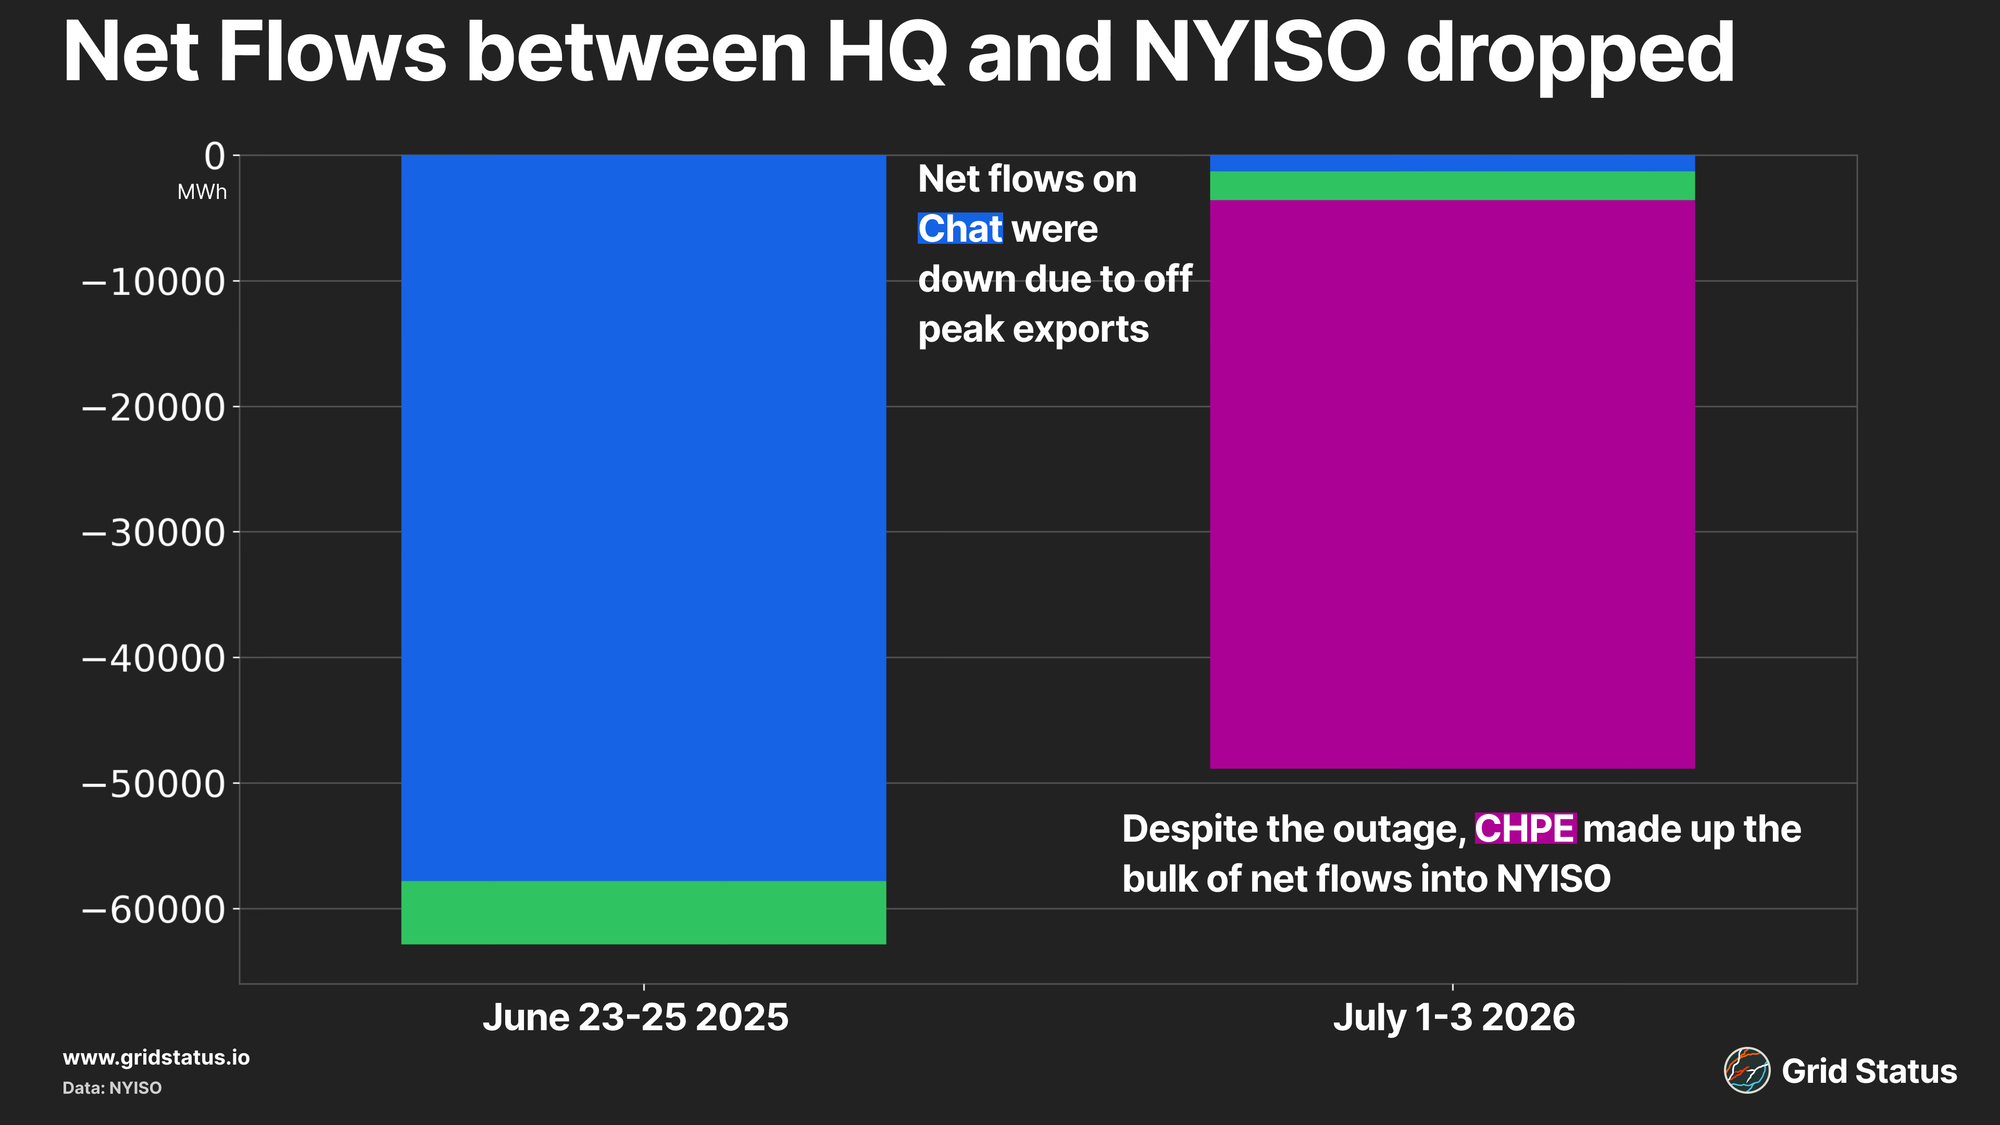
Net flows dropped nearly 14 GWh compared to the June 2025 heat event, largely due to a change in behavior at Châteauguay. While NYISO was a net importer on the tie line, it was largely exporting to HQ during the morning before flows reversed over the evening, which has been the pattern for multiple years now.
When CHPE is flowing, exports on Châteauguay could be seen as a way to wheel power through HQ, exporting from Zone D to HQ to then pull power into Zone J, avoiding the classic Central-East congestion that constrains NYISO’s internal West-to-East flows.
Central-East, has, however, become less of a concern in recent years following major transmission line work.
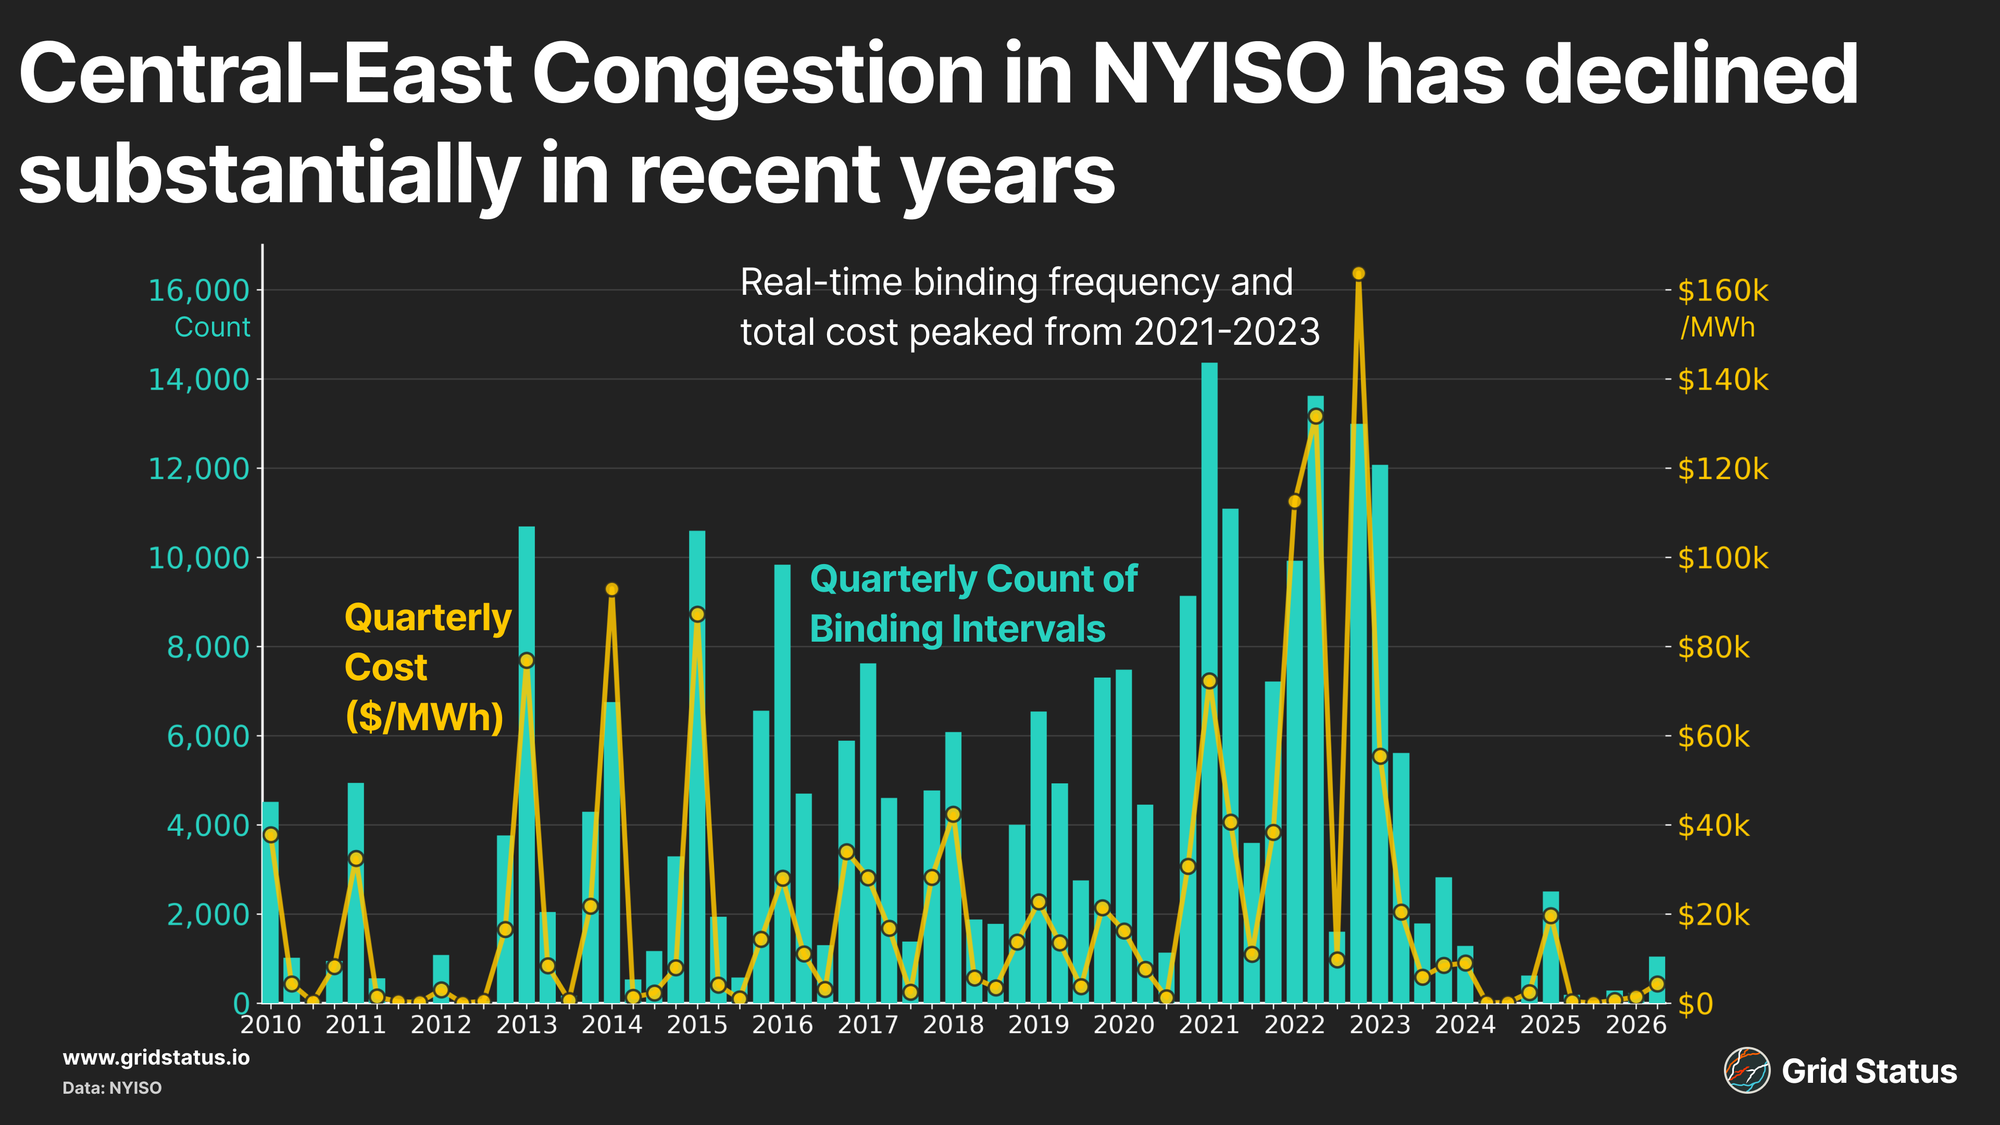
After binding for more than 35,000 intervals in real-time during both 2021 and 2022, CENTRAL EAST - VC bound for fewer than 5,000 intervals in 2024 and 2025, and looks set to repeat this outcome in 2026.
Mid-Continent, Maximum Weather
MISO battled Mother Nature during this heatwave, not just high temperatures, but destructive storms that rolled across the ISO.
High heat on the evening of July 2nd led to some demand response in the northern portion of the ISO as Local Resource Zone 1 (LRZ) saw load plateau during the evening peak. As heat moved east, storms eventually followed. The following night, LRZs 2 and 7 saw demand destruction as severe storms moved across Wisconsin and Michigan.
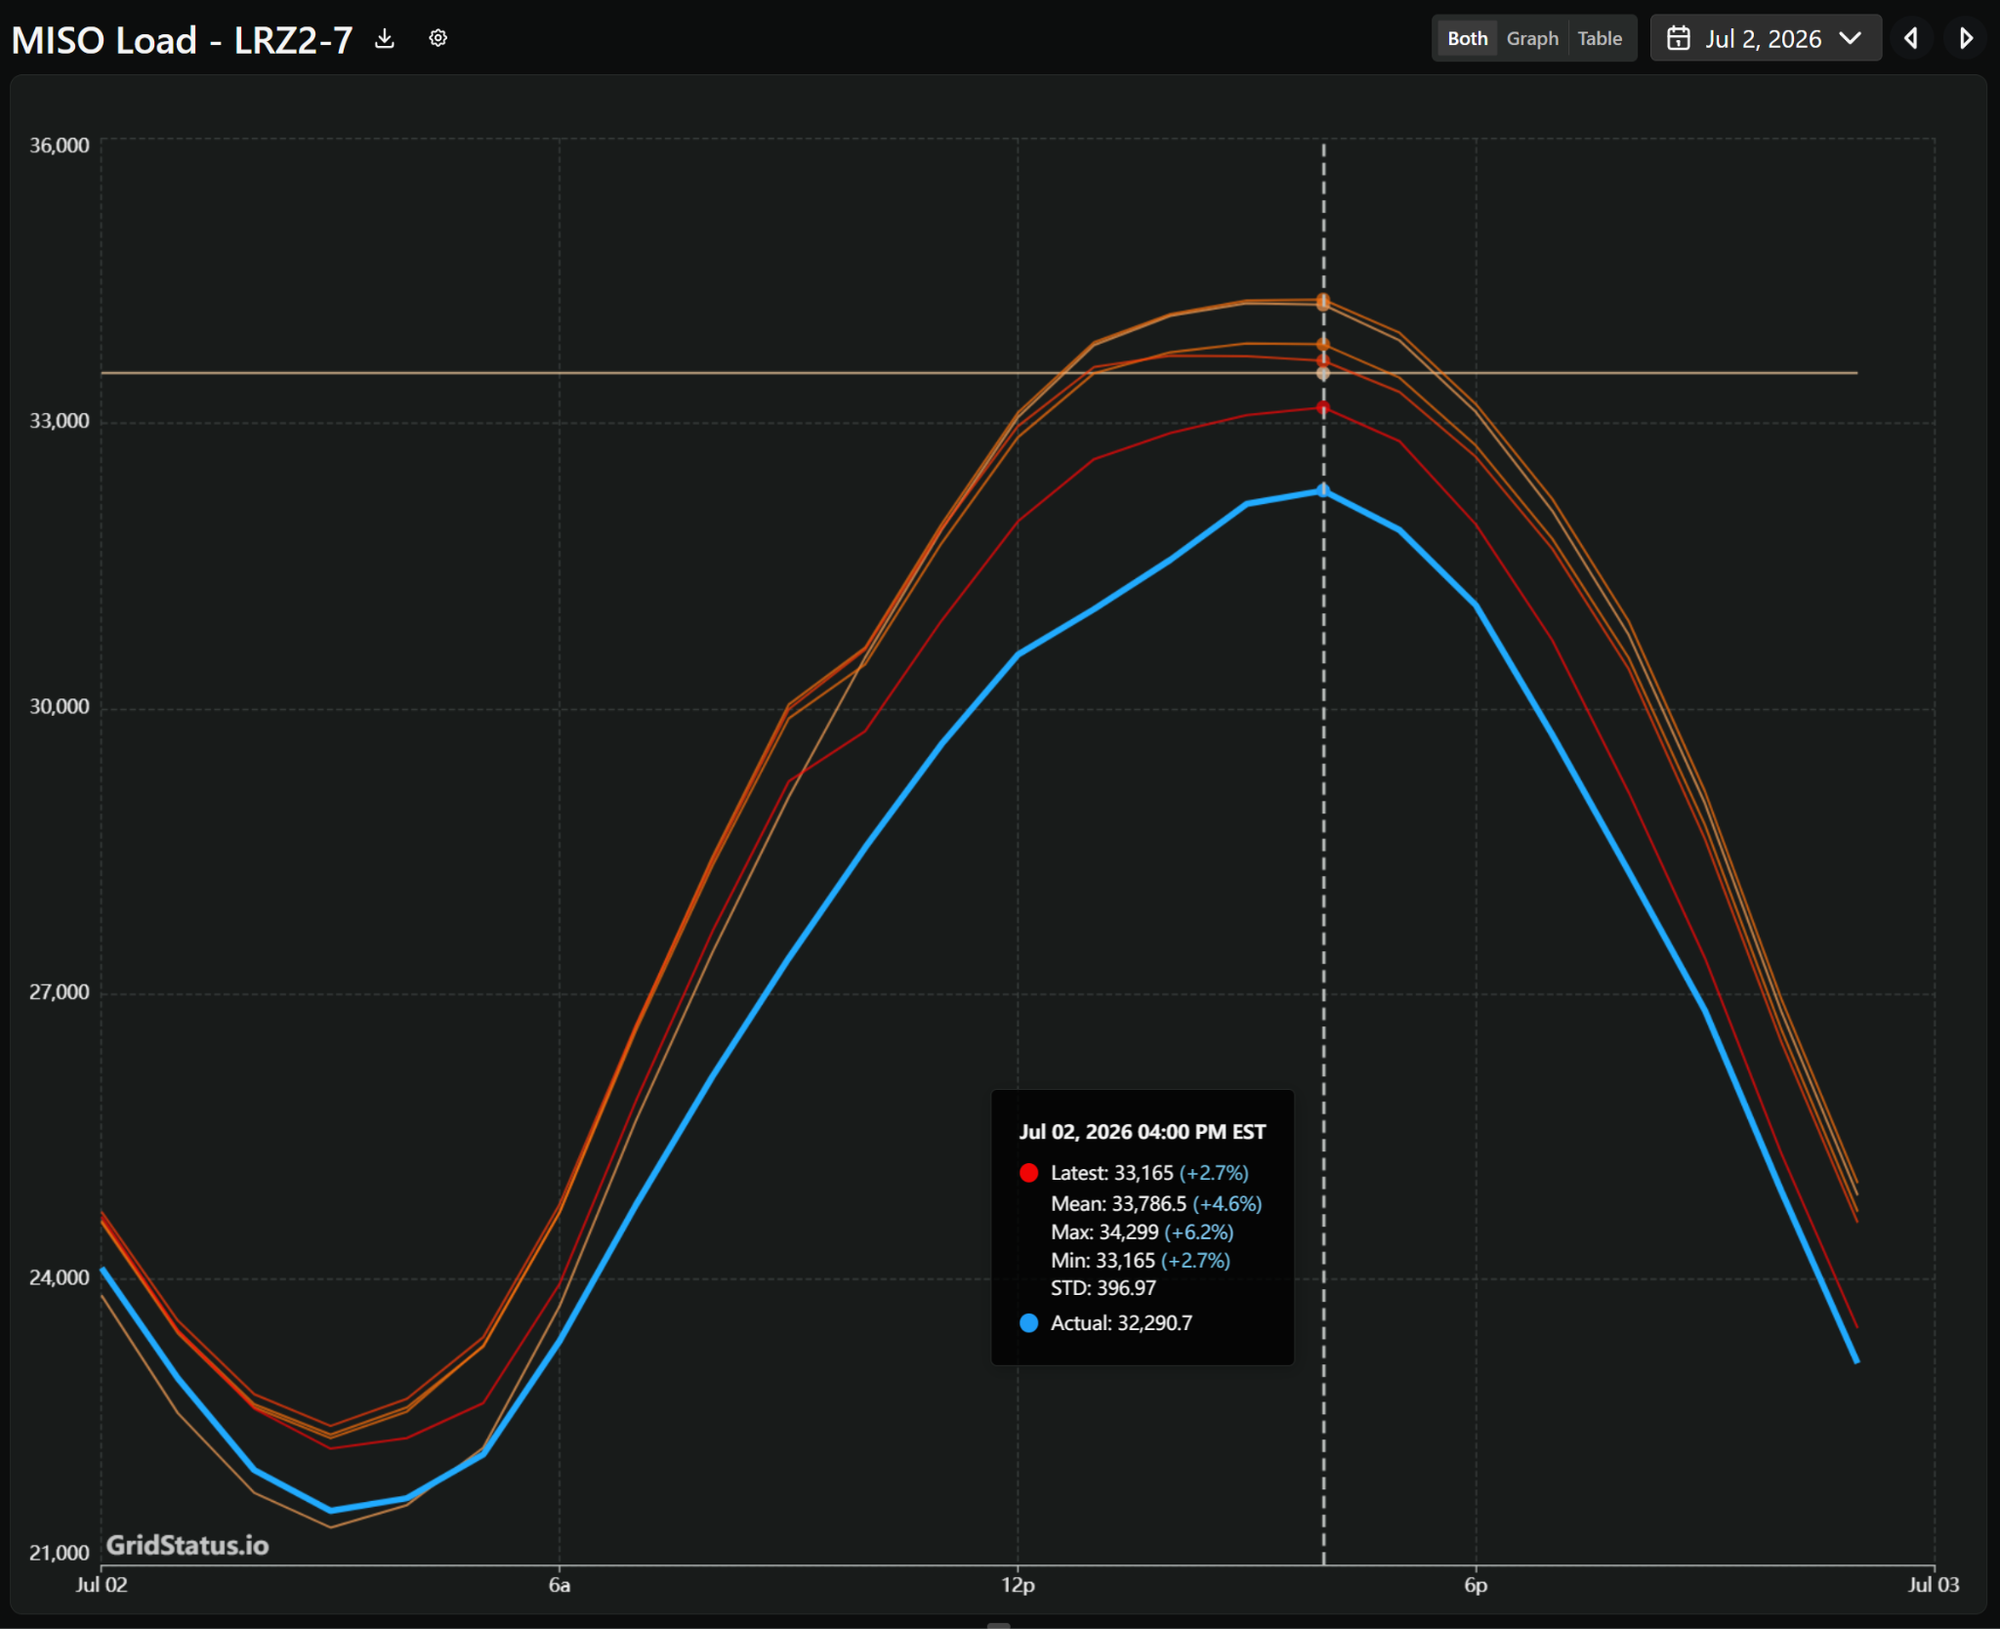
Power outages were seen in the Southern portion of the Michigan mitten due to these storms. Two days later, storms rolled through LRZ4, lowering demand and hampering the local barbecues for the 250th.
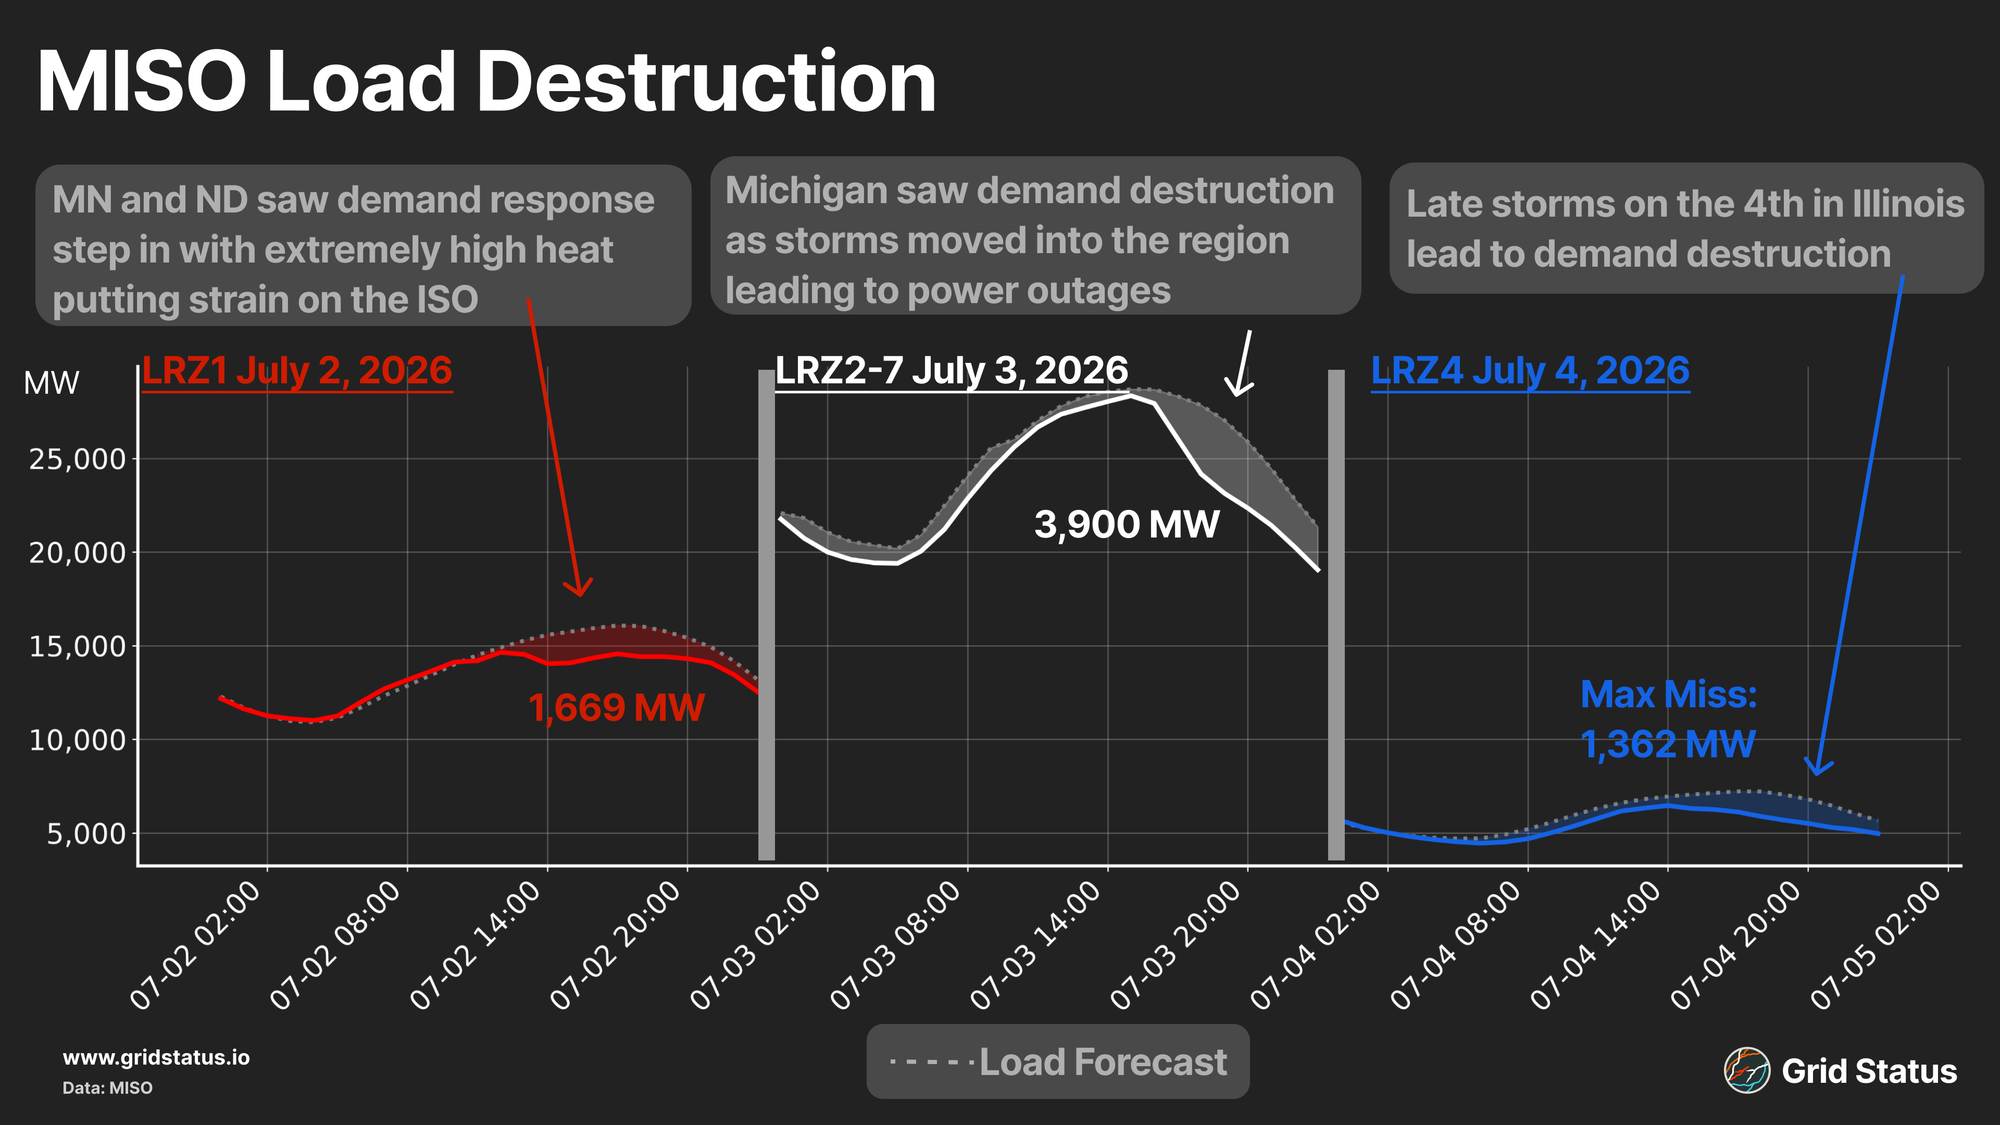
Despite demand destruction during the evening peaks in a handful of LRZs, real-time prices spiked (MINN.HUB, ILLINOIS.HUB) as solar fell off in the Central and North regions of the ISO.
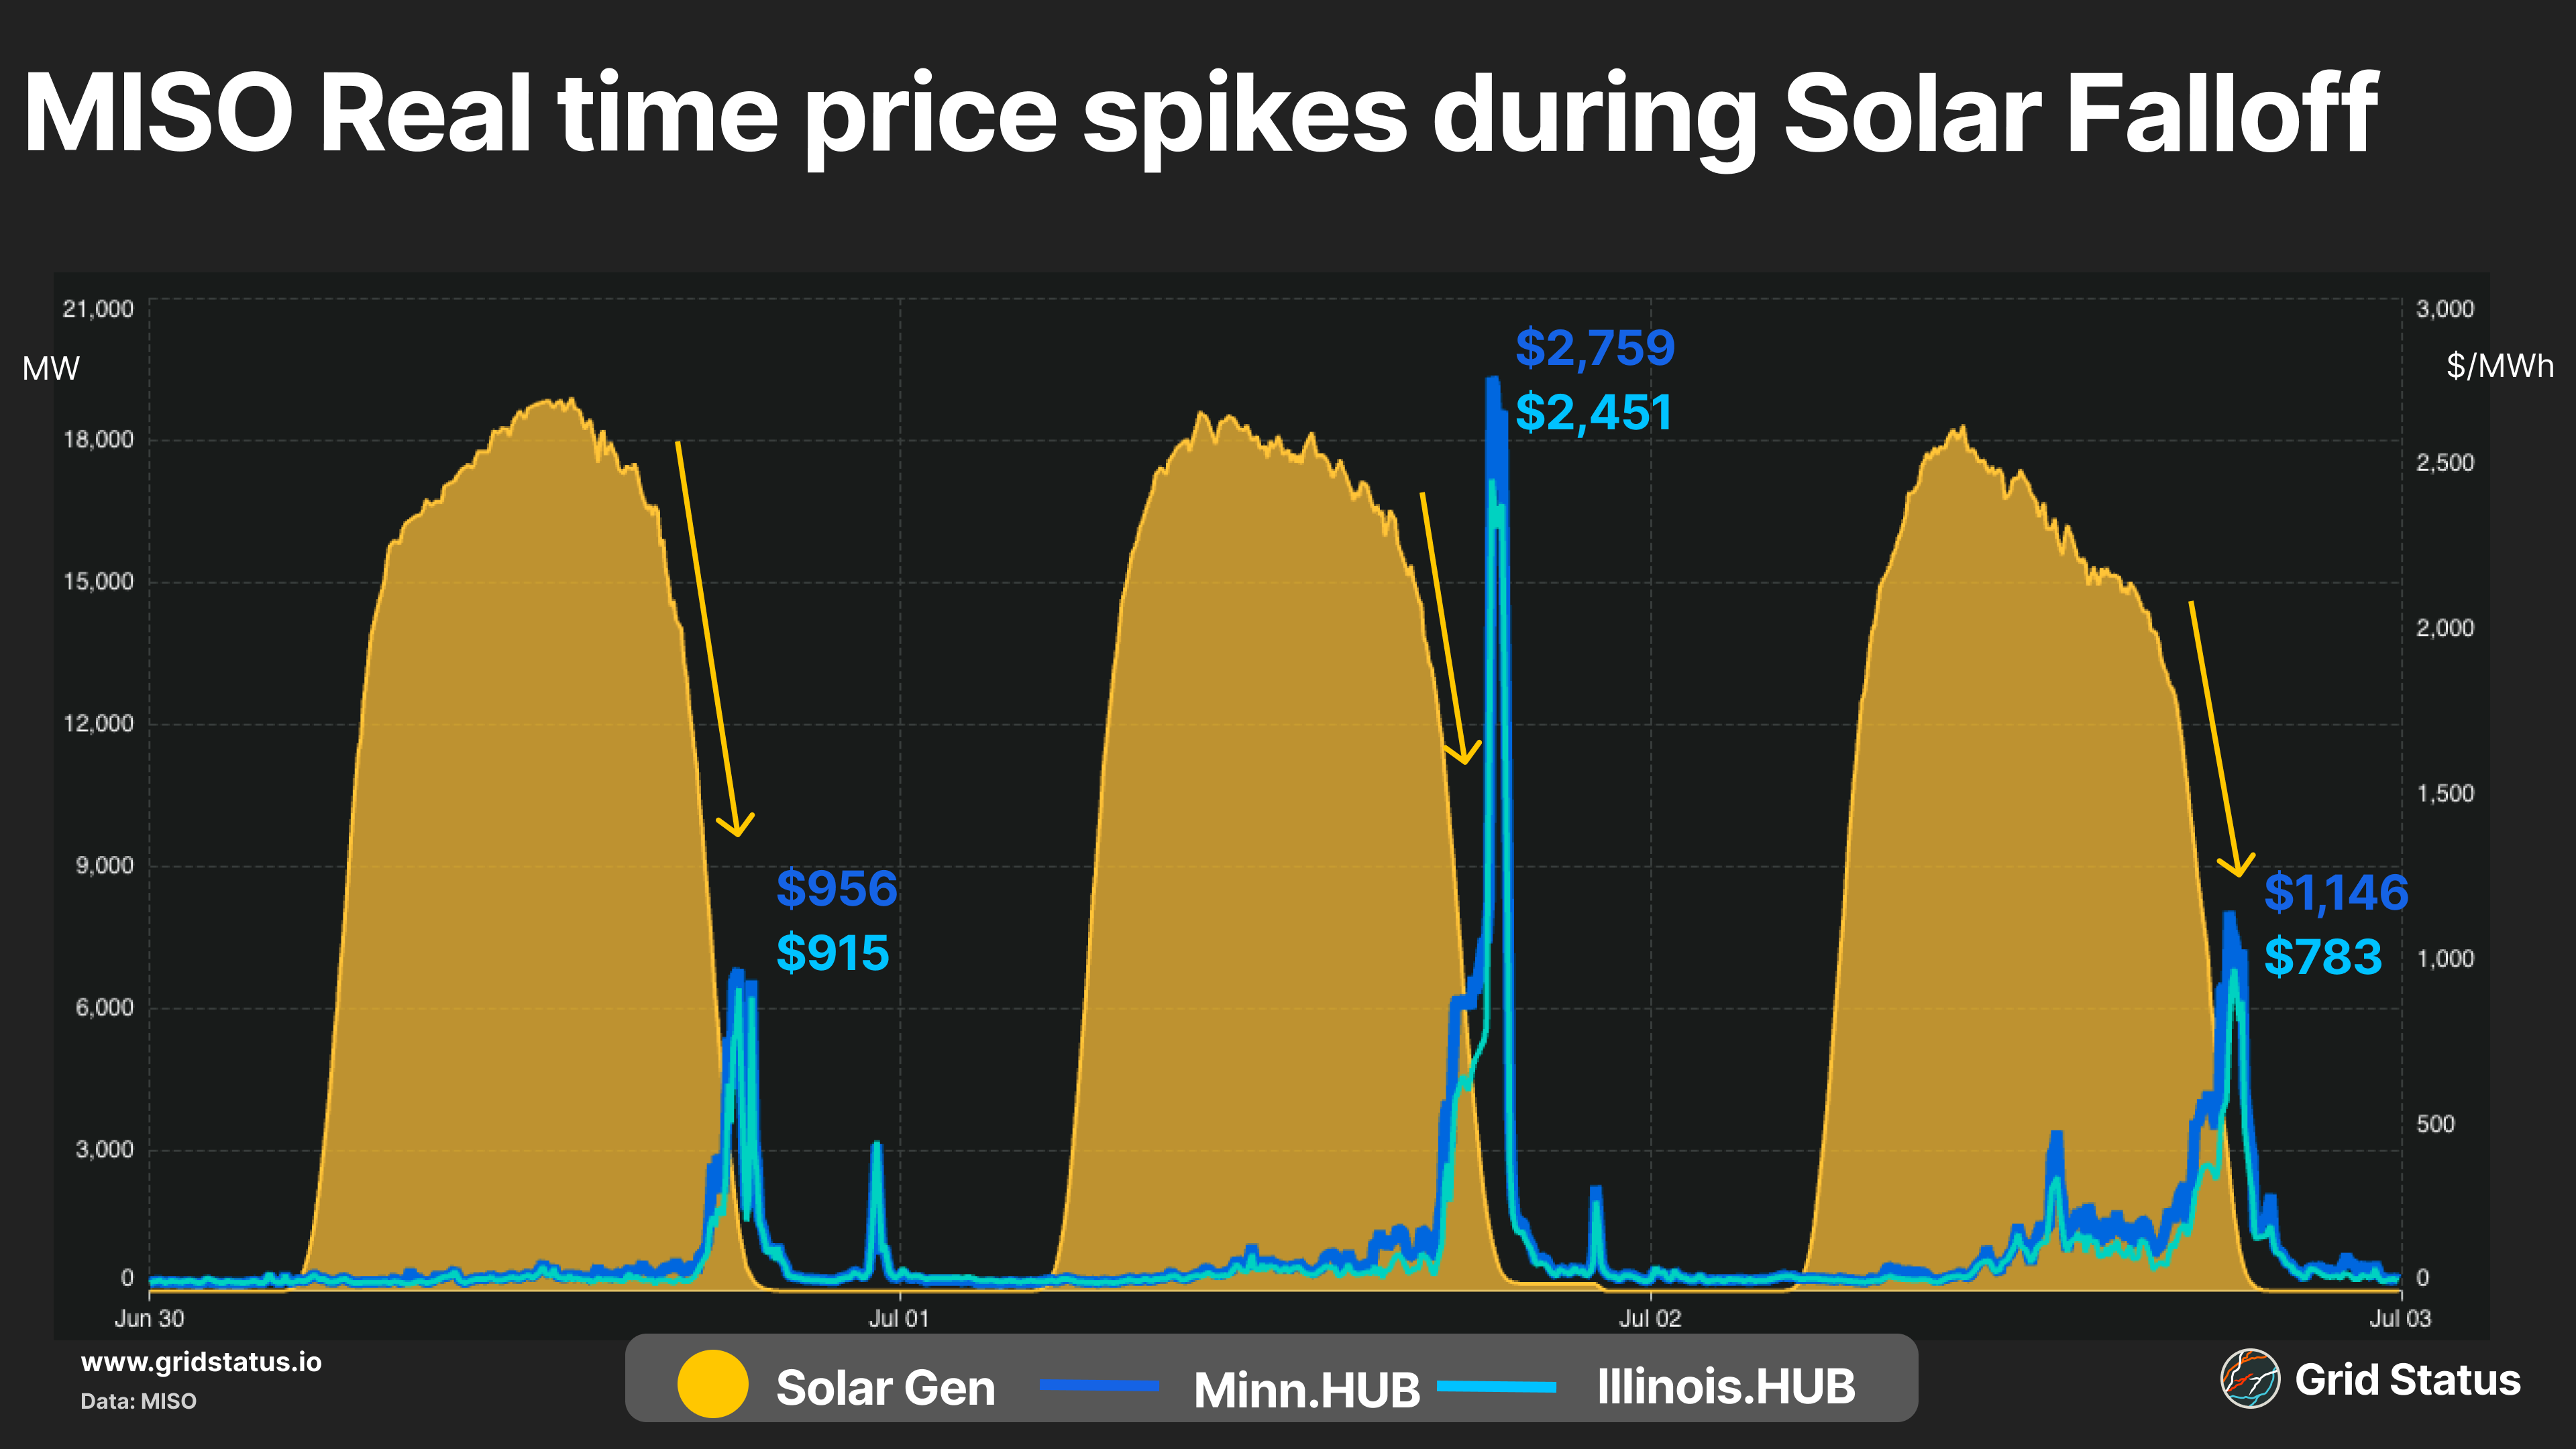
MISO has seen incredible solar growth, and with that has come the attendant net load ramps. Over this event, prices were not shy to respond and indicate the need for flexible generation. While batteries have begun to make a visible impact on the MISO fuel stack this year, 1 GW of peak discharge is still well below the level required to cover the net load peak in such a large RTO.
MISO saw weak wind across the ISO during the heat wave. Wind particularly underperformed the forecast during the evening peak period when generation margins can be thin.
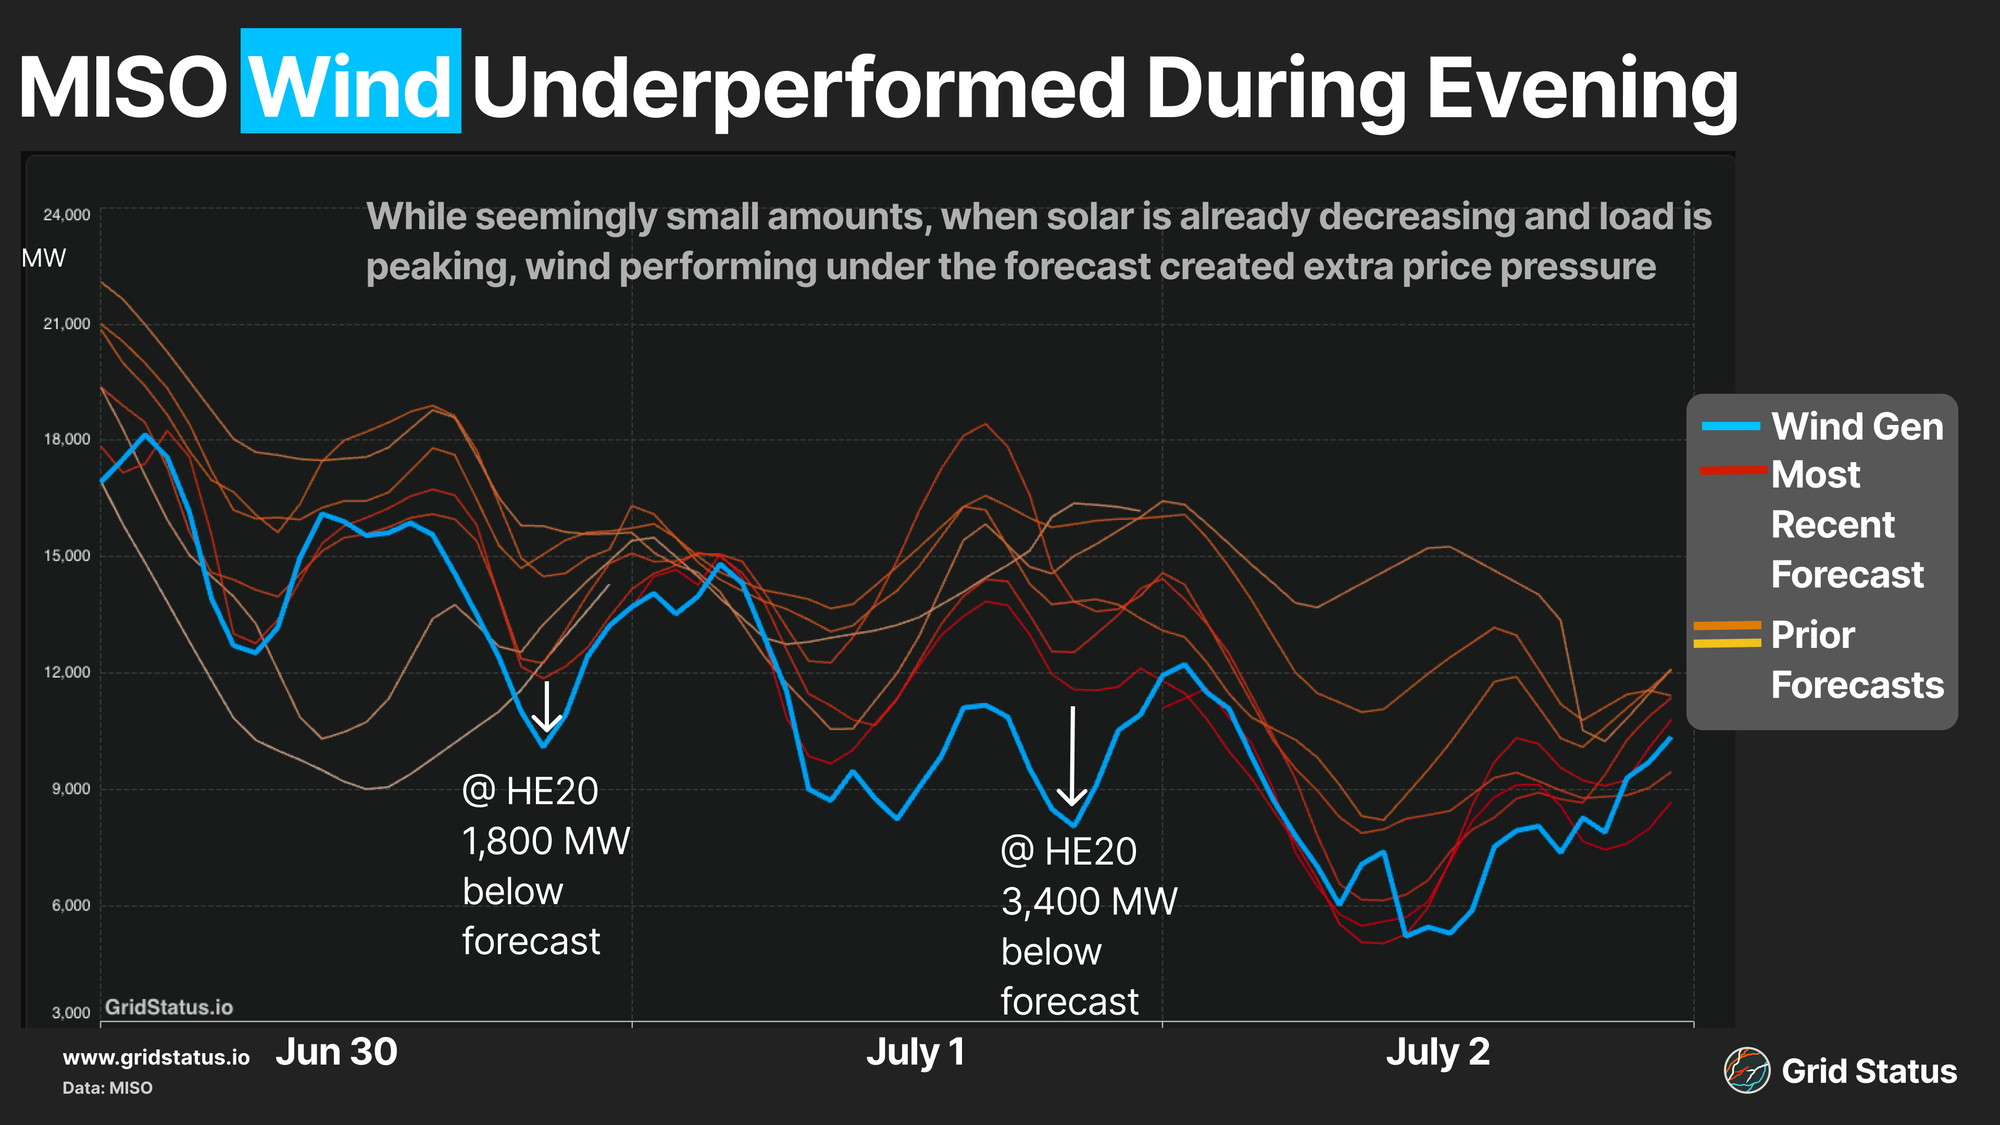
Wind overall also decreased across the week; accompanied, thankfully, by load, which helped mitigate some risk.
Alongside higher demand and lower wind, substantial coal came online, resulting in the highest output levels seen this year.
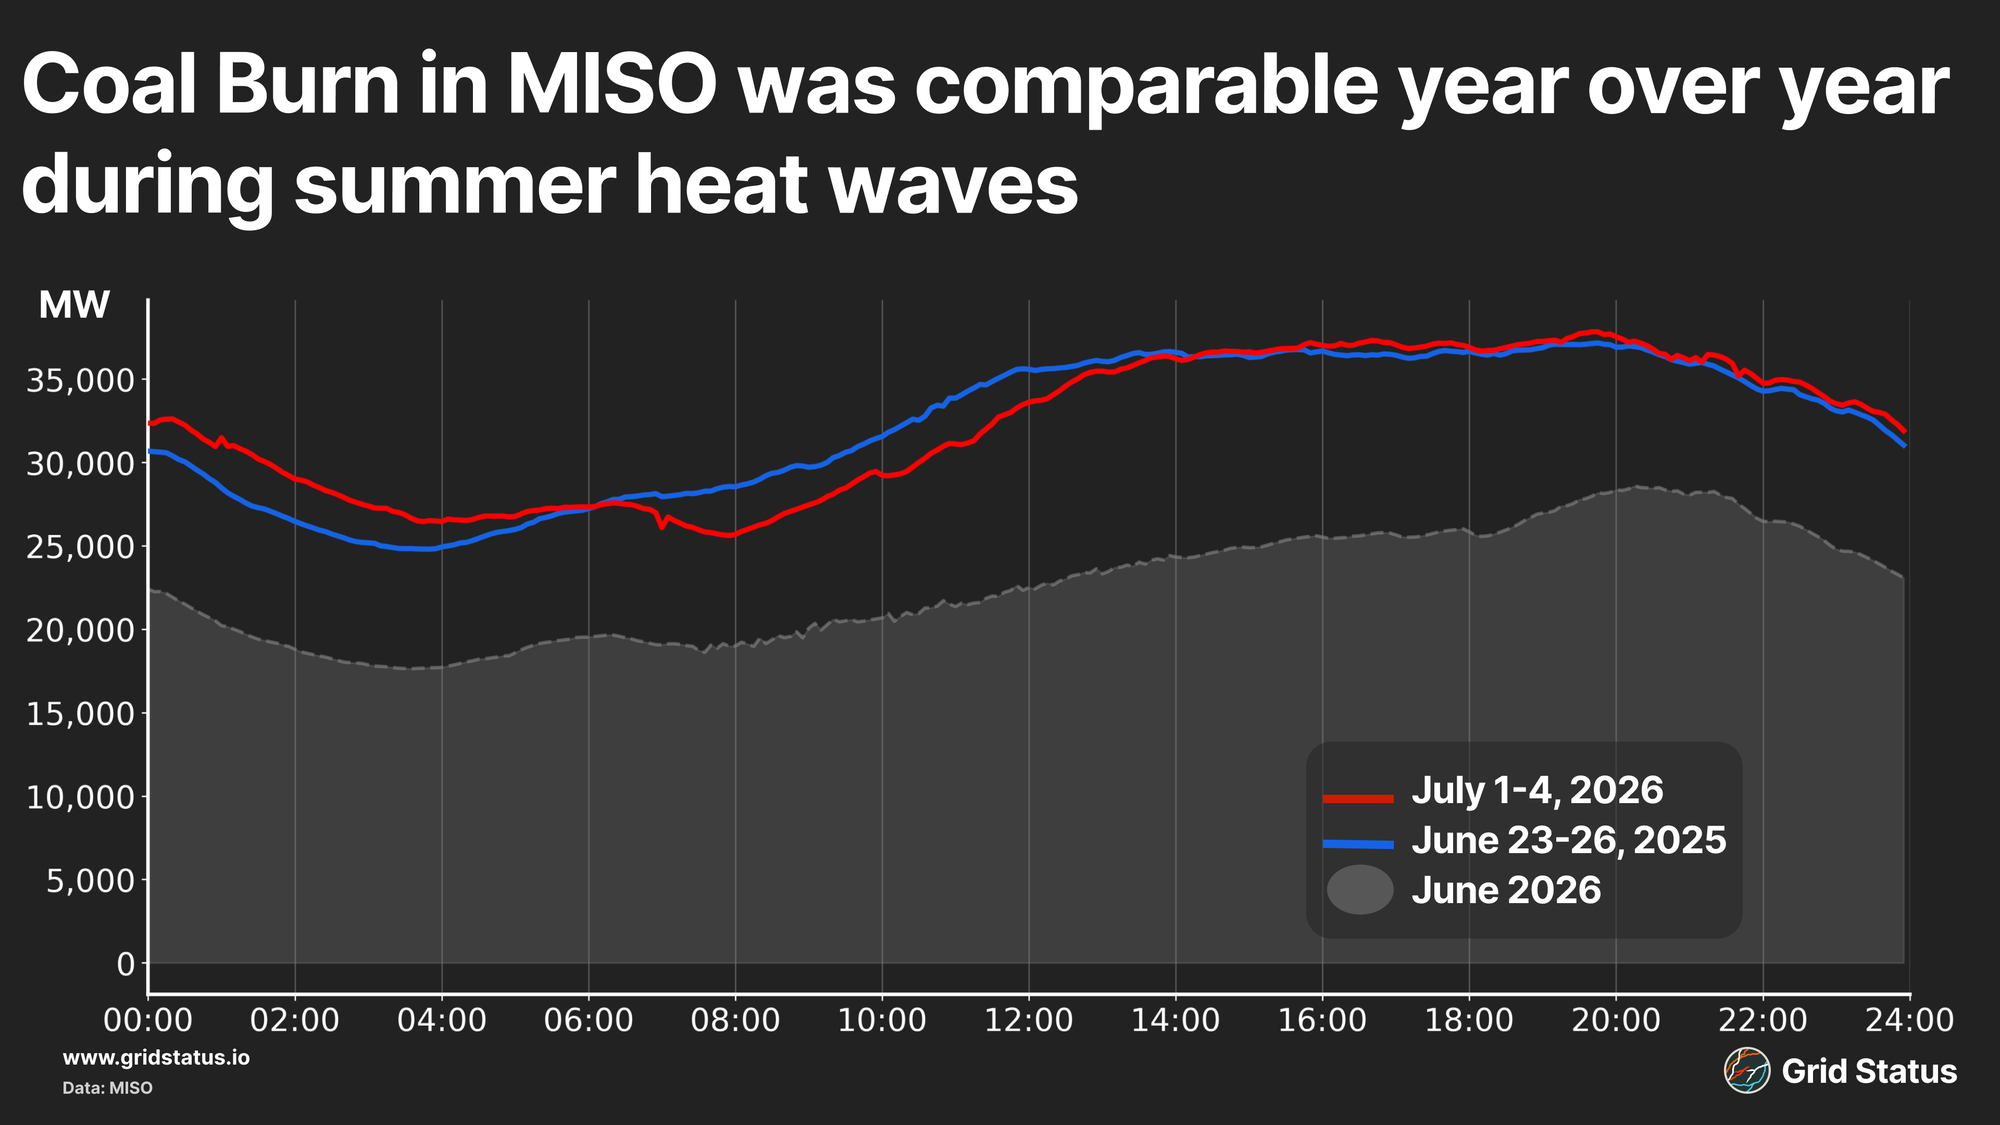
Coal has been down on average year over year, but saw a substantial increase during this period of high load, as generation during this heat wave tracked at similar levels compared to last year’s June heat wave. MISO coal units have been in the headlines for a good year now as DOE continues to grant extensions on JH Campbell, RM Schafer, and JM Culley.
Power Trips and Imports Spritz
MISO came out of the heatwave fairly unscathed, but somehow, heat returned.
On Wednesday, July 15, high temperatures combined with low wind forecasts to generate high day-ahead price clears. The grid was stressed but had experienced similar conditions the day prior and held on well. However, pressure mounted as forced outages occurred on both coal and natural gas plants, leading to a loss in baseload generation.
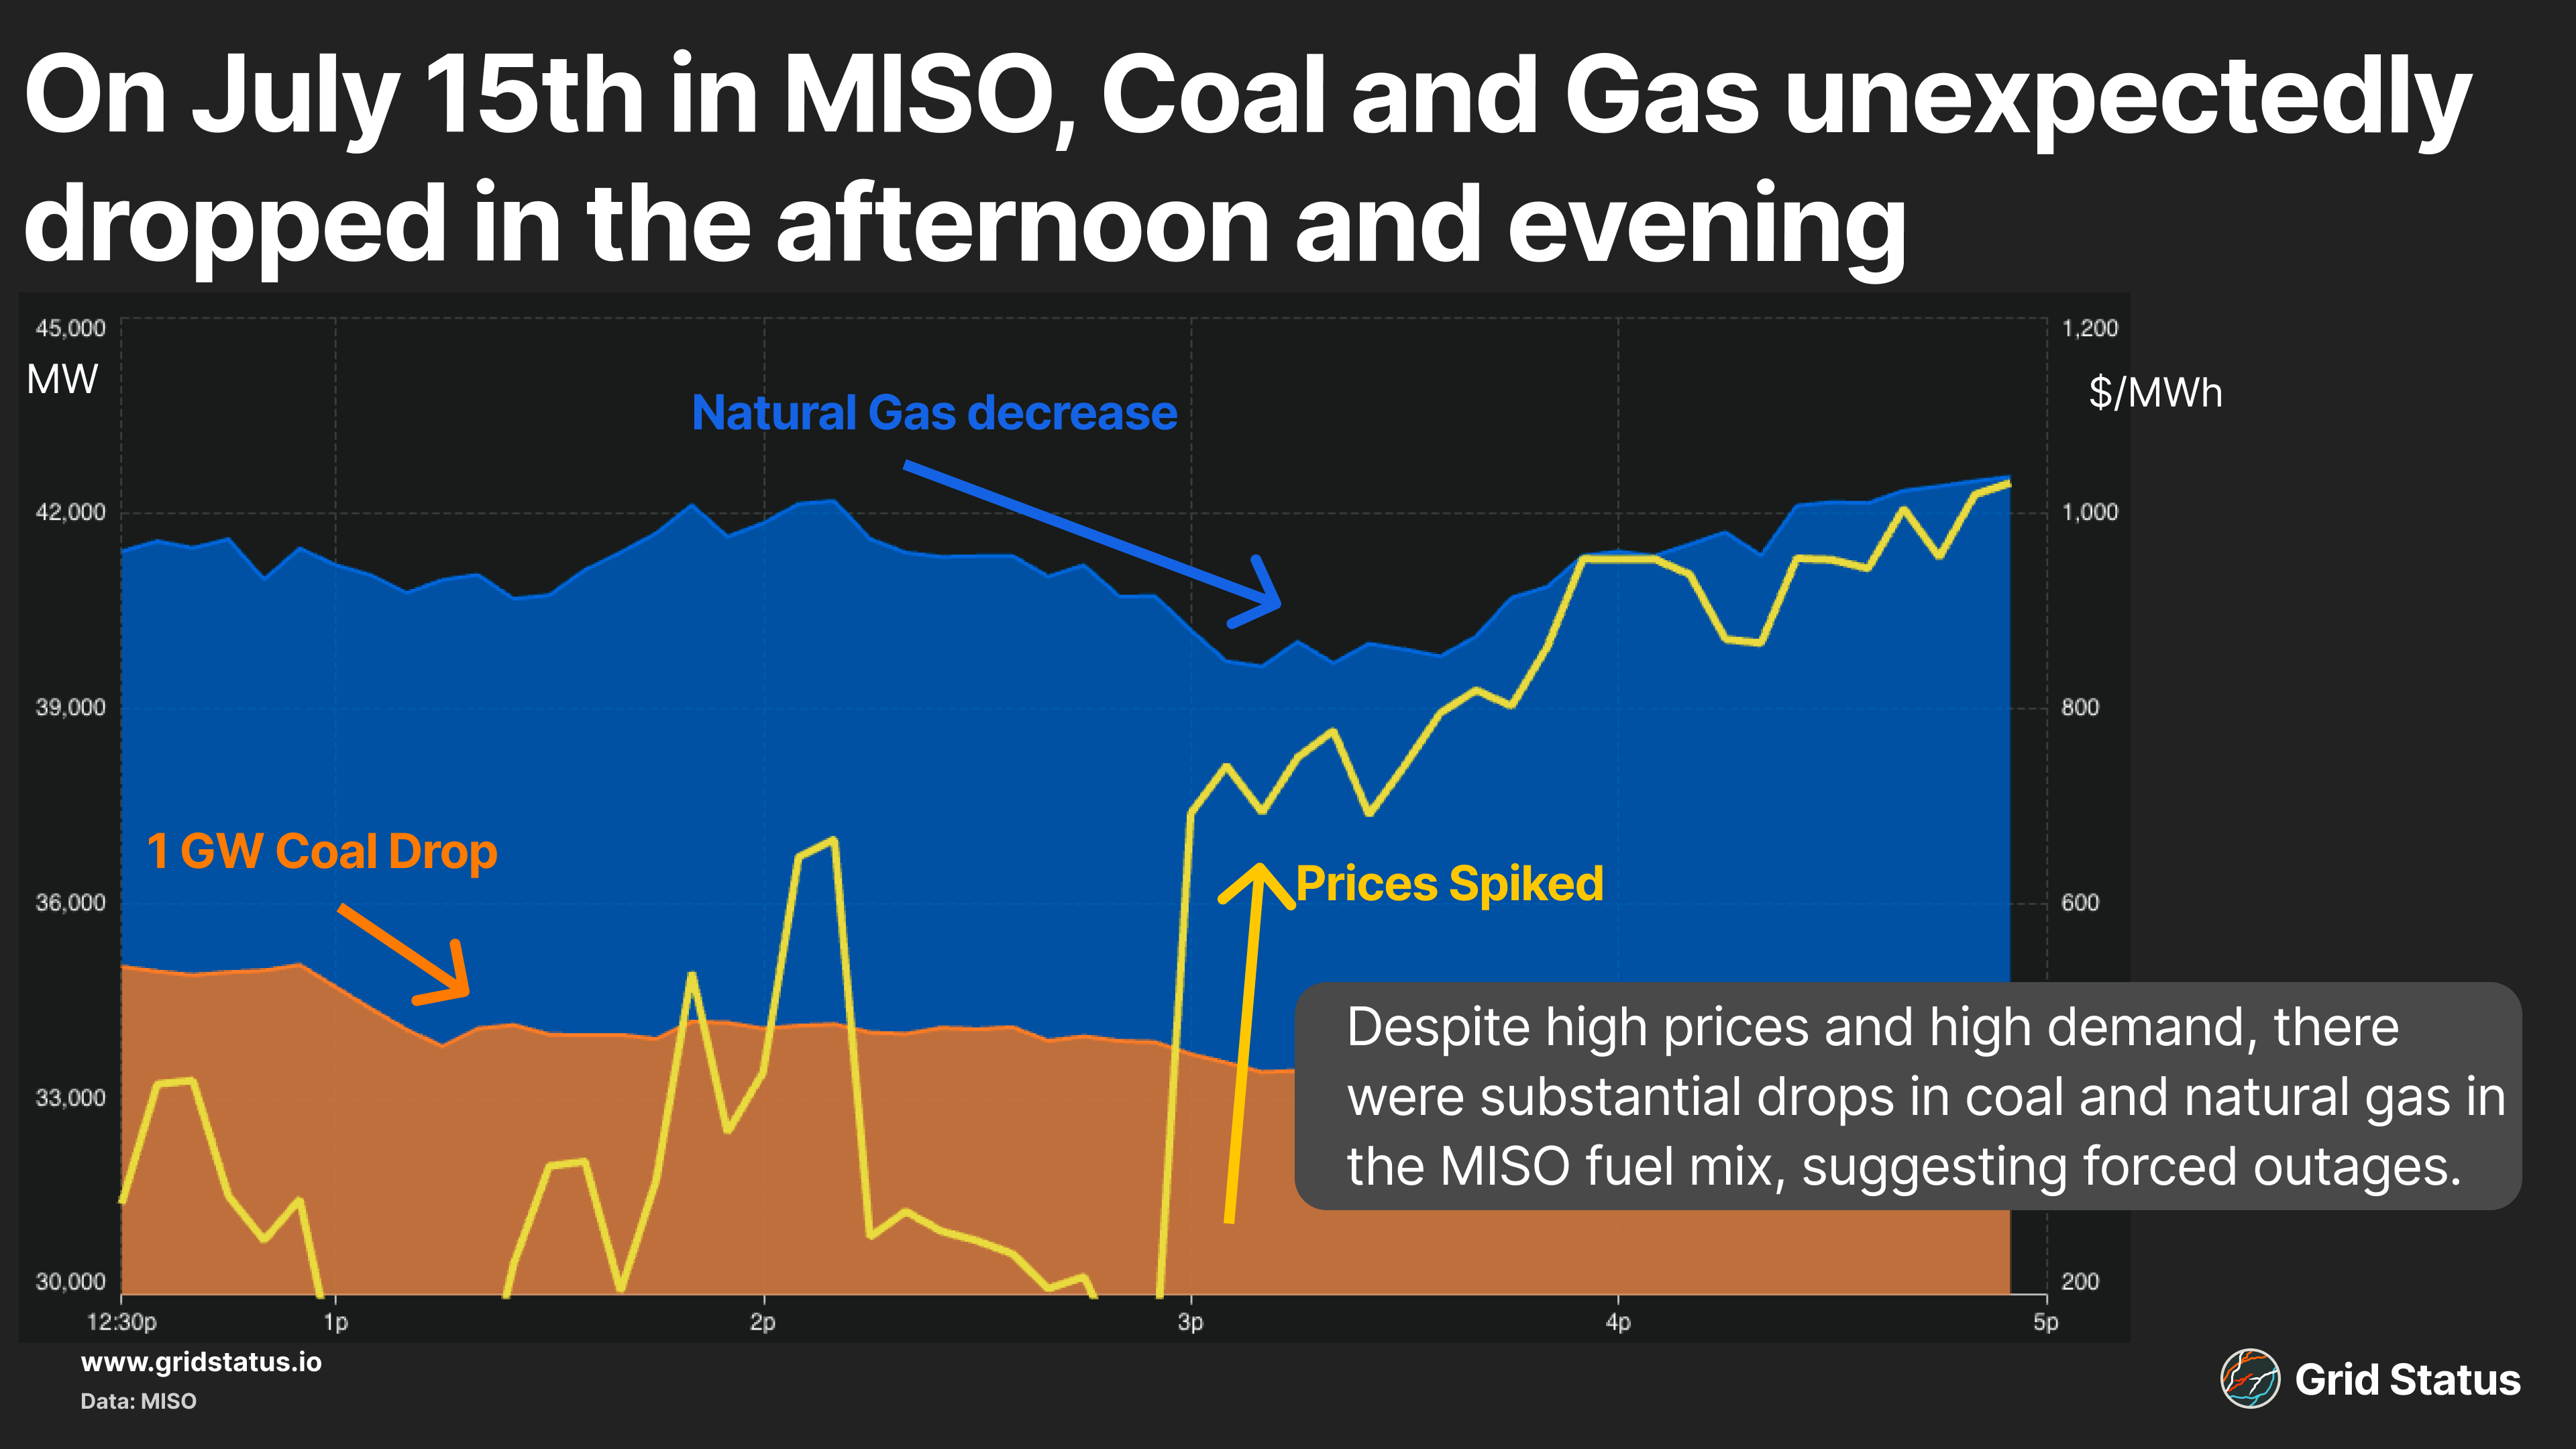
With already tight conditions, real-time prices, particularly in Michigan, began to climb and remained high. MISO instituted Emergency Energy Activation 1 and then 2 as generation fell short. Demand response appeared to step in as load began to fall off, below the 121 GW forecast.
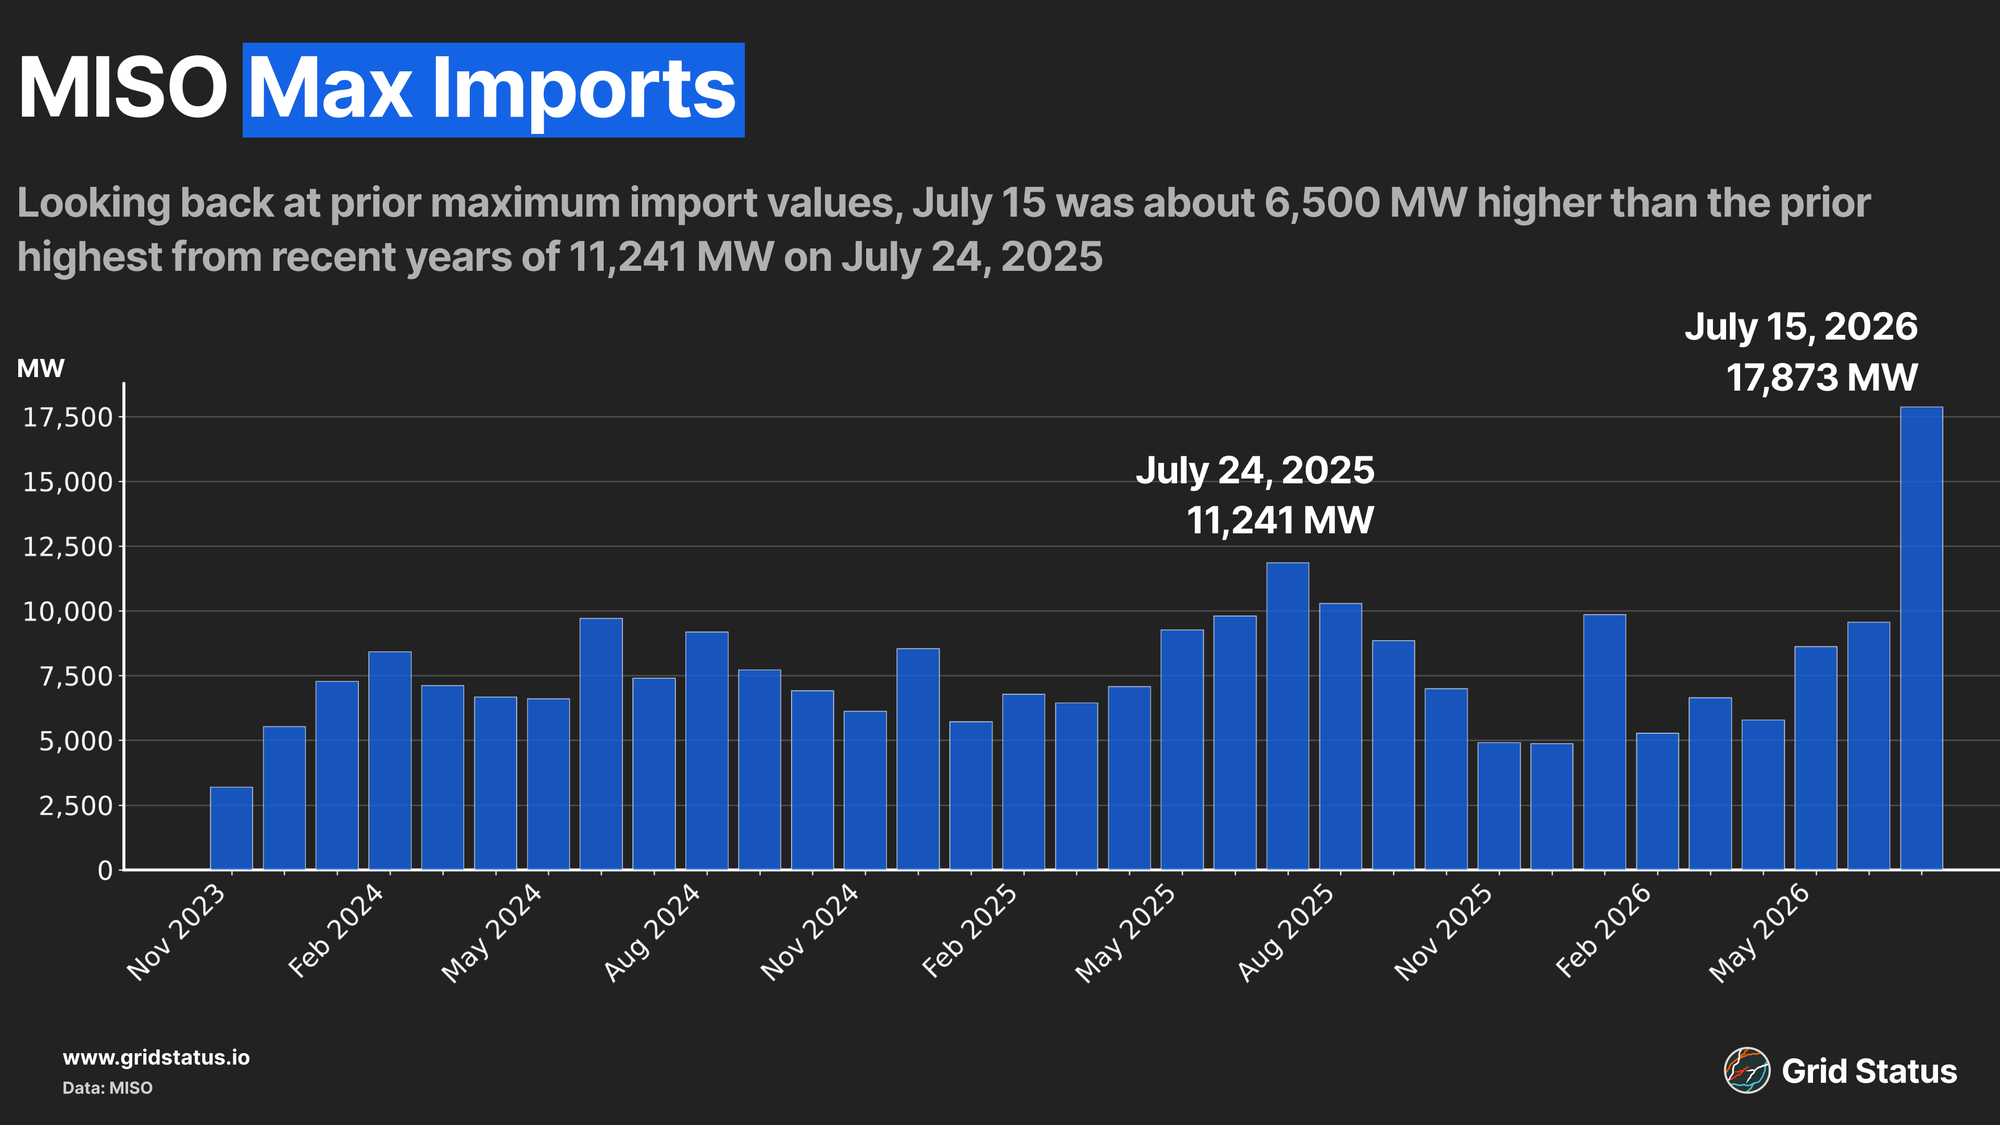
Simultaneously, imports kept climbing, eventually contributing a whopping 17,873 MW towards meeting the evening peak.
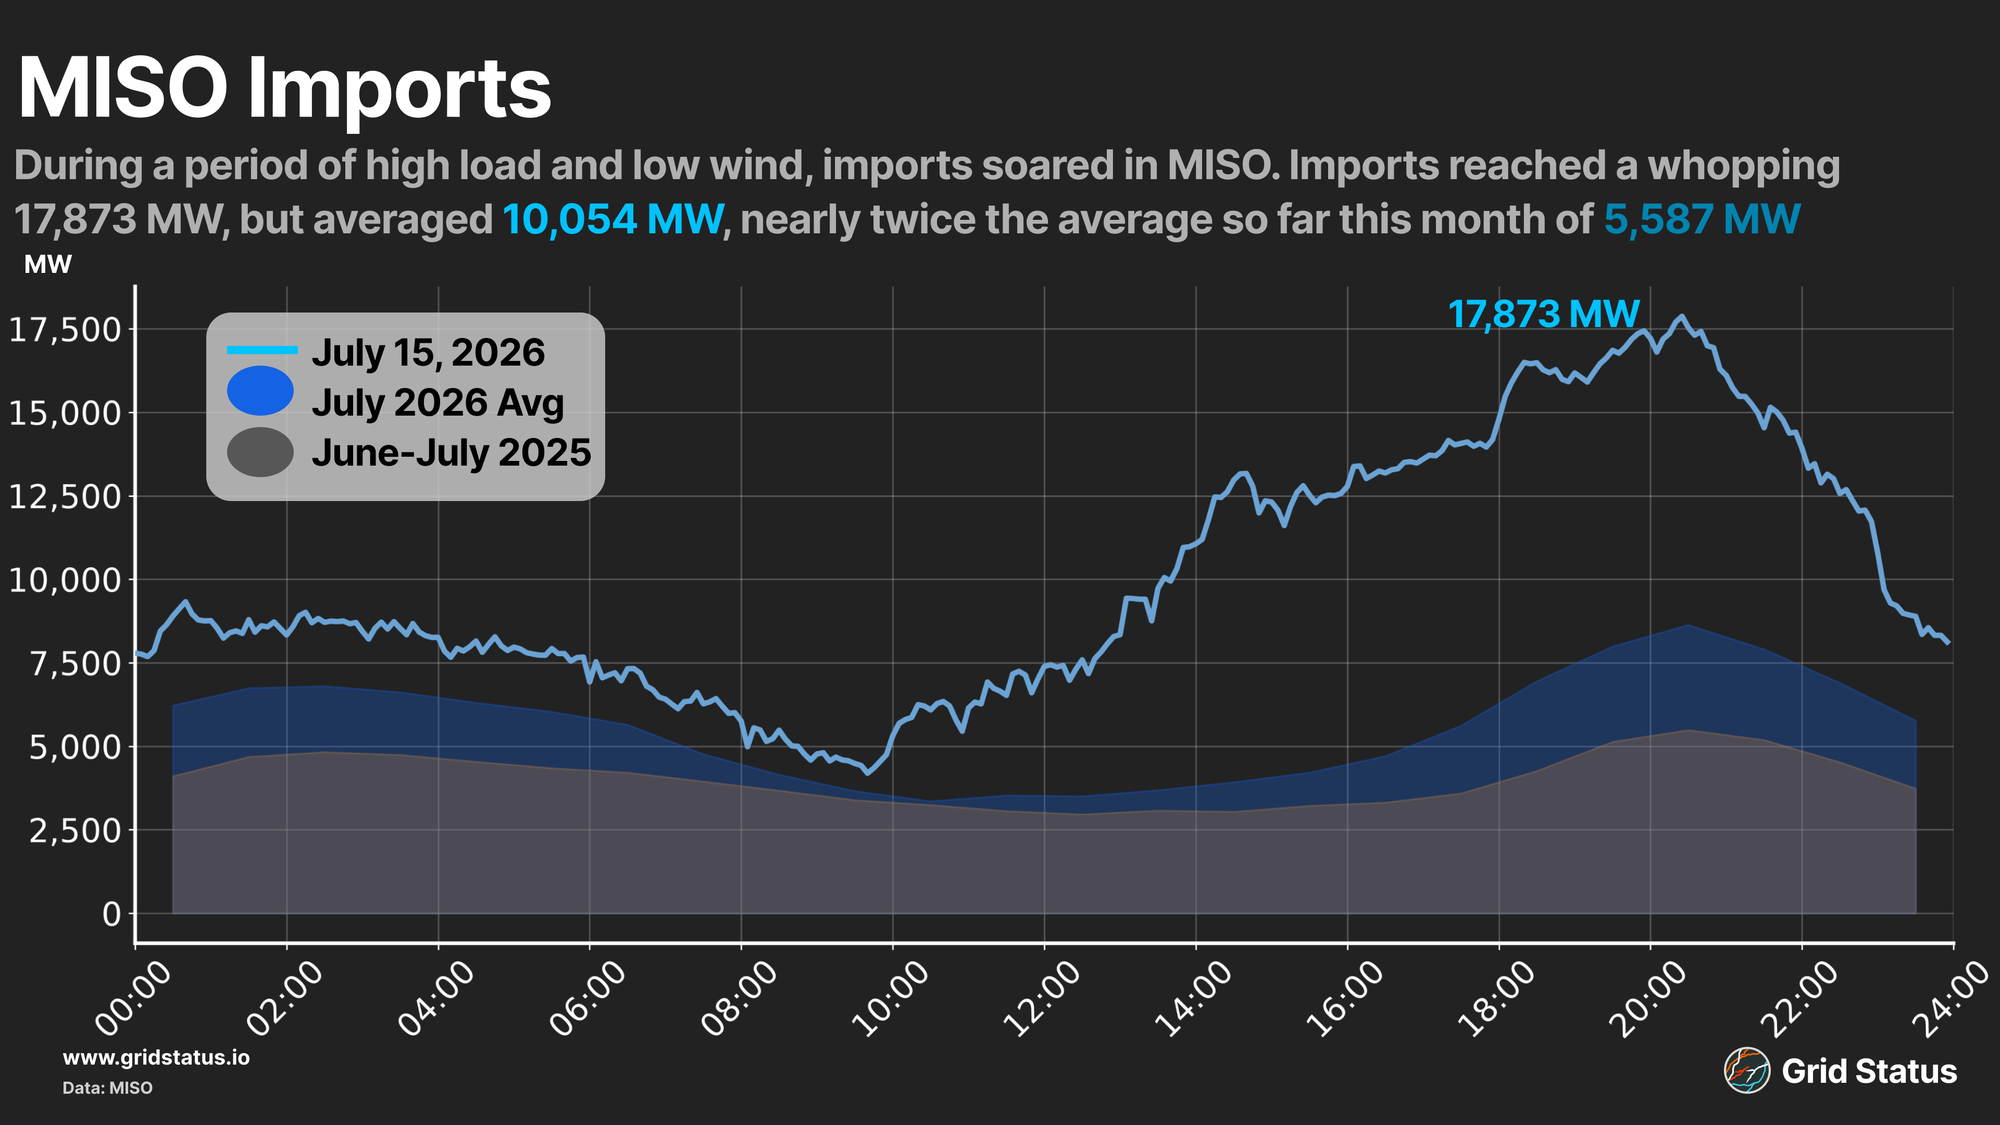
This level of imports tracks well above average incoming interchange for MISO, soaring over last summer’s previous high of 11,241 MW during last year's heat wave. Conditions last year were similar, but 2025 had 4 GW less of coal online, which certainly created pressure.
PJM and SPP contributed the highest amounts, but both of those grids were under their own stress from high temperatures that day. Without some help from their neighbors, MISO might have faced something other than high prices that Wednesday.
Hot Topics: Renewables and Batteries
Not all grids are created equal, and some weathered the heatwave better than others. Similar to their eastern neighbors, SPP and ERCOT saw high load, but unlike PJM, MISO, NYISO, and ISO-NE, prices barely registered a response.
One of the largest distinguishing factors SPP and ERCOT had much higher renewable penetration of their load compared to other ISOs, resulting in a bearish impact on pricing. Unlike MISO, wind was strong in both SPP and ERCOT during this heatwave, and ERCOT had plentiful solar during the day.
This disparity in zero-fuel-cost resources was apparent in the day-ahead clears across each market, with PJM posting the highest clears and some of the lowest output.
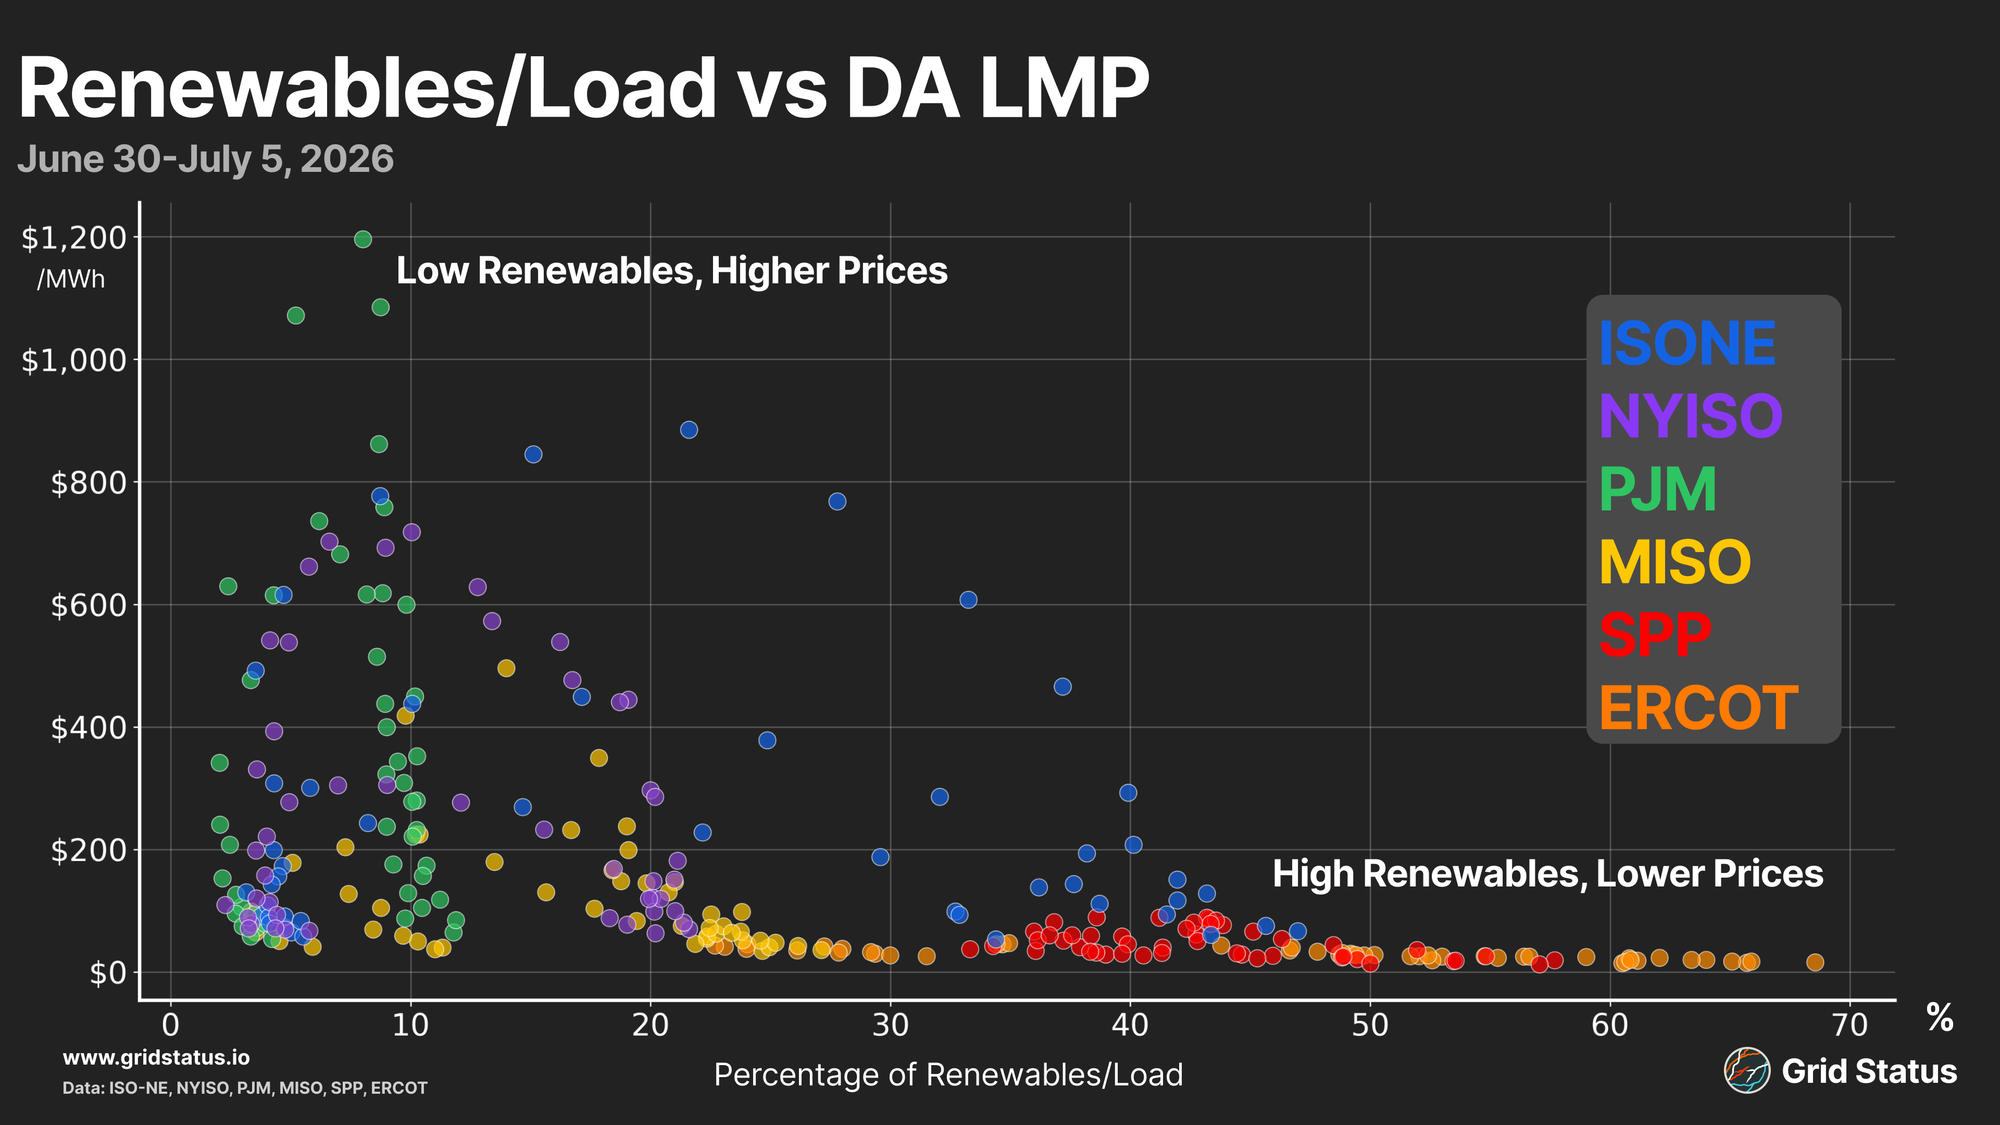
While MISO does have a healthy renewable generation buildout, wind was weak during the heatwave, and prices cleared high as solar fell out of the stack. ISO-NE is a bit of an outlier with heavy BTM solar and growing offshore wind helping the stack, but it still saw high prices due to gas constraints and oil generation needed to meet a substantial amount of capacity.
Small amounts of battery capacity are beginning to pop up in MISO, PJM, and ISO-NE. PJM, despite being the largest system, has the smallest level of reported battery discharge.
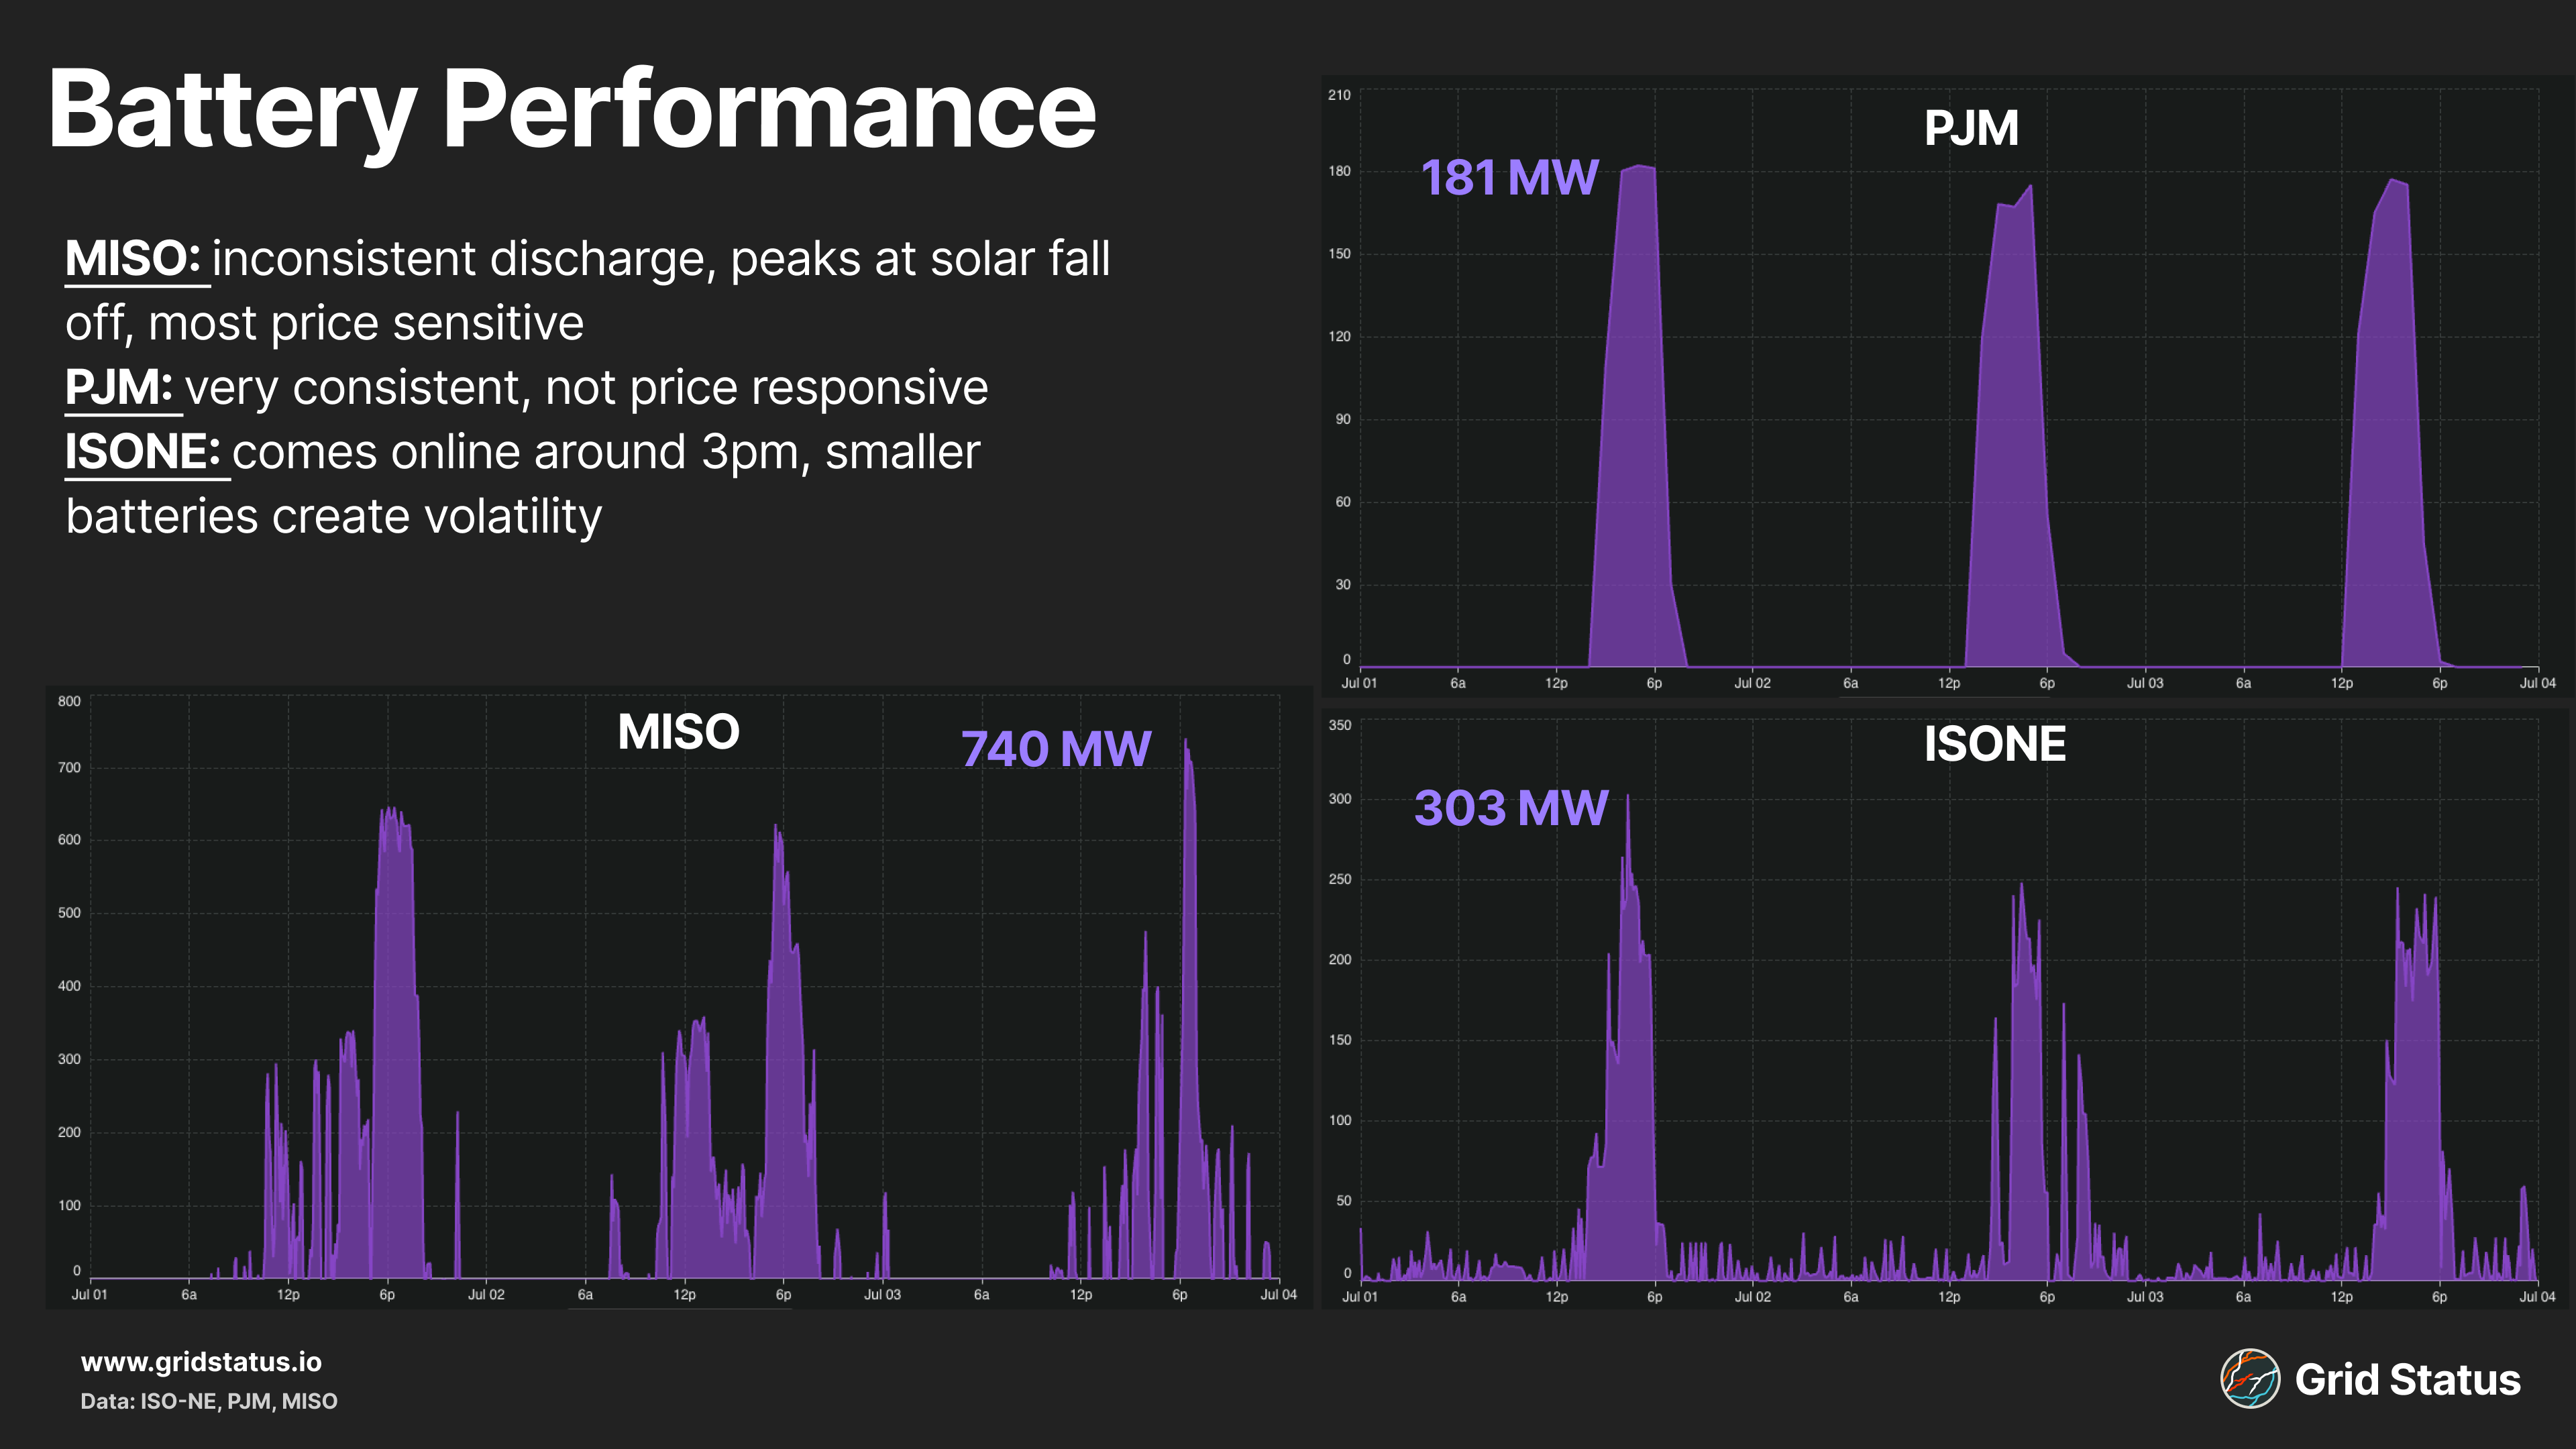
PJM’s output was also the most consistent through this heatwave. This consistency is more a reflection of the small number of projects active in the RTO, as variation in activity is driven by disparate project economics and operations.
ISO-NE had some variability in the discharge, with systems typically coming online to discharge around 3pm local time. MISO has the largest installed capacity between the three, and the ISO’s battery activity saw the most variability. Output appeared quick to respond to price signals, with more discharge earlier in the day before peaking alongside prices in the evening.
Overall, Eastern Interconnection systems have a long way to go to see the same level of discharge as CAISO and ERCOT, whose large amounts of battery capability help to substantially smooth the evening peak.
Tight Pipes
Natural gas pipelines across the eastern seaboard announced Operational Flow Orders (OFOs) during the heat wave. The main purpose of these OFOs was to warn off-takers not to take more gas than their scheduled quantity.
Power plant operators might be tempted to take more than scheduled due to high power demand and the desire to maximize their own operations. But if offtakers take too much fuel, the pipeline has trouble balancing out the pressure on the line. Additionally, this leaves less natural gas on the pipeline for power plants further down, which impacts gas sourcing and puts adequate generation at risk for the grid.
Pipelines only have limited capacity to deliver so much gas at a given time, so even if power plants can burn higher amounts, they become limited by overall system delivery capability when everyone on the grid wants to burn close to capacity.
Natural gas generation was strong during the heatwave as the leading fuel source across most of the ISOs, but is actually tracking below July 2025 for most of the eastern ISO/RTOs.
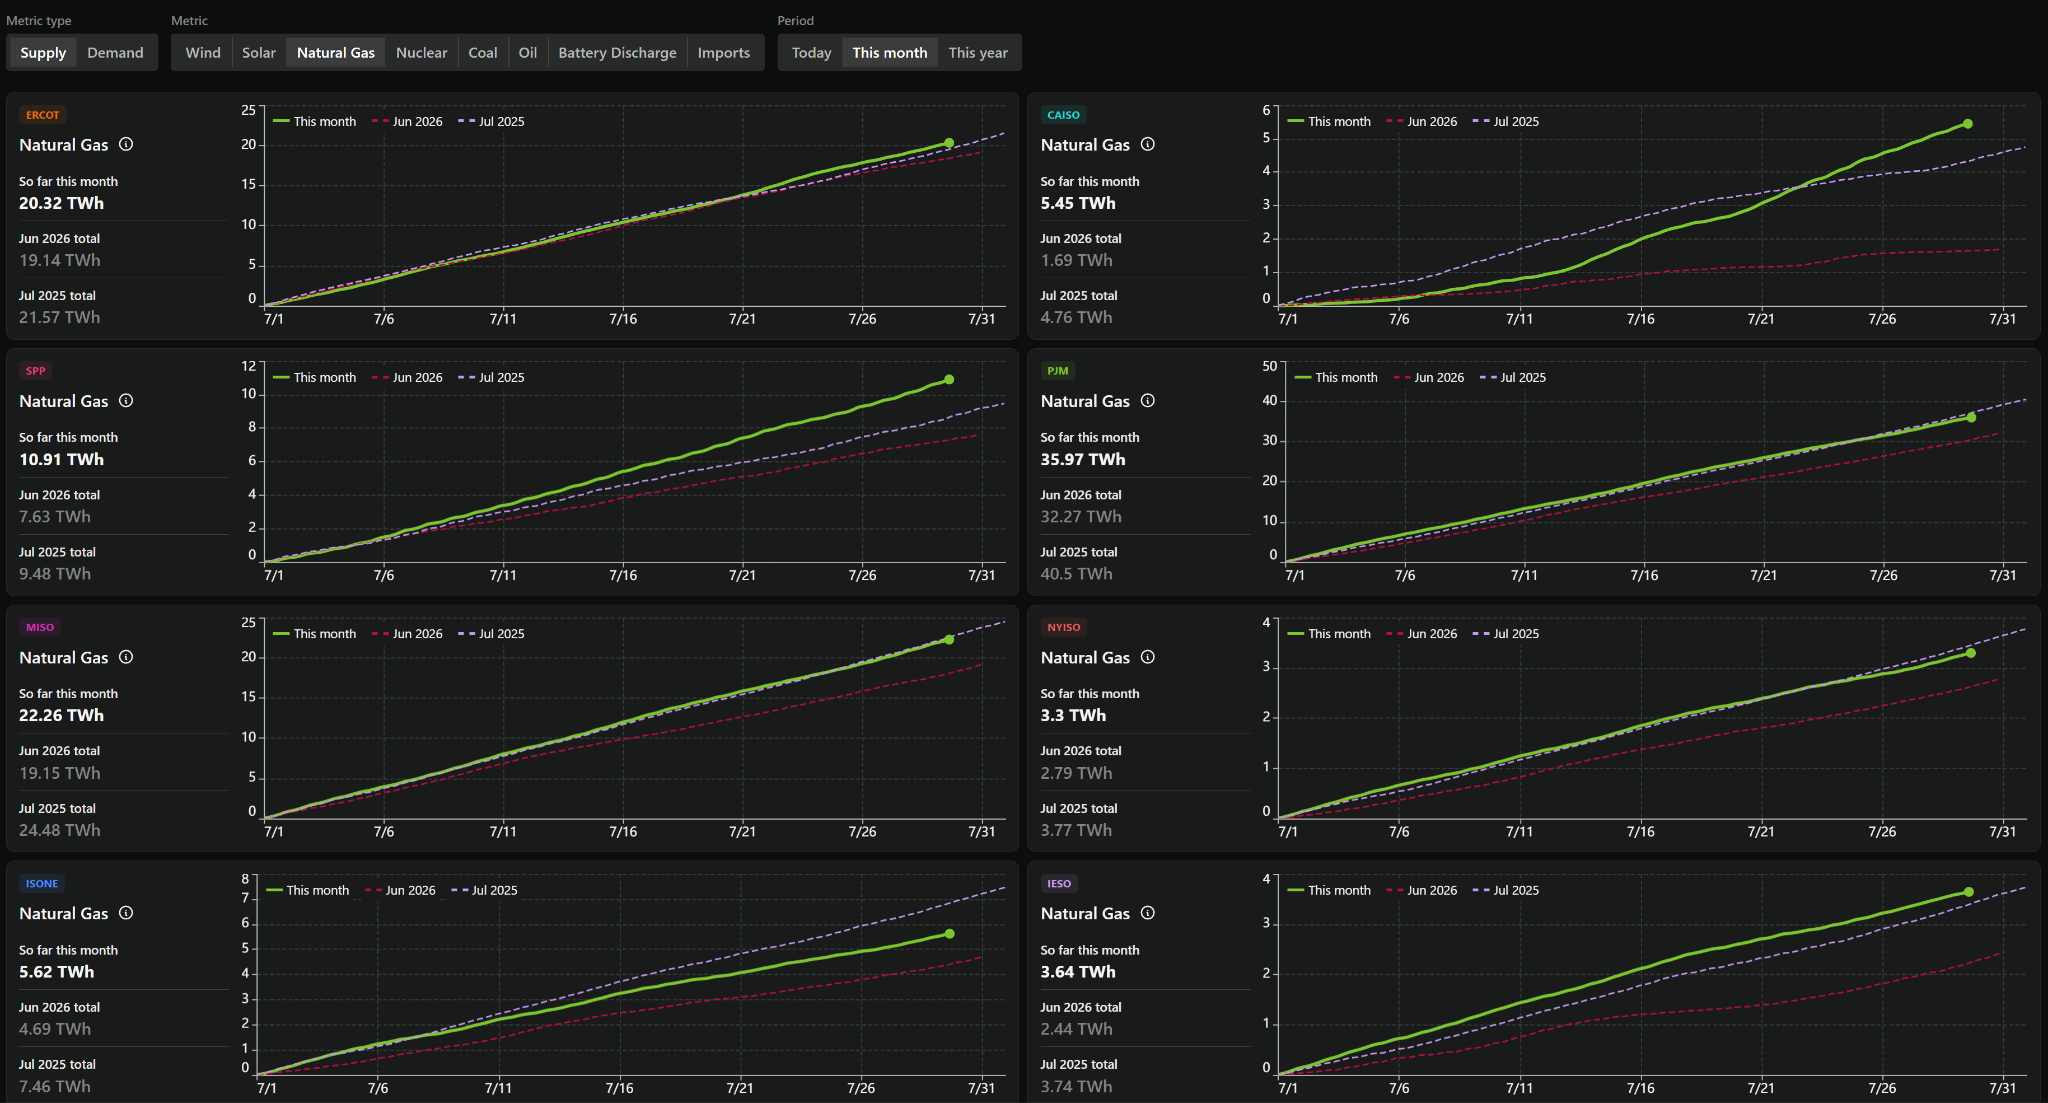
Using our new Trends App, we can track this July compared to the previous month and July 2025 at a glance across every market. SPP, IESO, and ERCOT are all tracking above 2025, at +26%, +7%, and +4% respectively, while MISO (-1%), ISO-NE (-18%), and PJM (-3%) are all below last July (excluding NYISO due to the dual fuel issue).
Natural gas prices increased during the heat wave as pipelines were constrained, allowing coal, which trades on longer-term contracts, a more competitive bid in the market. Additionally, midday solar likely ate into some natural gas generation year over year.
Grid Stress Continues
Typically, we publish an event coverage piece within days of an event. In this case, there was more content than ever to cover, but the systems across the country were also unrelenting in setting new records and coming under significant pressure.
Within two weeks of this heatwave, ERCOT had shattered its load record and set new net load, battery, and solar records as well. SPP’s West Balancing Authority entered EEA3 and then got back up to EEA2 again in a span of 72 hours. Natural gas generation in CAISO spiked, but so did exports.
Against that backdrop of market events (and not without relation to them), a panoply of regulatory proceedings are forging ahead. From evolution to revolution, we see the integration and management of large electronic loads reshaping administrative structures across the country, in secret, in public, and in formerly anodyne stakeholder calls.
It’s an exciting, stressful, and uncertain time on the grid, with no immediate end in sight for that milieu of complicated emotions and complex operational situations.
We’re tracking all of this and more in Grid Status Insights, which is undergoing a significant redesign over the next month. Check it out, and let us know what you think!