
Another Record Bites the Dust
At the end of July 2026, ERCOT managed to break its existing solar, battery discharge, load, and net load records in the span of 2 days. We're taking a look at the details, how everything tied together, and the future of the Texas grid.


July 22, 2026 might make it into the Hall of Fame for ERCOT. Let's look at some high hitters of the day, and possible strategy changes for the most popular team on the grid.
Similar to the Texas Rangers, ERCOT hits it out of the Park
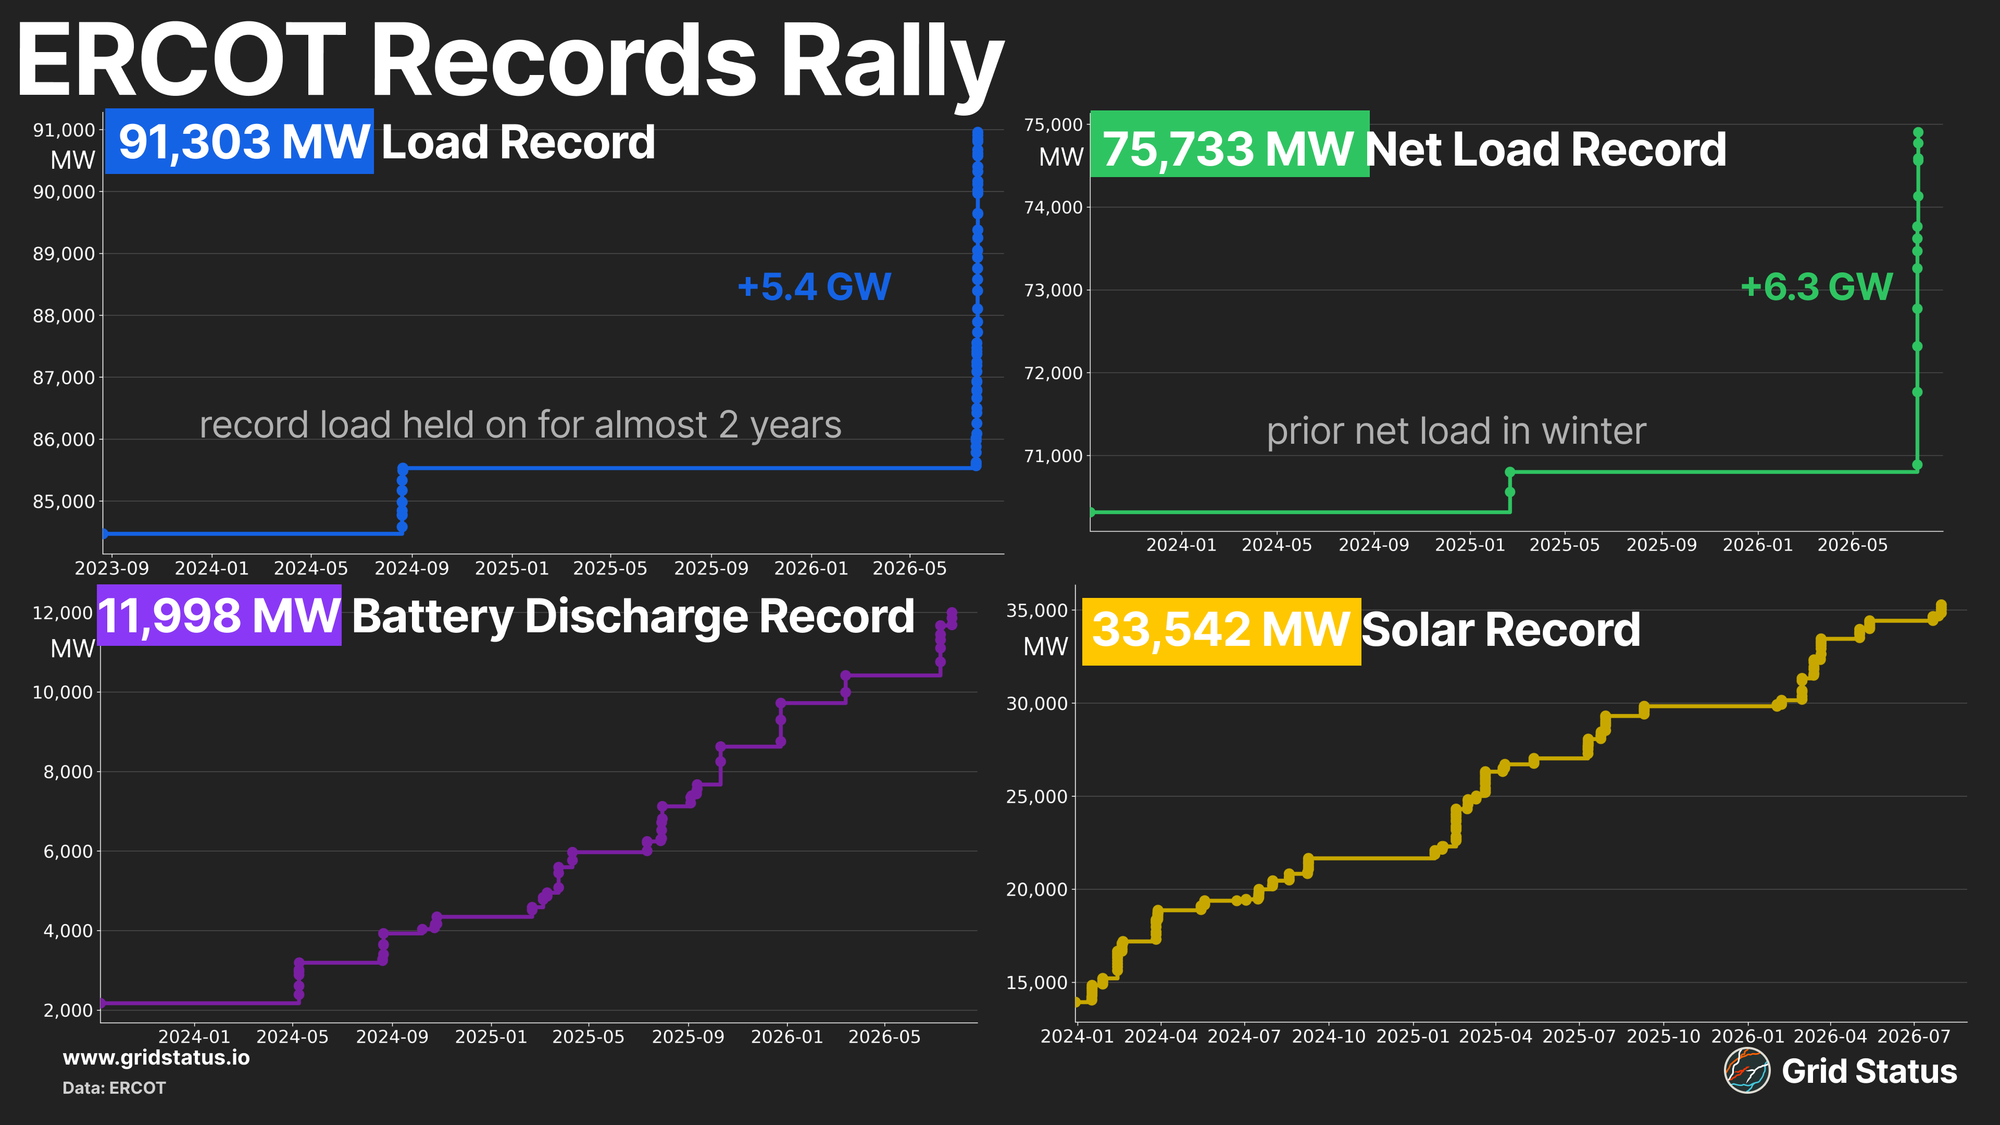
The week of July 20th, 2026 ERCOT set out to prove an adage: everything is bigger in Texas. In the span of just 2 days, ERCOT managed to break its existing solar, battery discharge, load, and net load records. In some cases, multiple times over.
While both Texans and the grid were under extreme heat and humidity, prices barely broke a sweat. Let’s take a look at the details of the week, how everything tied together, and what we can expect from Texas in the future.
Load Soars to New Heights
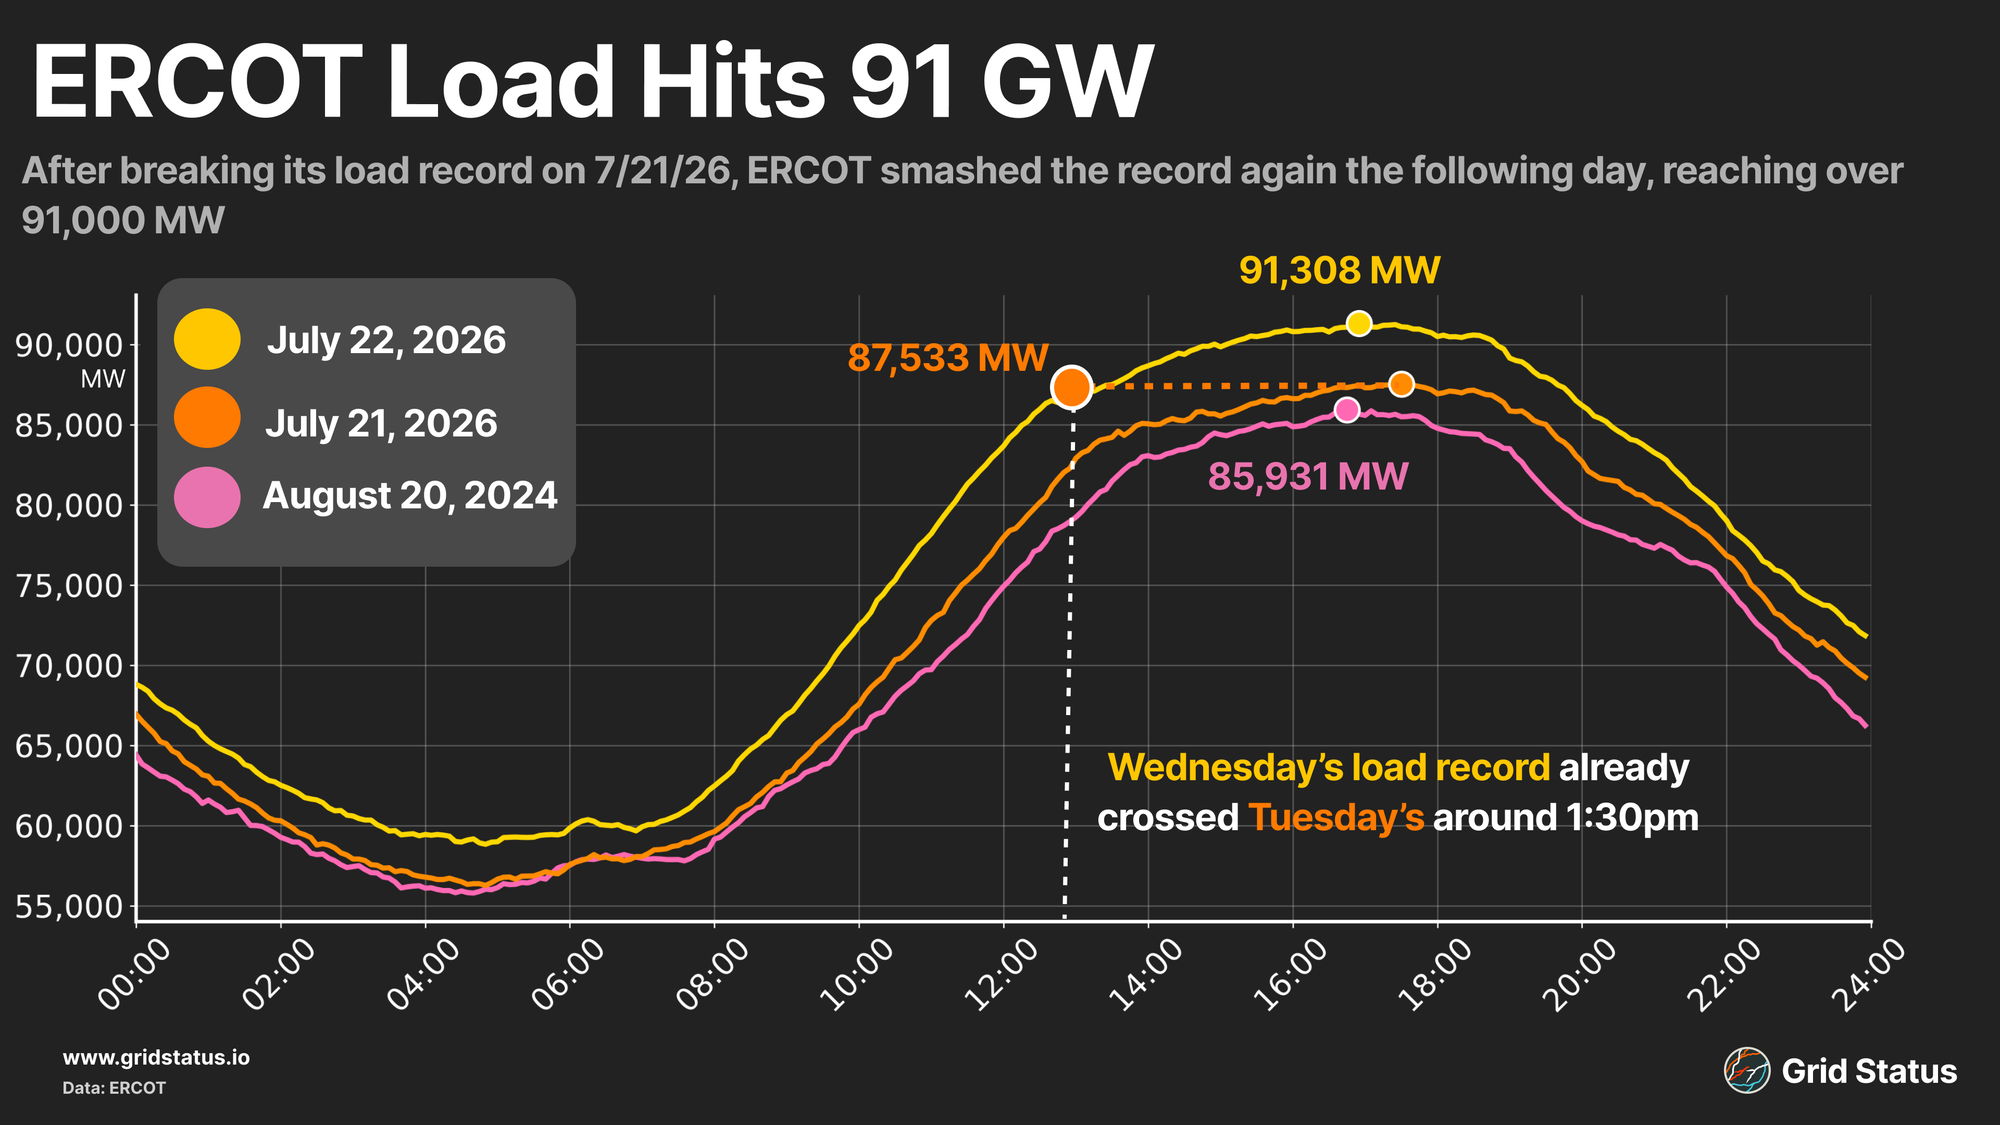
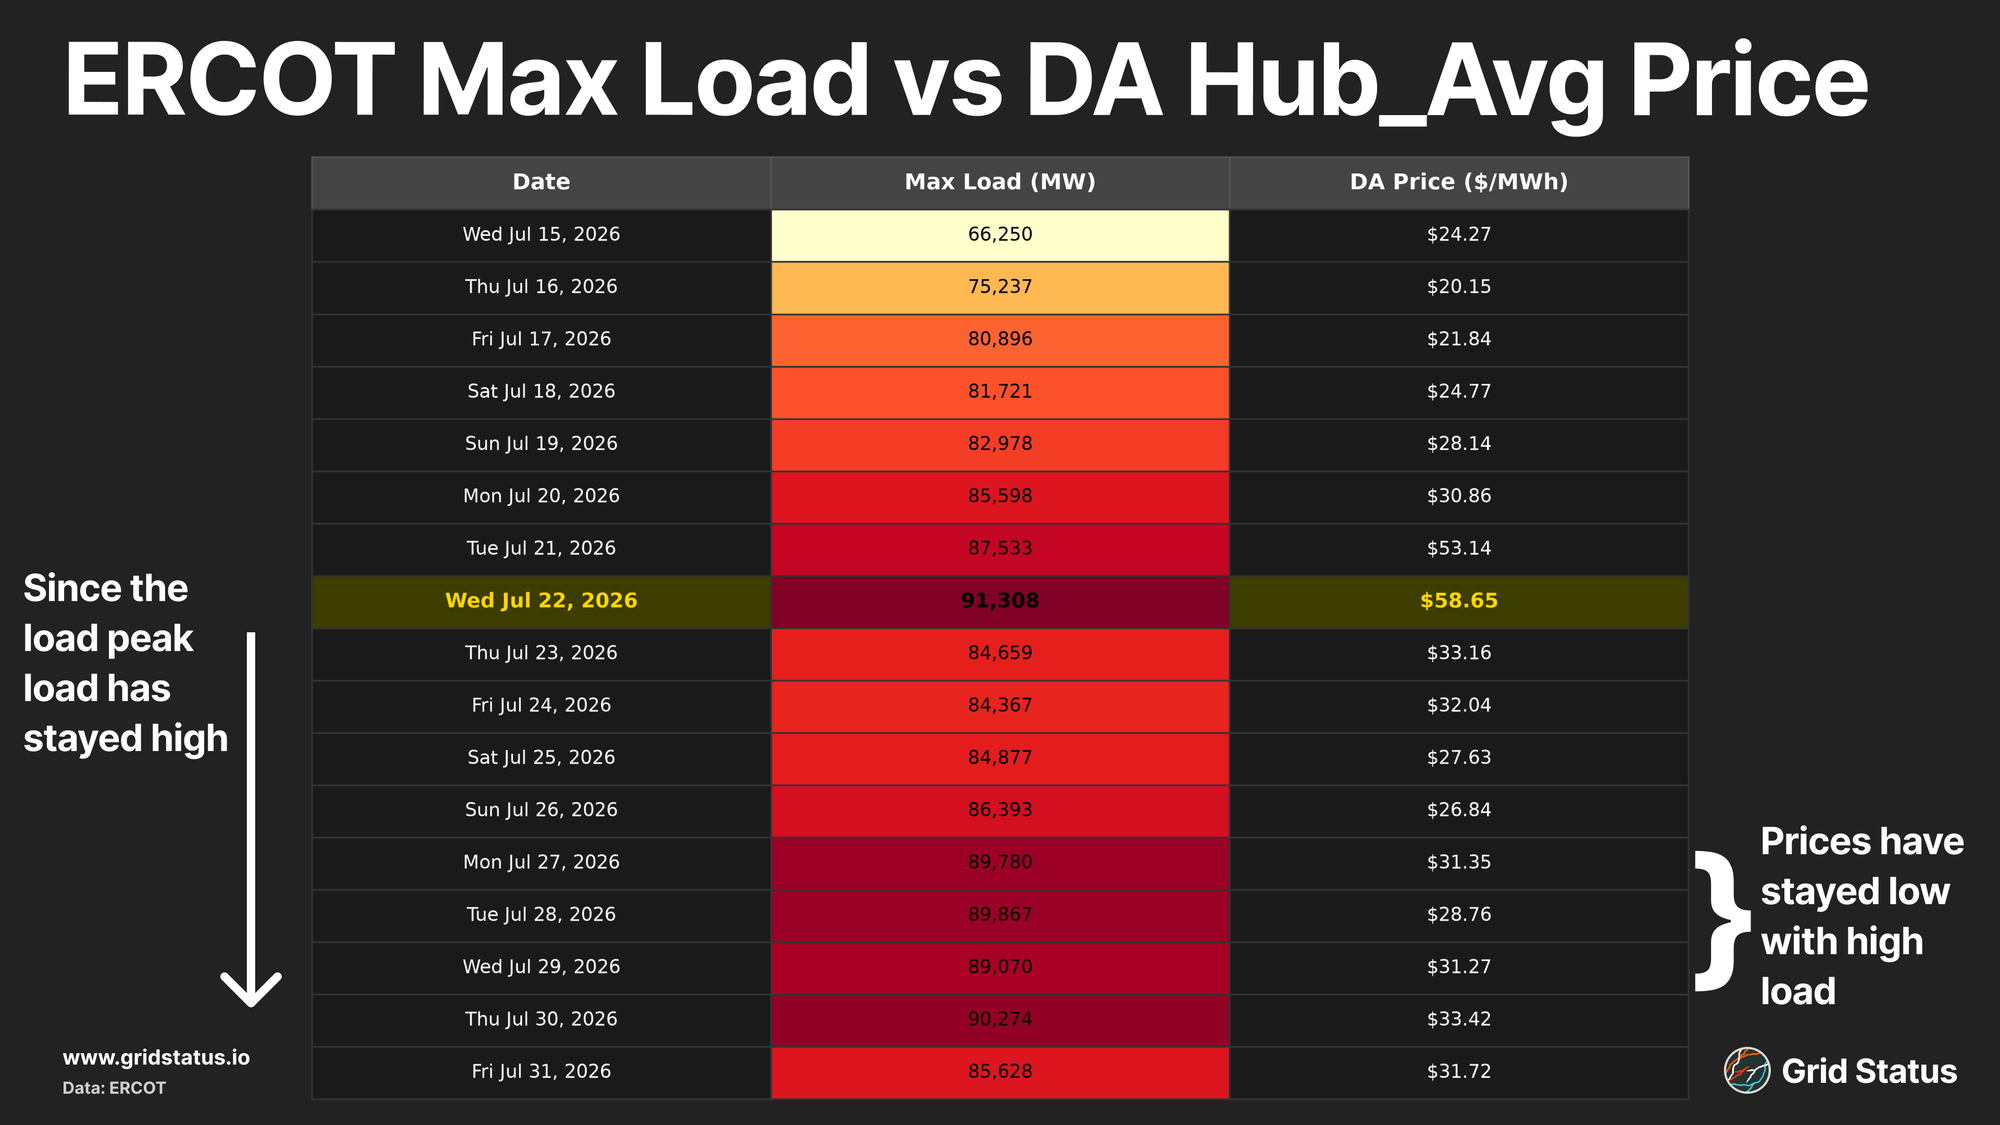
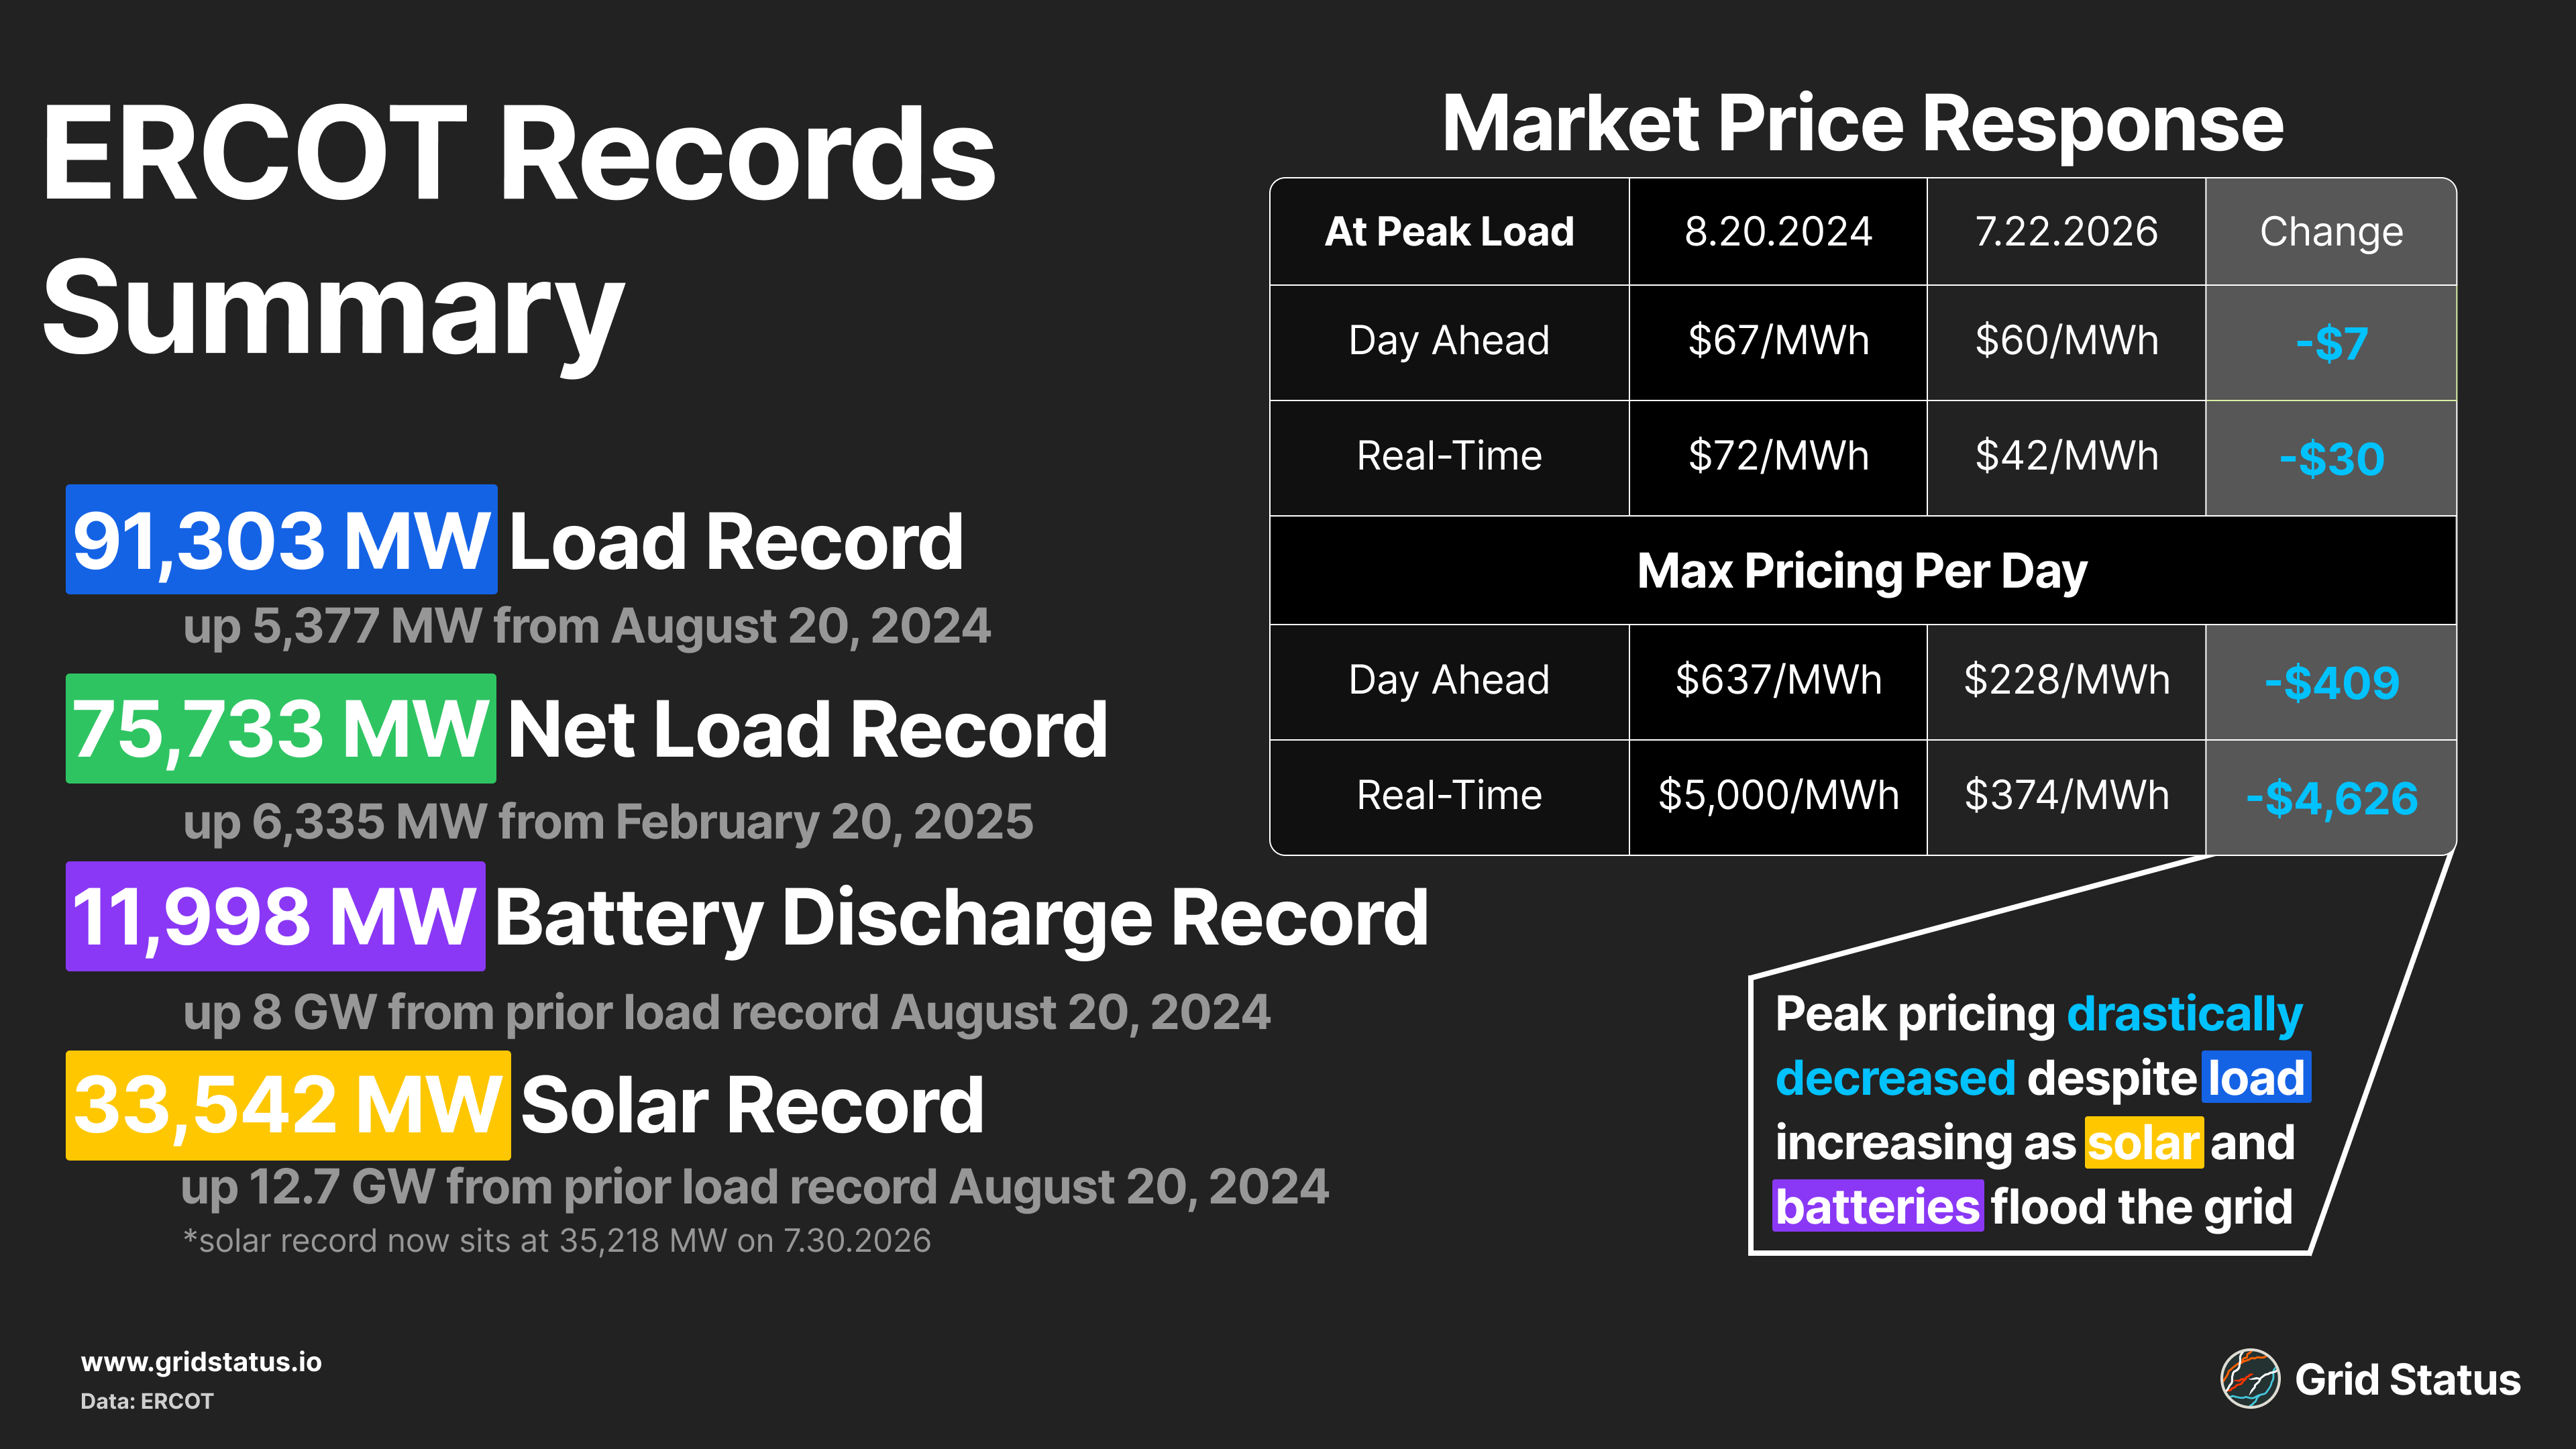
ERCOT load did not slow down at any point on Wednesday, July 22nd, due to high heat in cities across Texas, and the grid set its new all-time load record of 91,308 MW. This record had been set just the day before, which reached 87,533 MW, beating the August 20, 2024 record by ~1.5 GW. With a multiple GW increase, the new load record wasn’t just broken, it was absolutely smashed.
Load on the 22nd broke the prior day's peak of 87,533 MW early in the afternoon, just after 12 pm, and didn't slow down. It kept climbing, tracking well above the forecast into the early evening, eventually peaking above 91 GW.
Typically, in summer months, voluntary load curtailment from large loads materializes in an effort to avoid the Coincident Peak, but Wednesday’s demand was high enough to blow through any early afternoon reductions from flexible consumers. Coincident peak pressure can also impact load forecasts. Adjusting the forecasted peak demand down from what fundamentally would be expected in the absence of such a program.
Net Load Record Joins the Fun
Load itself wasn’t alone in setting a record on Wednesday, as net load also reached a new high. Net load, which is load minus both wind and solar generation, represents how much power must be supplied by dispatchable generation. Despite record-high solar the day prior, extremely low wind allowed net load to reach 75,733 MW around 8 pm.
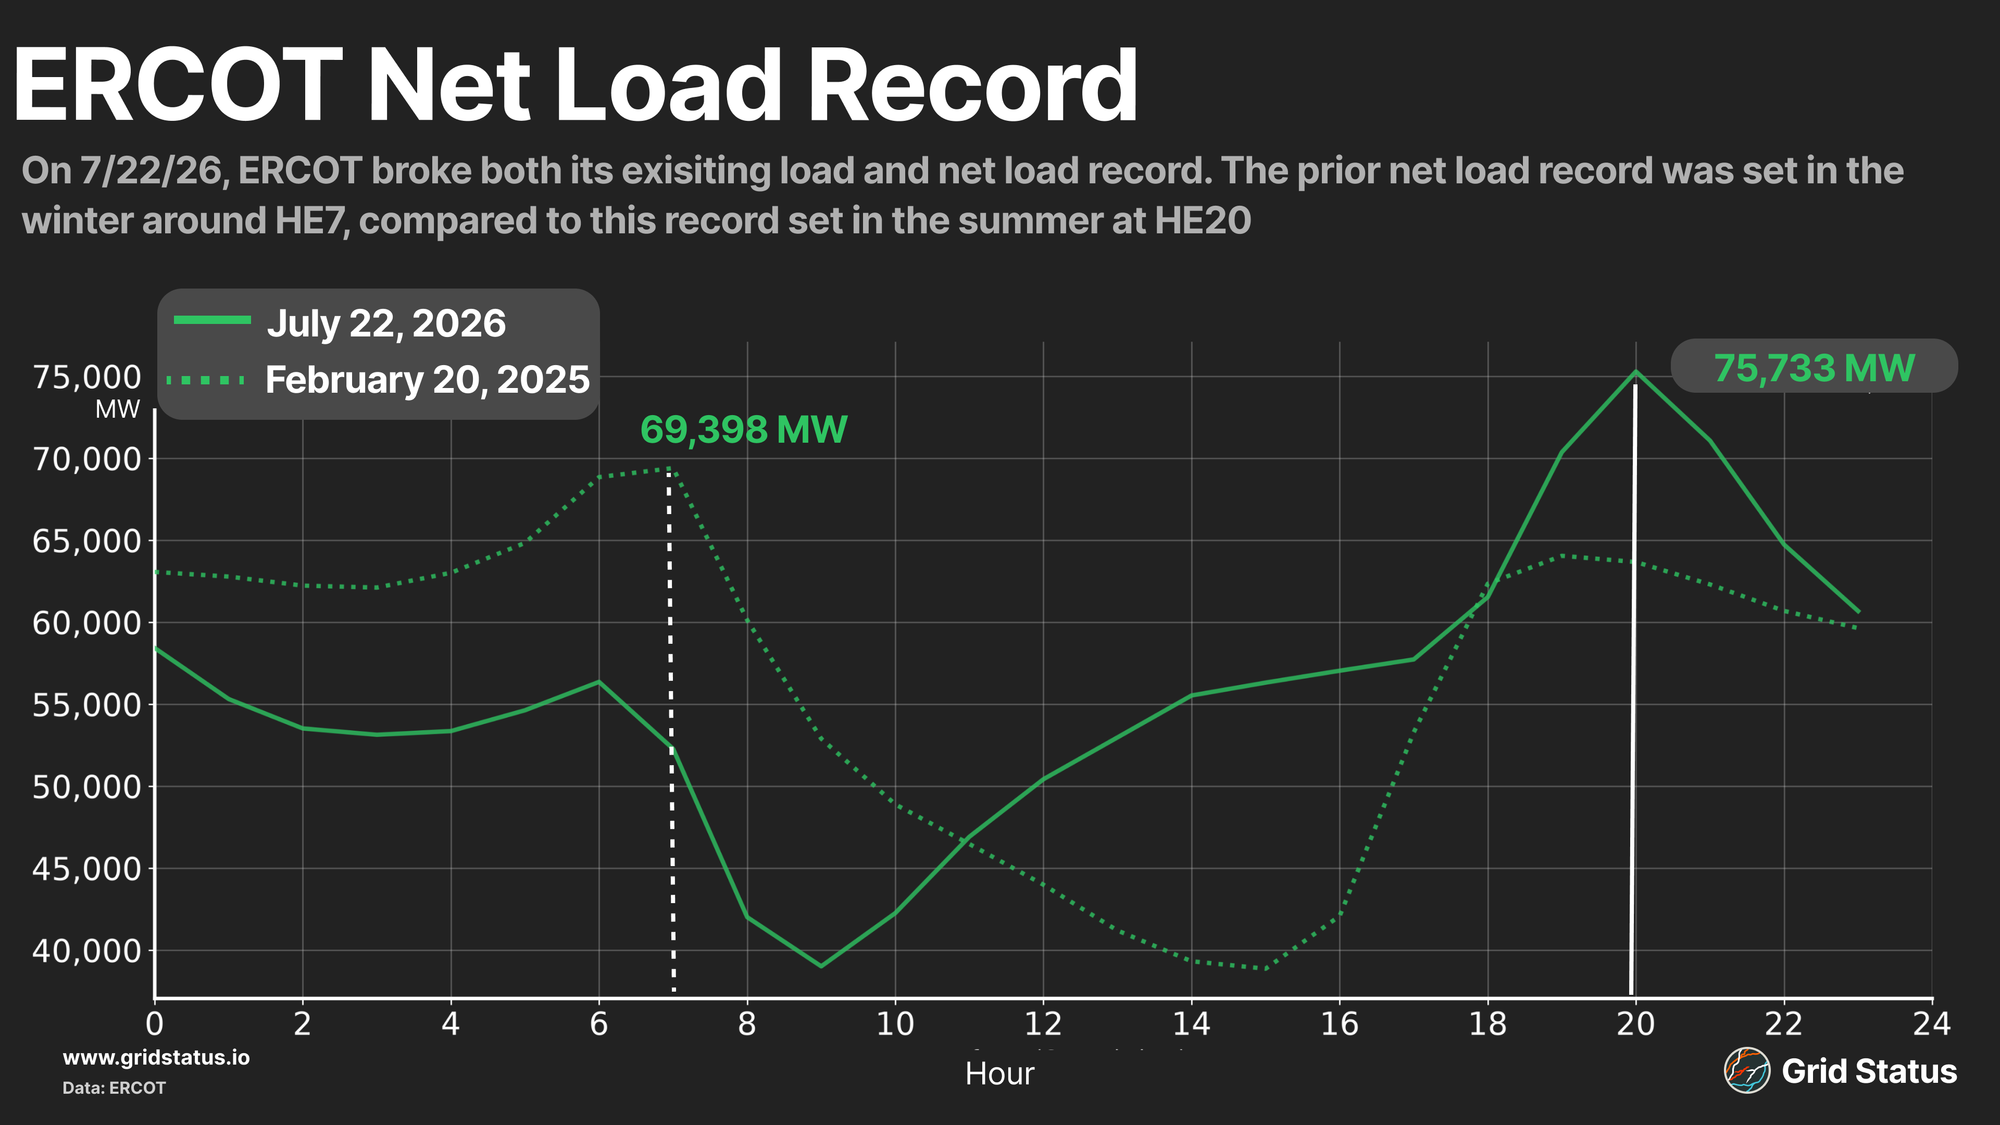
The prior net load record was 68,398 MW, set on the morning of February 20, 2025. Notably, as the date would suggest, this record was set during a cold, winter morning. While most grids tend to be summer-peaking, ERCOT, as well as much of the south, can see high load in the winter due to elevated demand from electric heating. This heating demand often peaks before sunrise, when temperatures tend to be near their lowest, and before solar generation is online. In this case, high heating load, paired with weak wind and little contribution from solar, drove the net load record.
Despite hitting record solar the day prior, the sun eventually sets, and when it does, net load ramps up, and other generation must come alive to support the grid. Elevated DA clears were seen during this time as more expensive generation had to step into the grid.
Natural gas was the leading fuel source during this time, followed by power storage, coal, and wind. Real-time prices, however, tracked below the day-ahead during the net load peak, and didn't see upside pressure until battery discharge fell off.
Summer Sun and Battery Runs
It’s no secret that solar and battery power have been growing, largely in tandem, in the Lone Star State, with plentiful land and friendly market rules. Solar power reached 34,665 MW on Tuesday, July 21, a new record at the time; enabled by both high load and low wind. Solar’s sister, batteries, also saw a new discharge record, hitting 11,980 MW on Wednesday, July 22.
The increase in solar and battery is even more apparent when you compare it to the prior load record on August 20, 2024. Peak solar output jumped 12.7 GW while Battery Discharge jumped 8 GW at the evening peak.
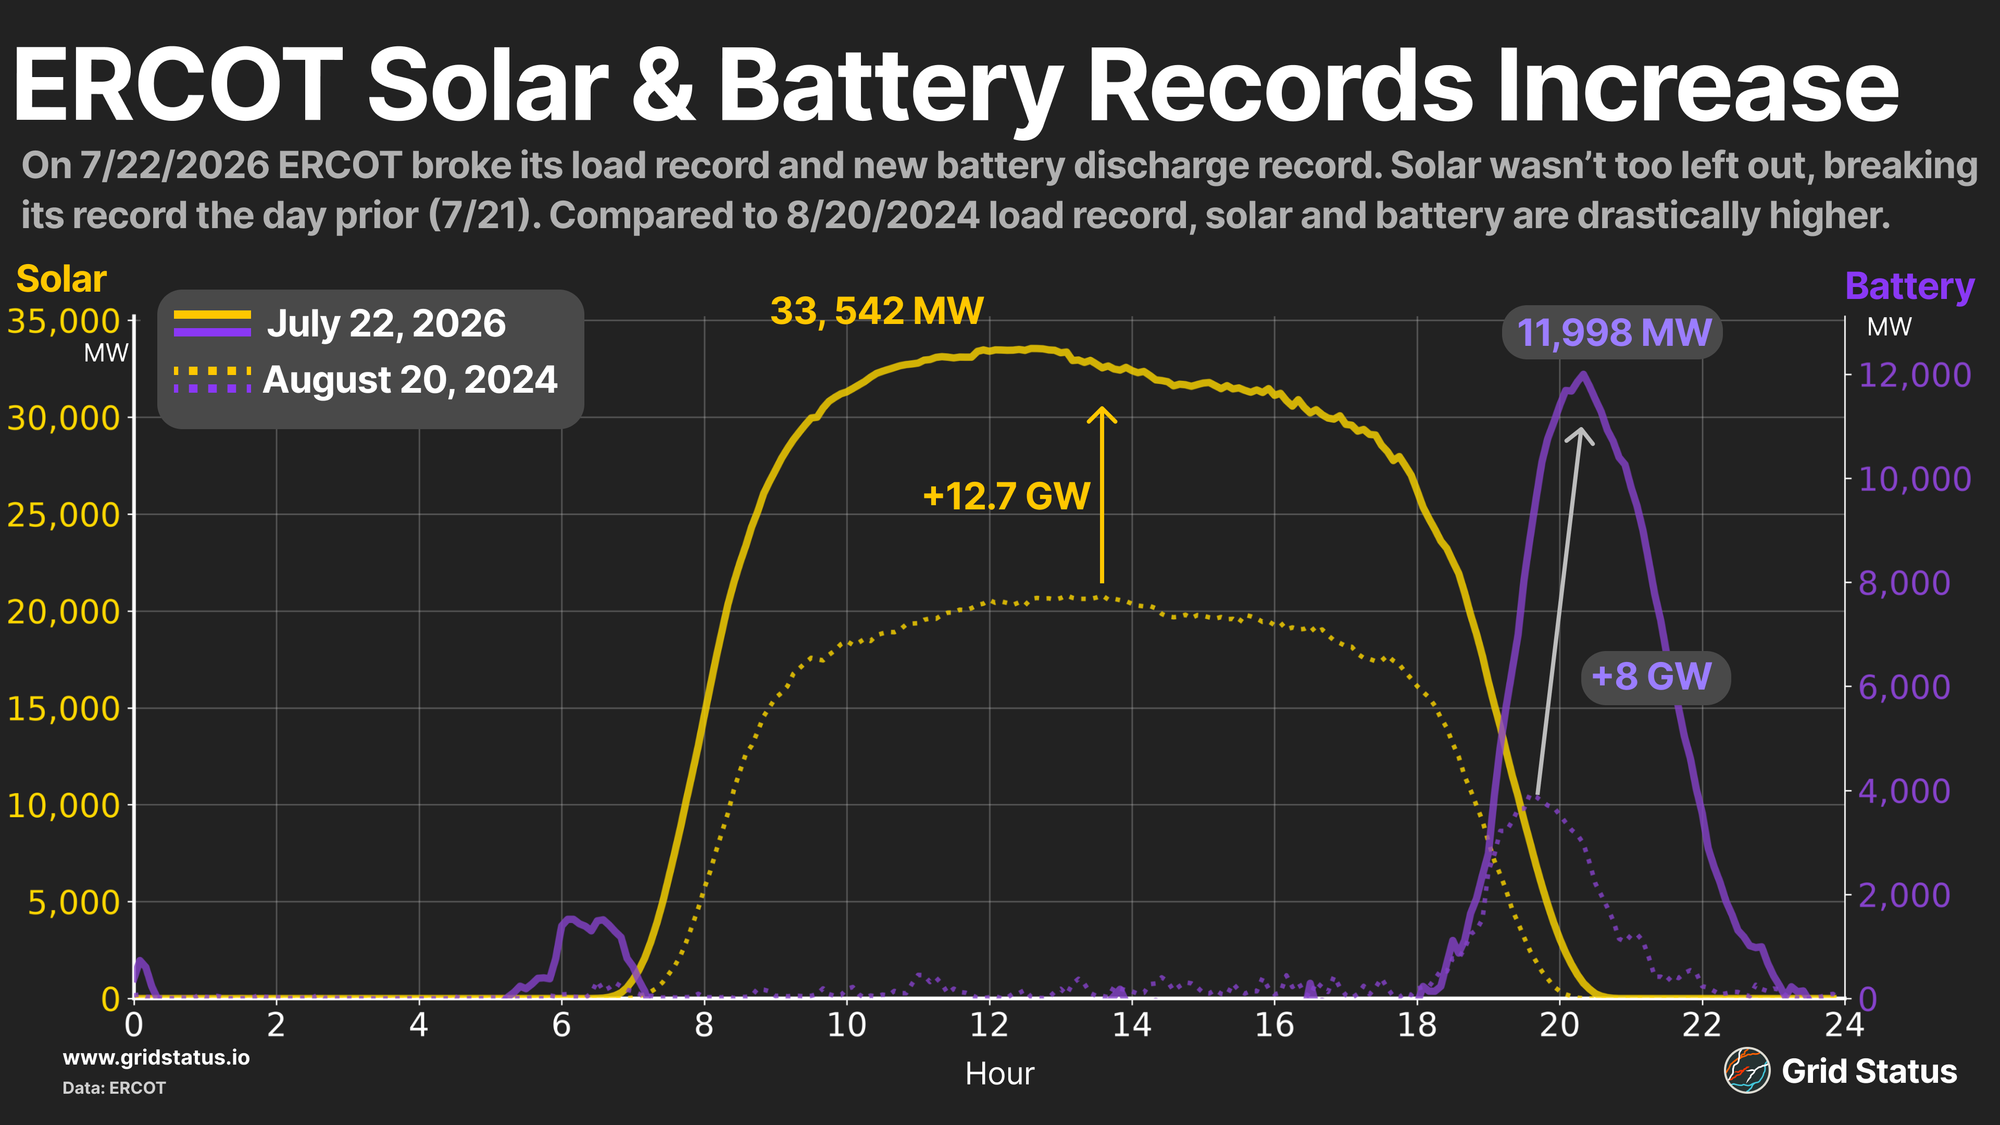
The increase in output from these units (particularly solar) kept substantial downward pressure on prices during a period with such a high load.
Lost in the Outfield: High Prices
As load soared to new heights, we would expect prices to follow close behind, but the most shocking part of the week might have been the lack of meaningful price action. Both day-head and real-time prices tracked well below what had been seen during the last load record two years ago.
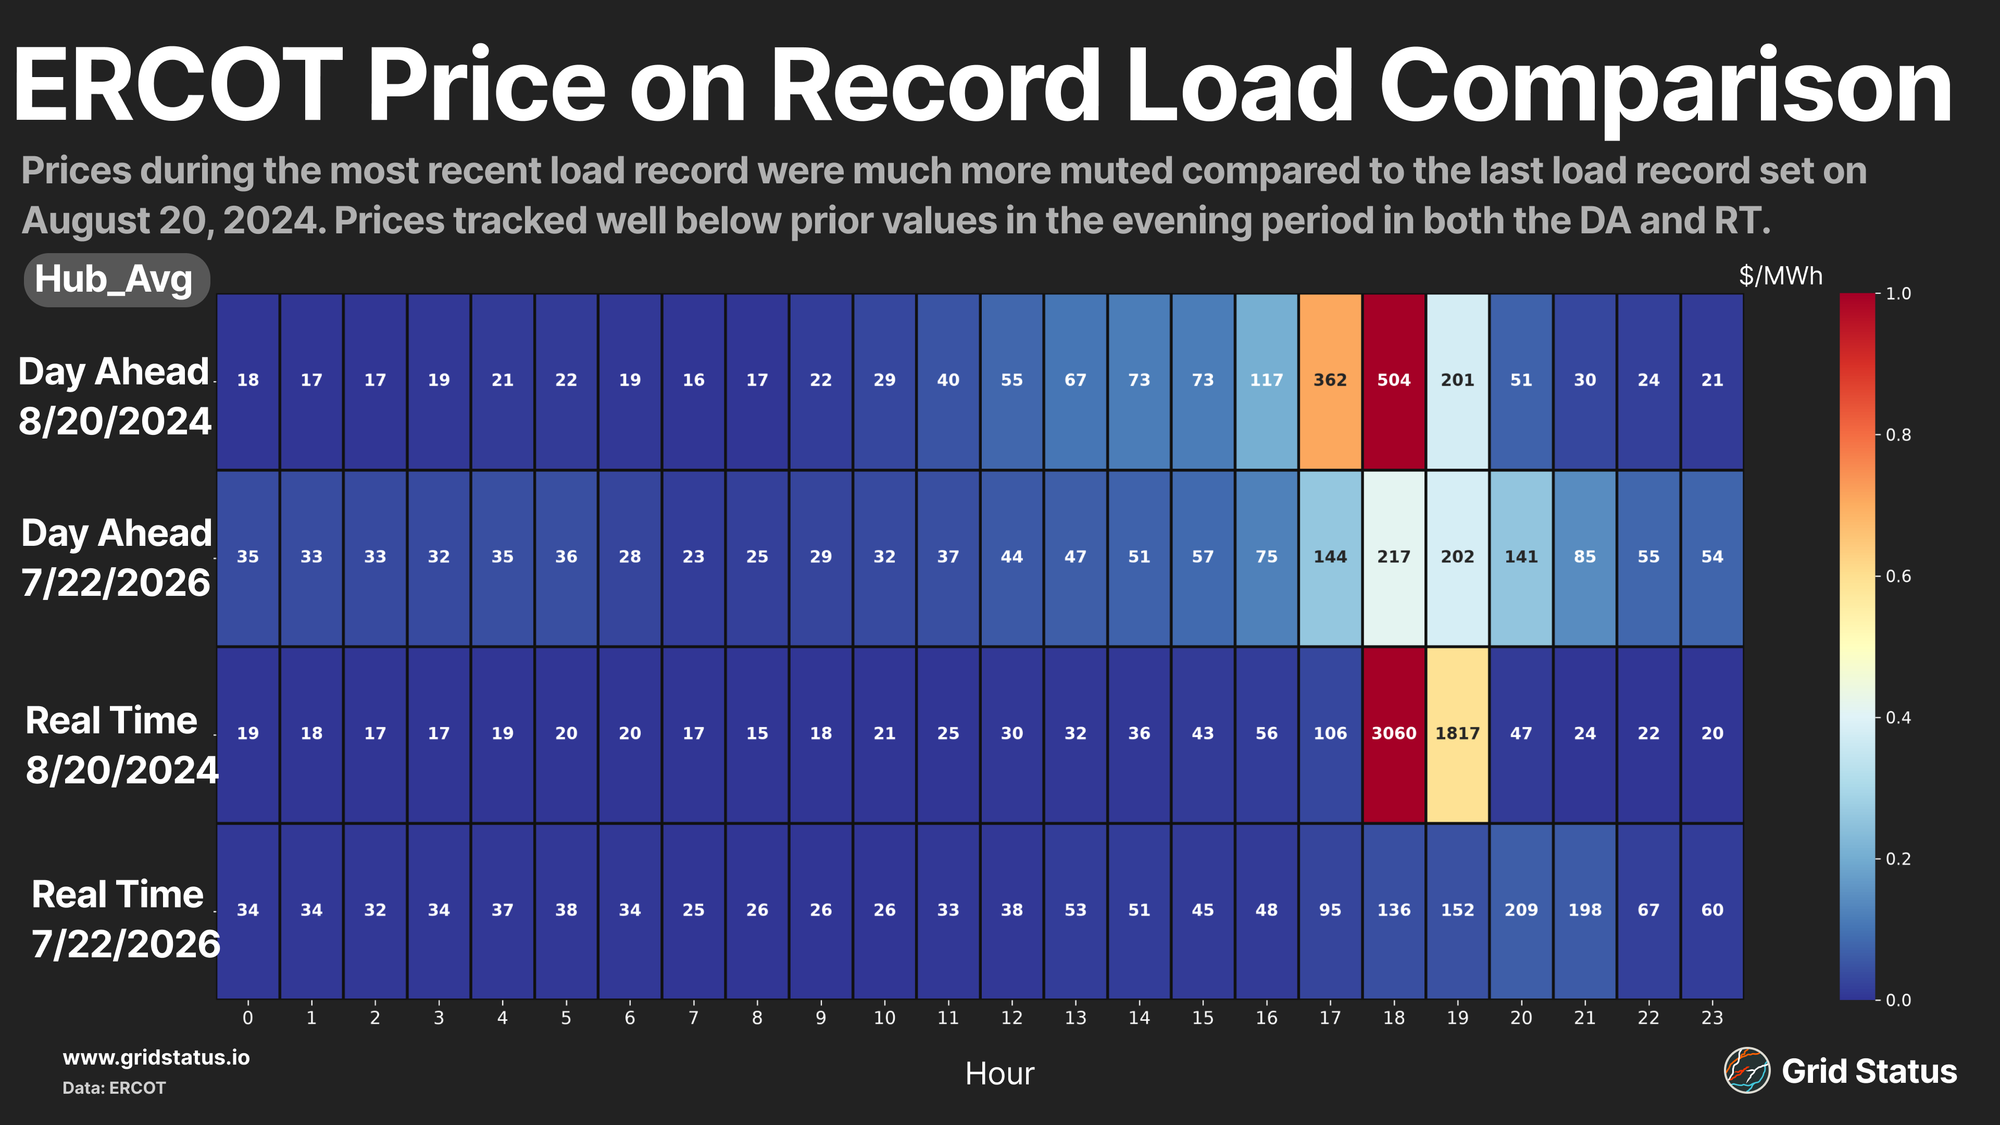
The day-ahead difference in highs was about $300/MWh. The day-ahead market saw upside to prices occurring later in the day, which might have been from additional battery discharging. On 8.20.2024, real-time prices exploded, reaching the market cap of $5000/MWh and even averaging $3000/MWh at 6 pm. Conversely, on 7.22.2026, real-time prices stayed comparatively muted, tracking below the DA and not seeing upside price pressure until 10 pm when battery discharge fell off.
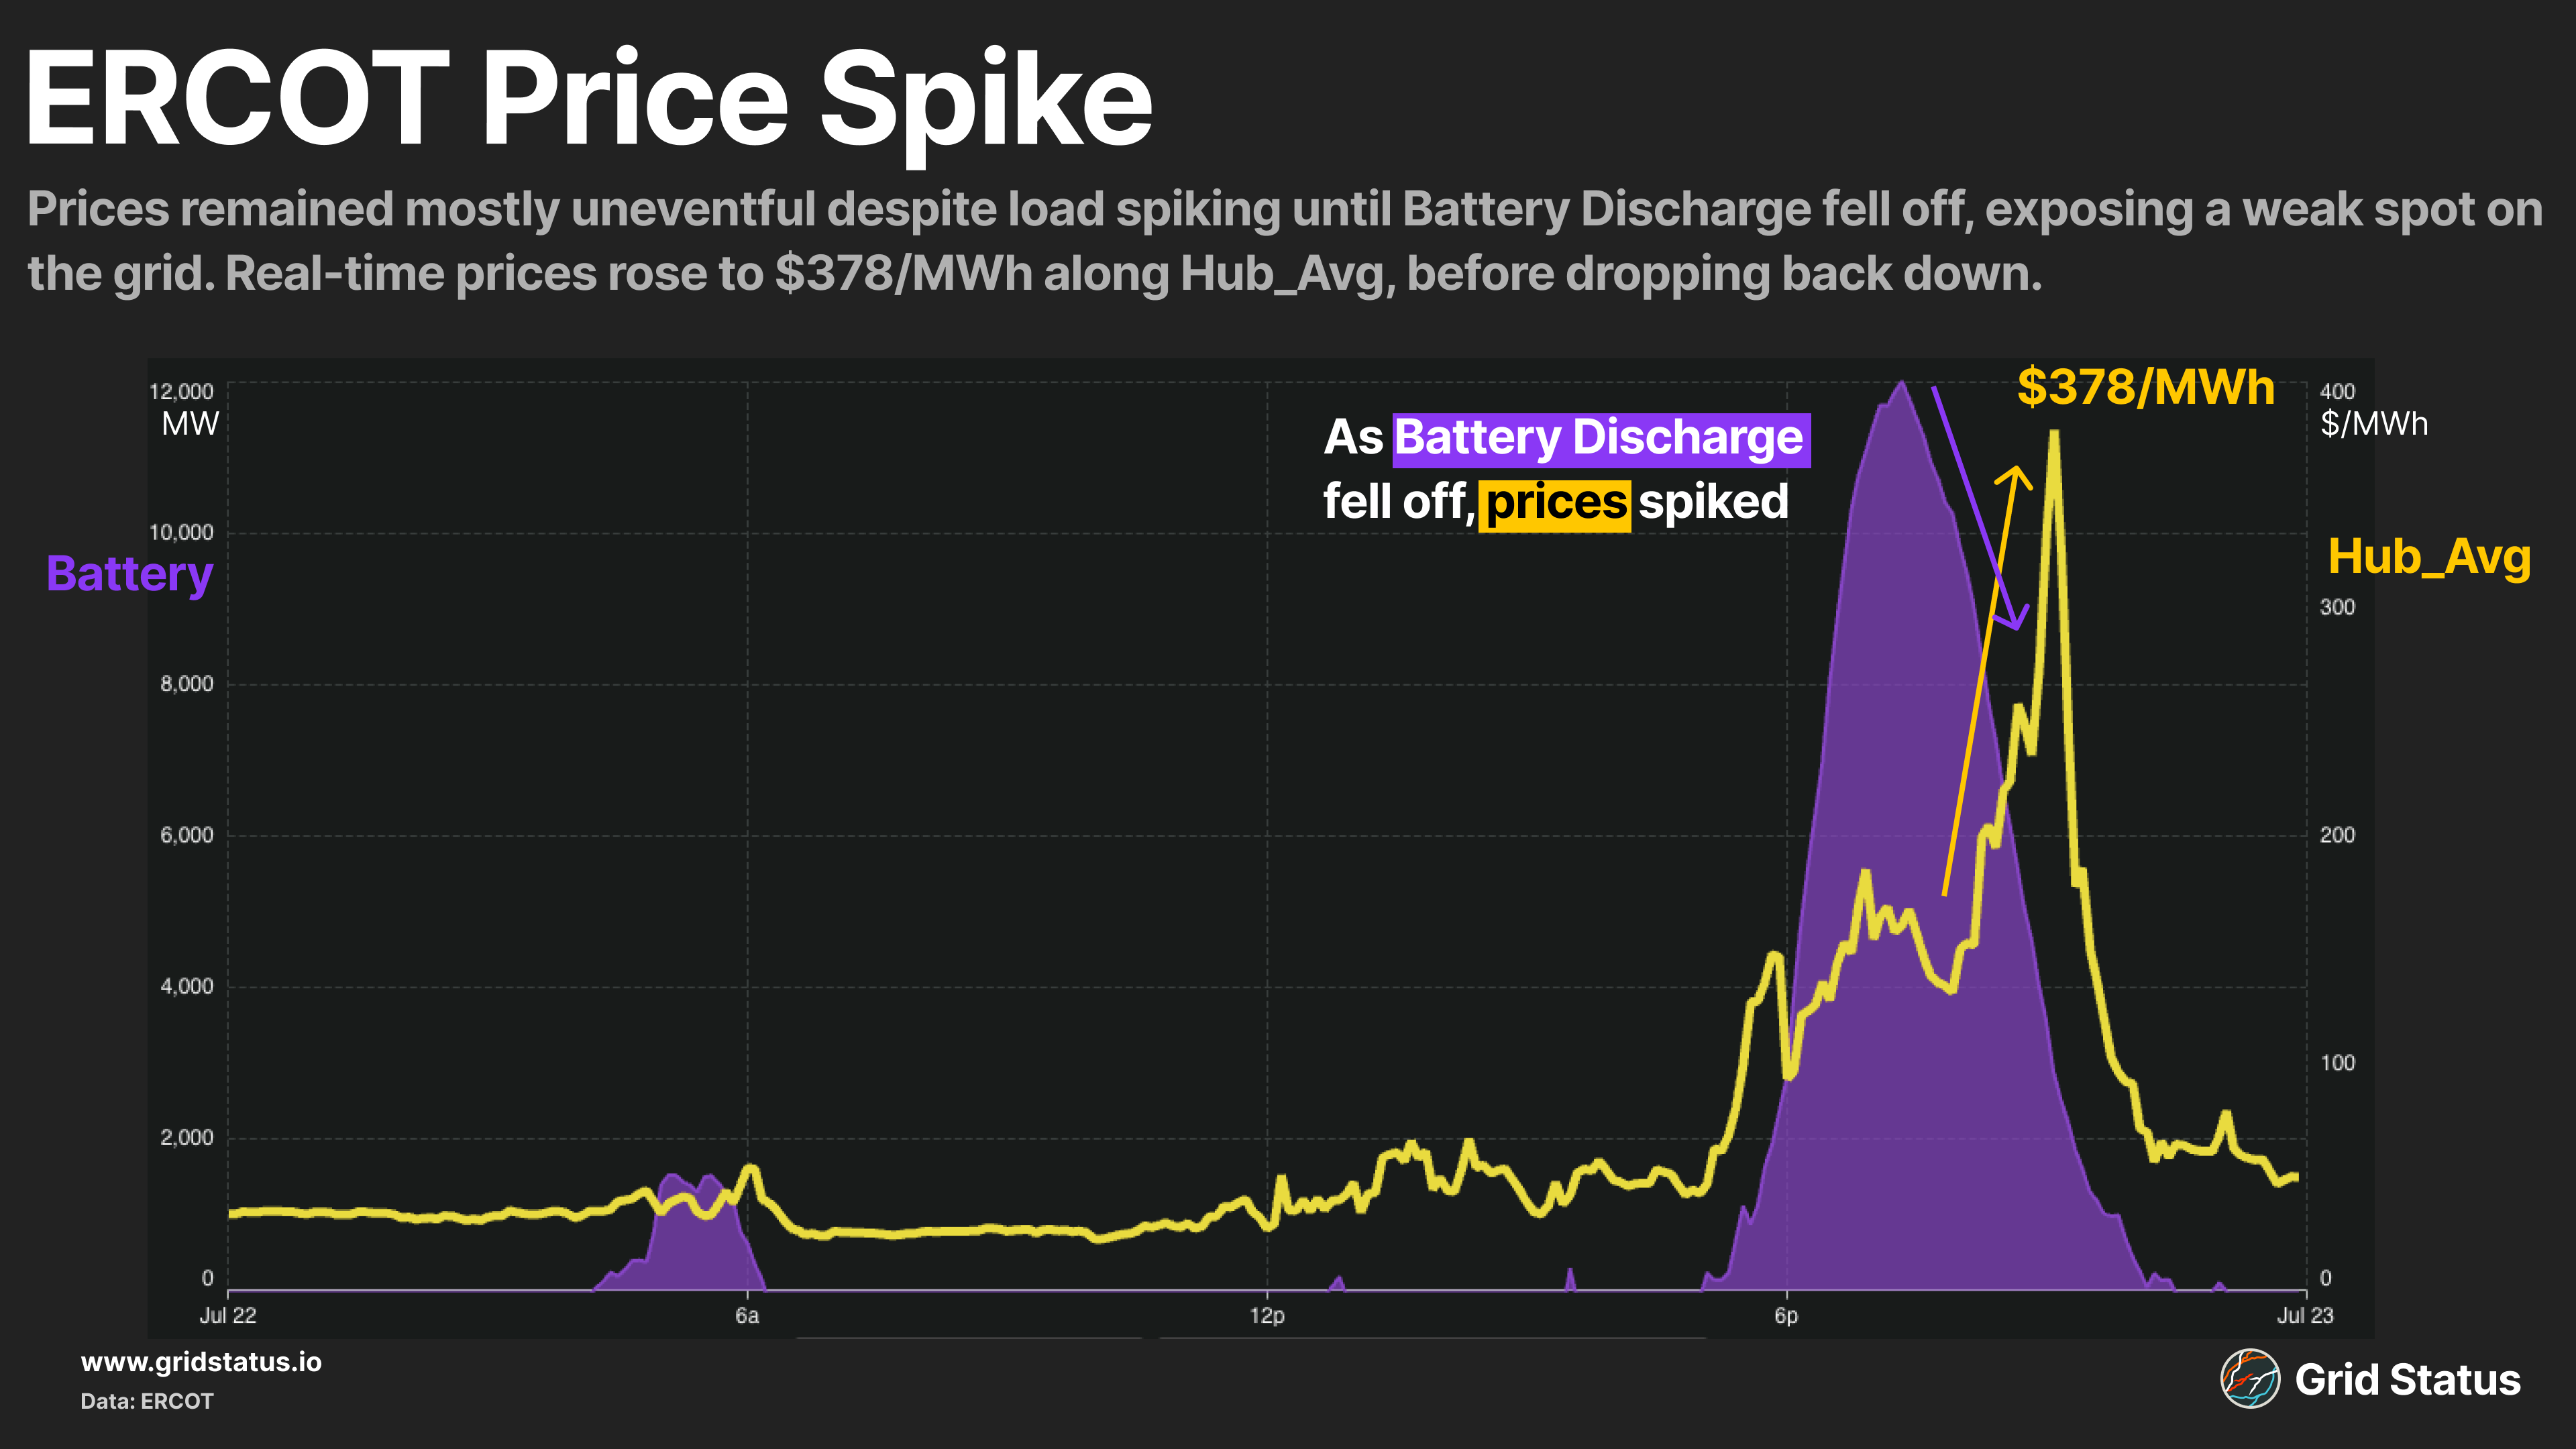
Volatility emerged as battery discharge fell off, but even this was much weaker compared to the August 2024 record peak. Real-time prices only reached $378/MWh, well below the $5,000/MWh market cap that was hit at the prior peak. Lower prices suggest a well-supplied stack, and despite a new net load record, renewables certainly helped. Beyond the impact of daytime solar generation, an increase in battery discharge over the evening peak helped to limit the RT price volatility seen in years past.
Despite load overperformance over the record peak, prices were largely under control over the evening peak, increasing with load but largely remaining stable.
Load was also high enough, over a large enough area, that we saw limited influence from congestion.
Instead of large pockets separating as local demand and generation failed to move in lock-step with the system, the prevalence of high load essentially everywhere led to a somewhat easier-to-manage system in the price context.
ERCOT’s VIP Player
While the addition of solar/battery certainly helped keep prices lower, no fuel went untouched in helping keep the lights on and the house cool for Texans across the state. Natural gas was the leading fuel during the Net Load Peak.
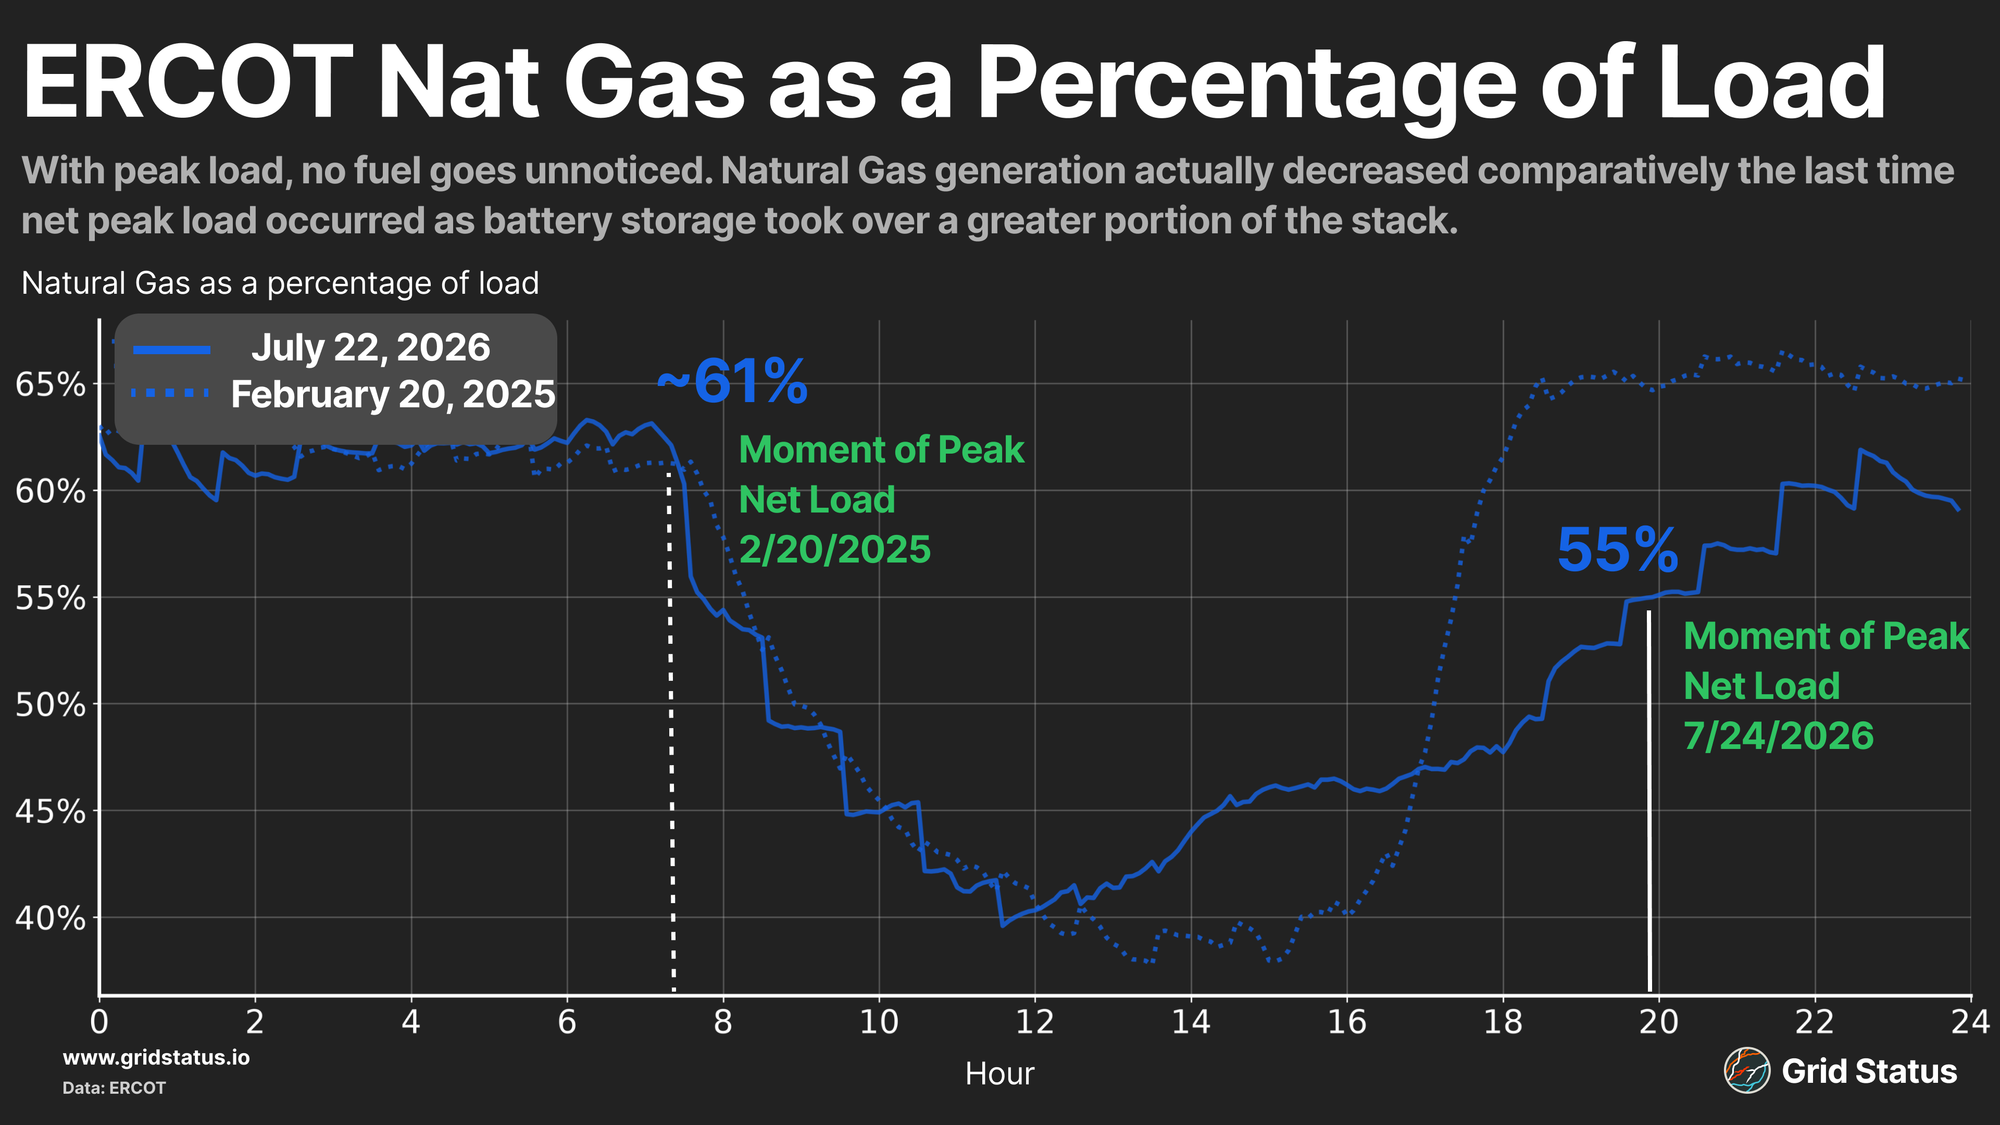
Despite contributing ~55% of the generation to meet load during this time, natural gas actually decreased as a percentage of load from the prior net load peak, set on February 20, 2025. This is likely due to battery discharge helping out during the evening. Over the entire early-morning off-peak, however, natural gas met a similar percentage of load during each of these days.
Batteries in ERCOT tend to have only 1-2 hours of duration, limiting the extent to which midday solar can be moved into the later evening. Ultimately, other fuels are still heavily relied on as the night progresses.
How did the Rookie Perform
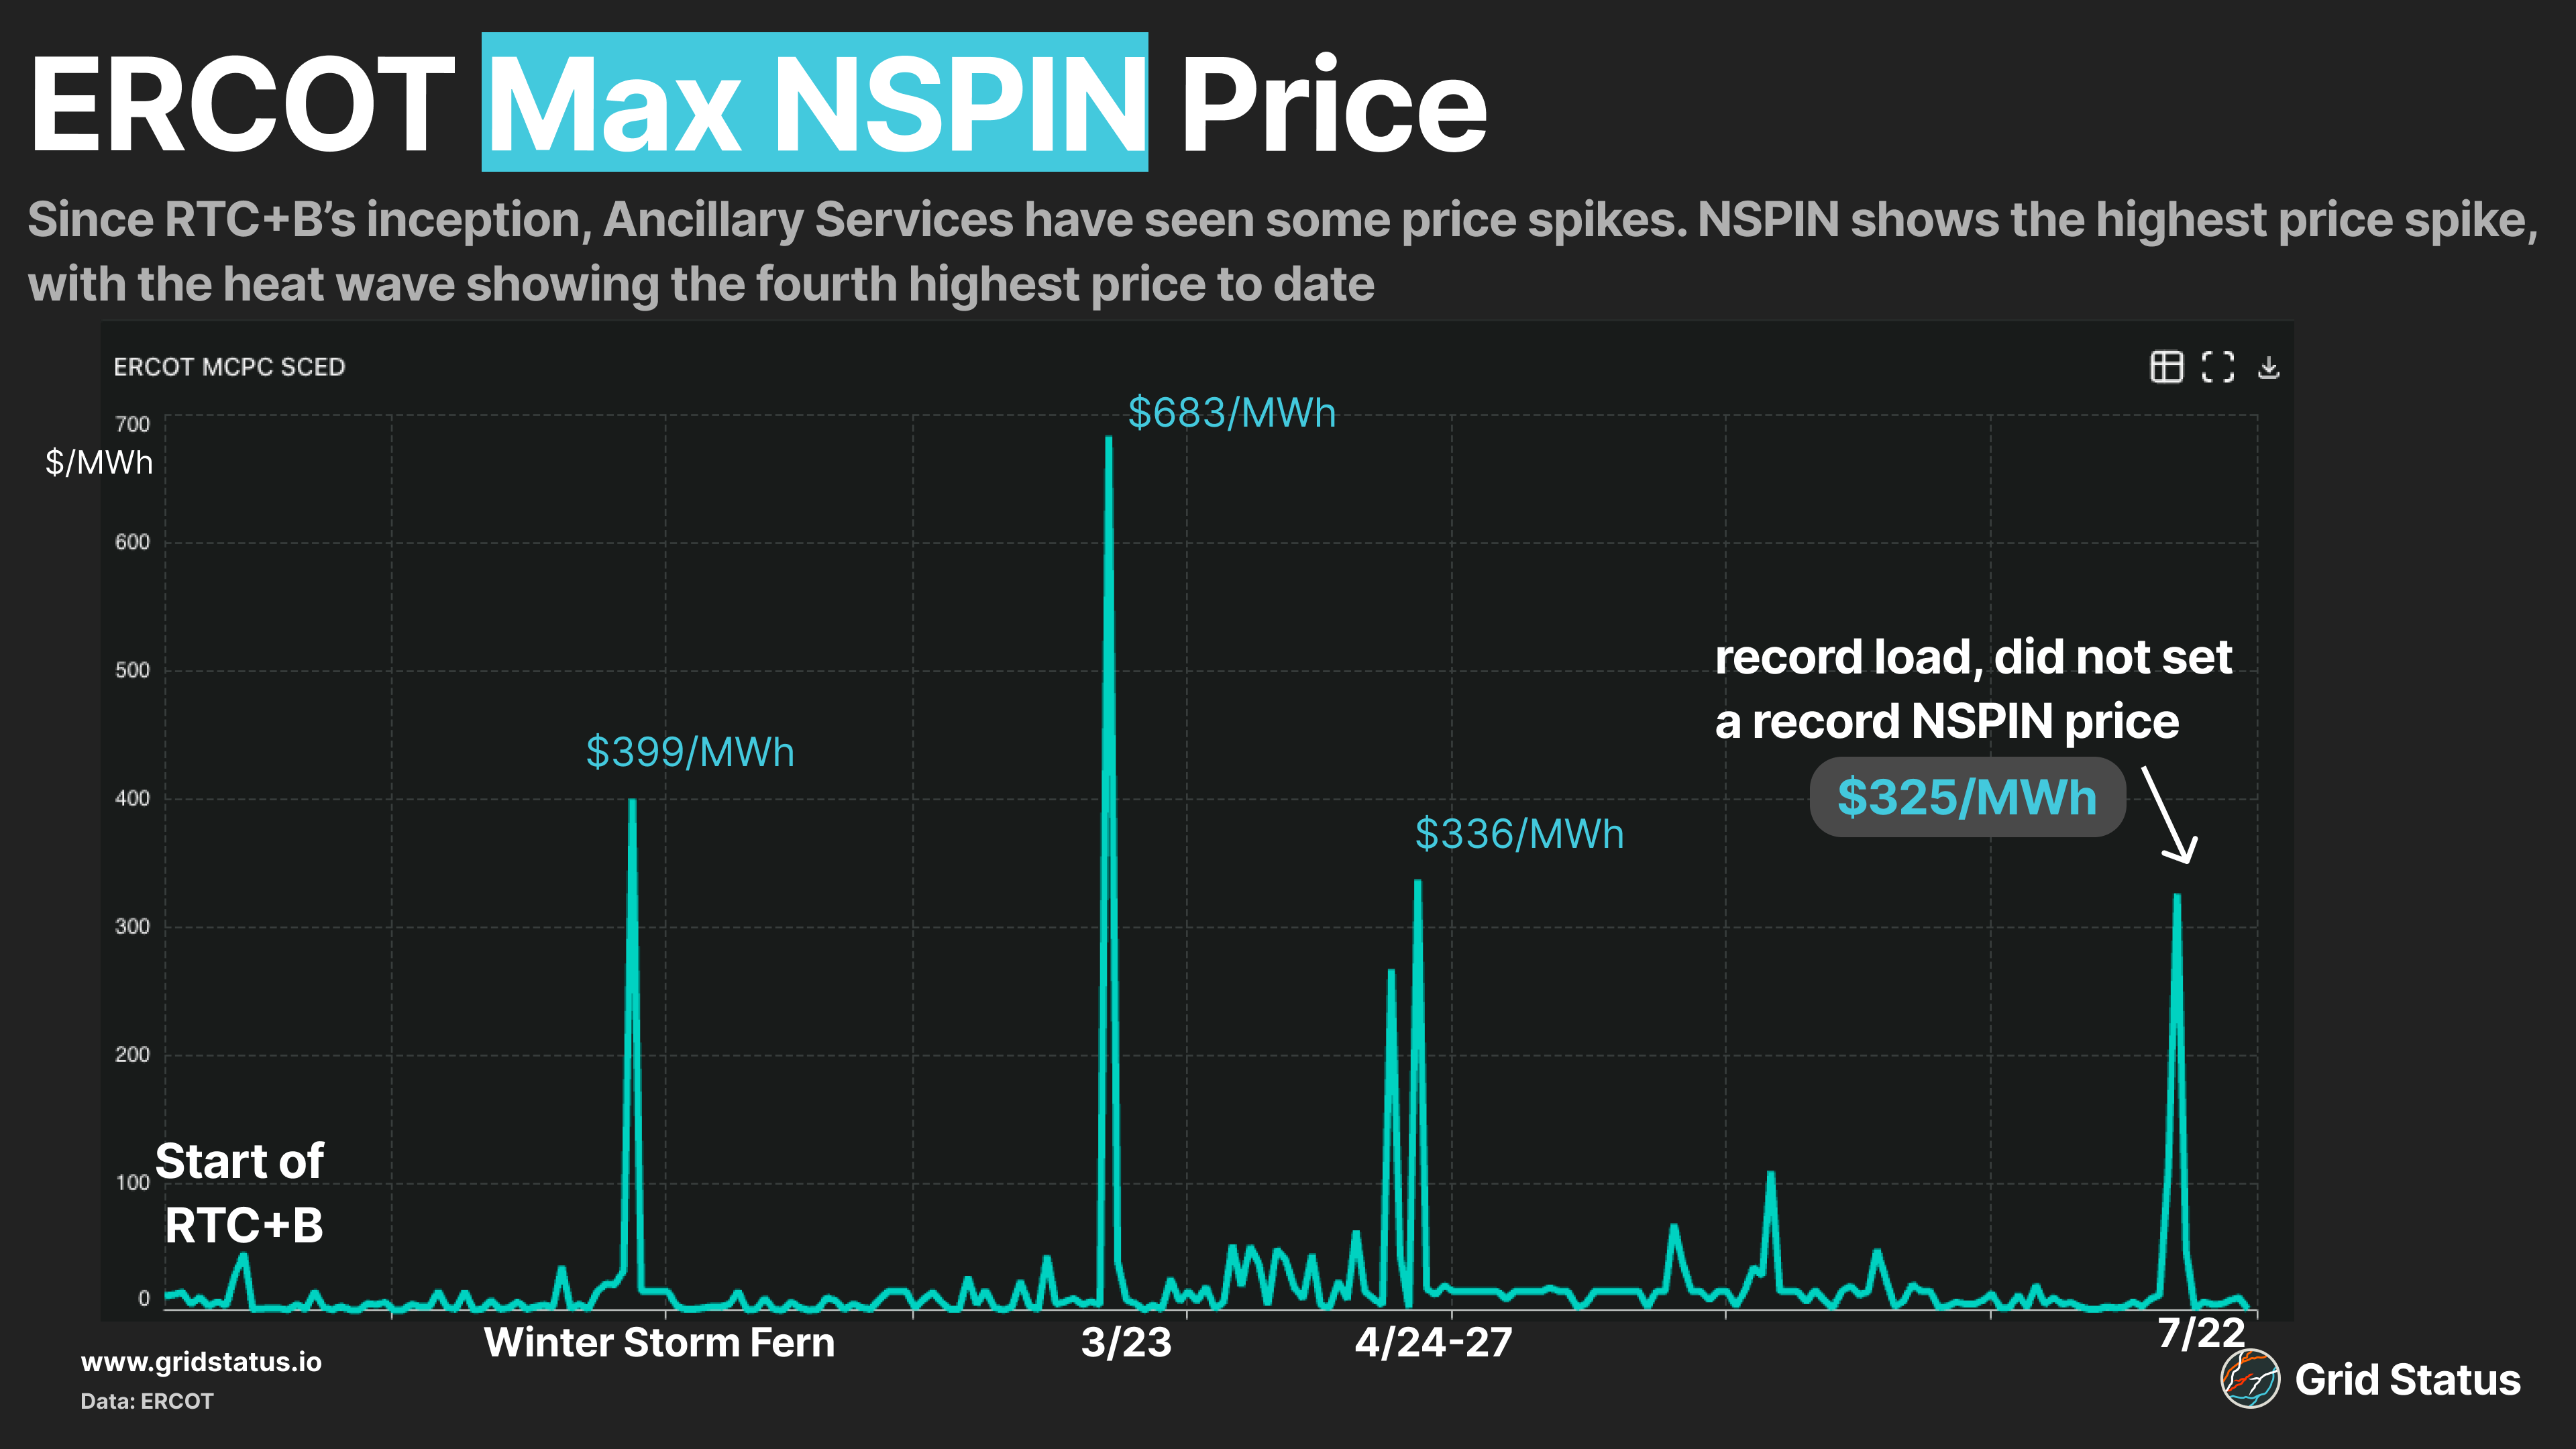
We can’t forget about the newest player in Texas’ line-up: RTC+B. For most of the day, ERCOT held on well during the maximum load, but ancillary services saw some upside in the evening as battery discharge fell off. NSPIN SCED prices reached $325/MWh.
Since RTC+B’s inception, real-time AS prices have tracked higher a few other times, occurring in the spring and during winter storm Fern.
Even though the load was 30 GW higher during this most recent load peak, prices in Ancillary Services didn’t reach record highs, likely because thermal units had higher availability to help supply the stack.
Unlike on March 23, 2026, which actually saw the highest NSPIN prices due to high load during outage season, driving scarcity. In spring, so many thermal baseload units were on outage that when load strength materialized in the evening, prices soared to $683/MWh.
Load Growth or Temperature Growth?
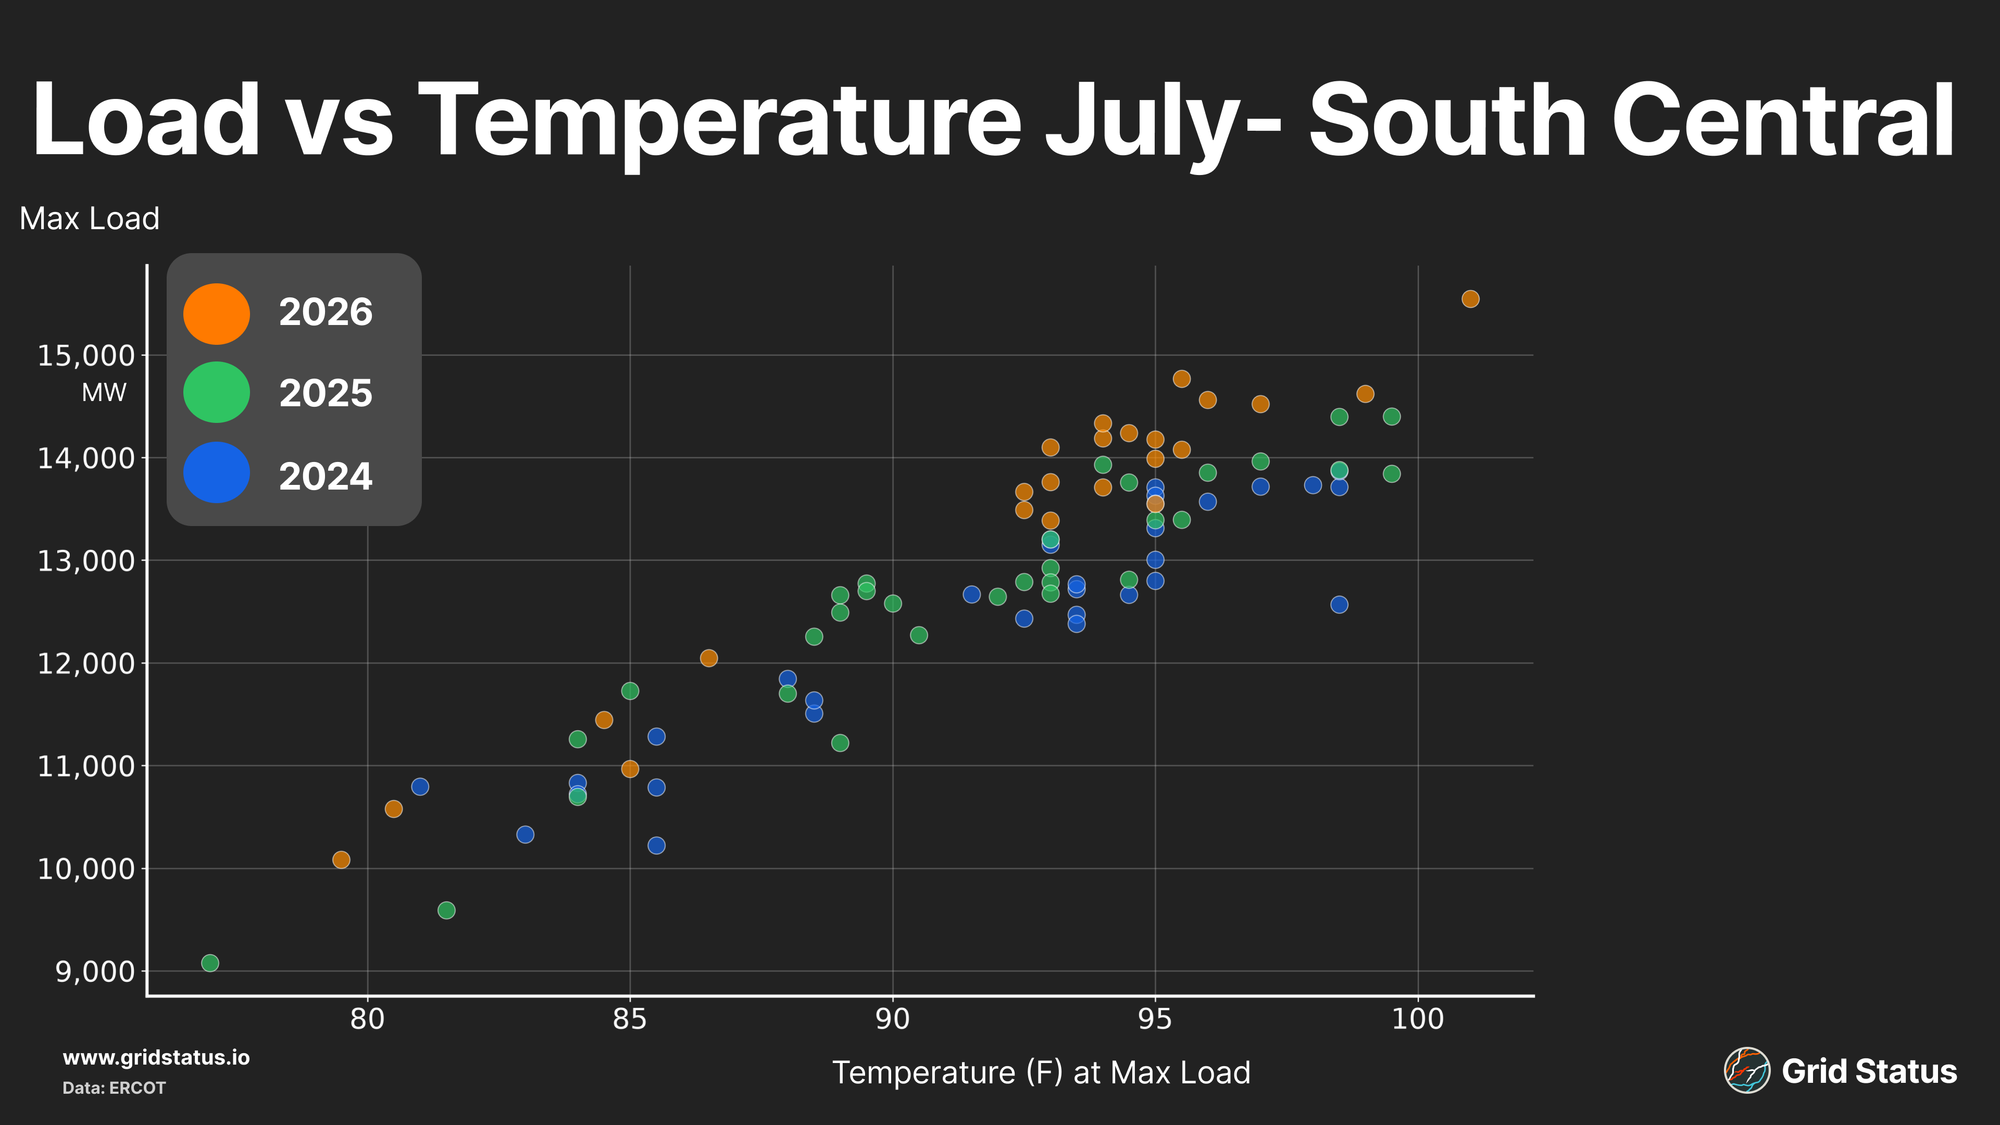
ERCOT’s newest load record came during extremely high temperatures, but temperatures alone aren’t the only driver behind the over 5 GW load jump. Looking at temperatures compared to load across ERCOT’s Weather regions, we can see a few key areas where load has grown regardless of temperatures year over year. Some obvious regions include: Southern, South Central, and West.
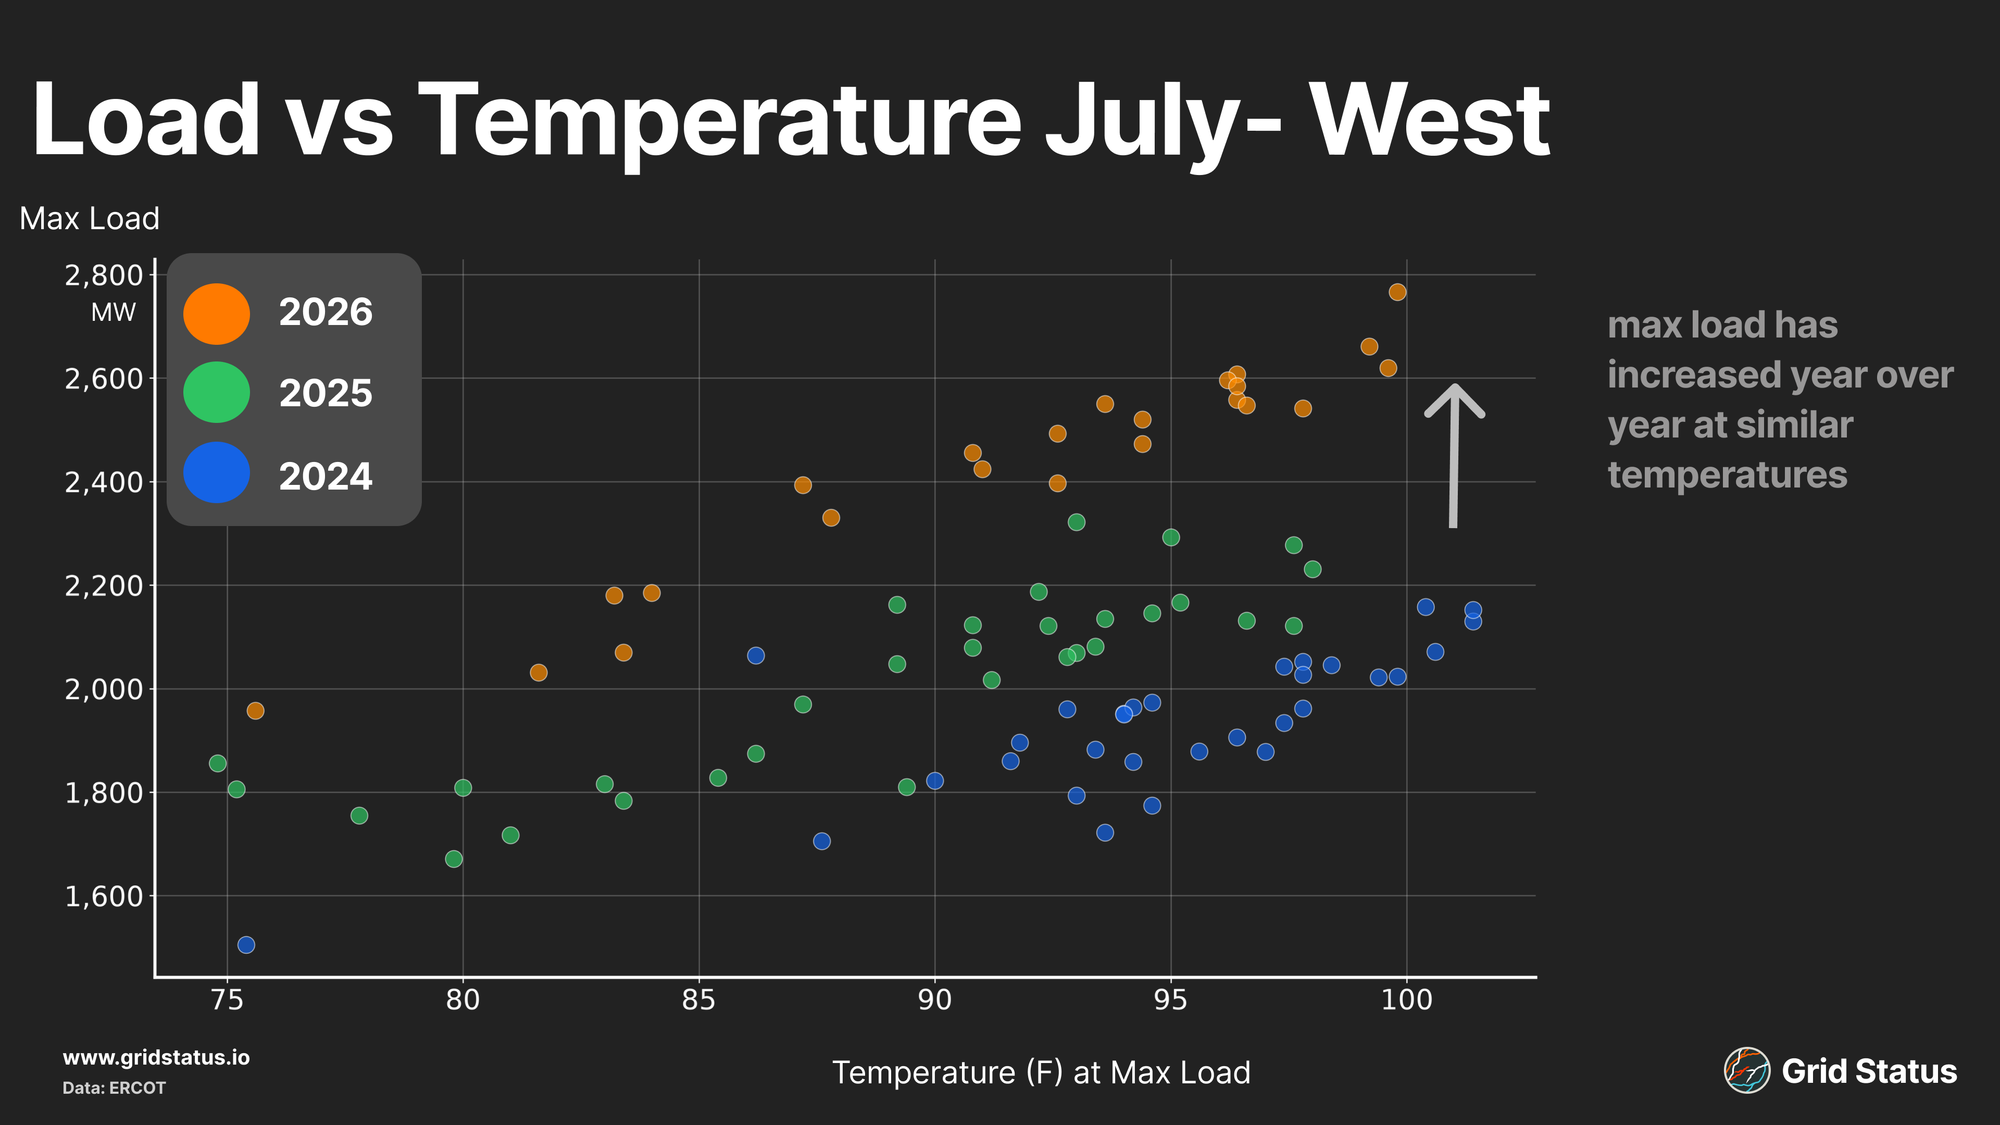
West is a small region (that doesn’t include Midland or the drilling in the Permian, that’s Far West) and was typically known for being residentially based. Recently, West load has skyrocketed as a new data center in Abilene, TX, OpenAI’s Stargate, has partially come online. Given the size of the load in relation to the region, it is easy to see the impact this single project is having on the zone.
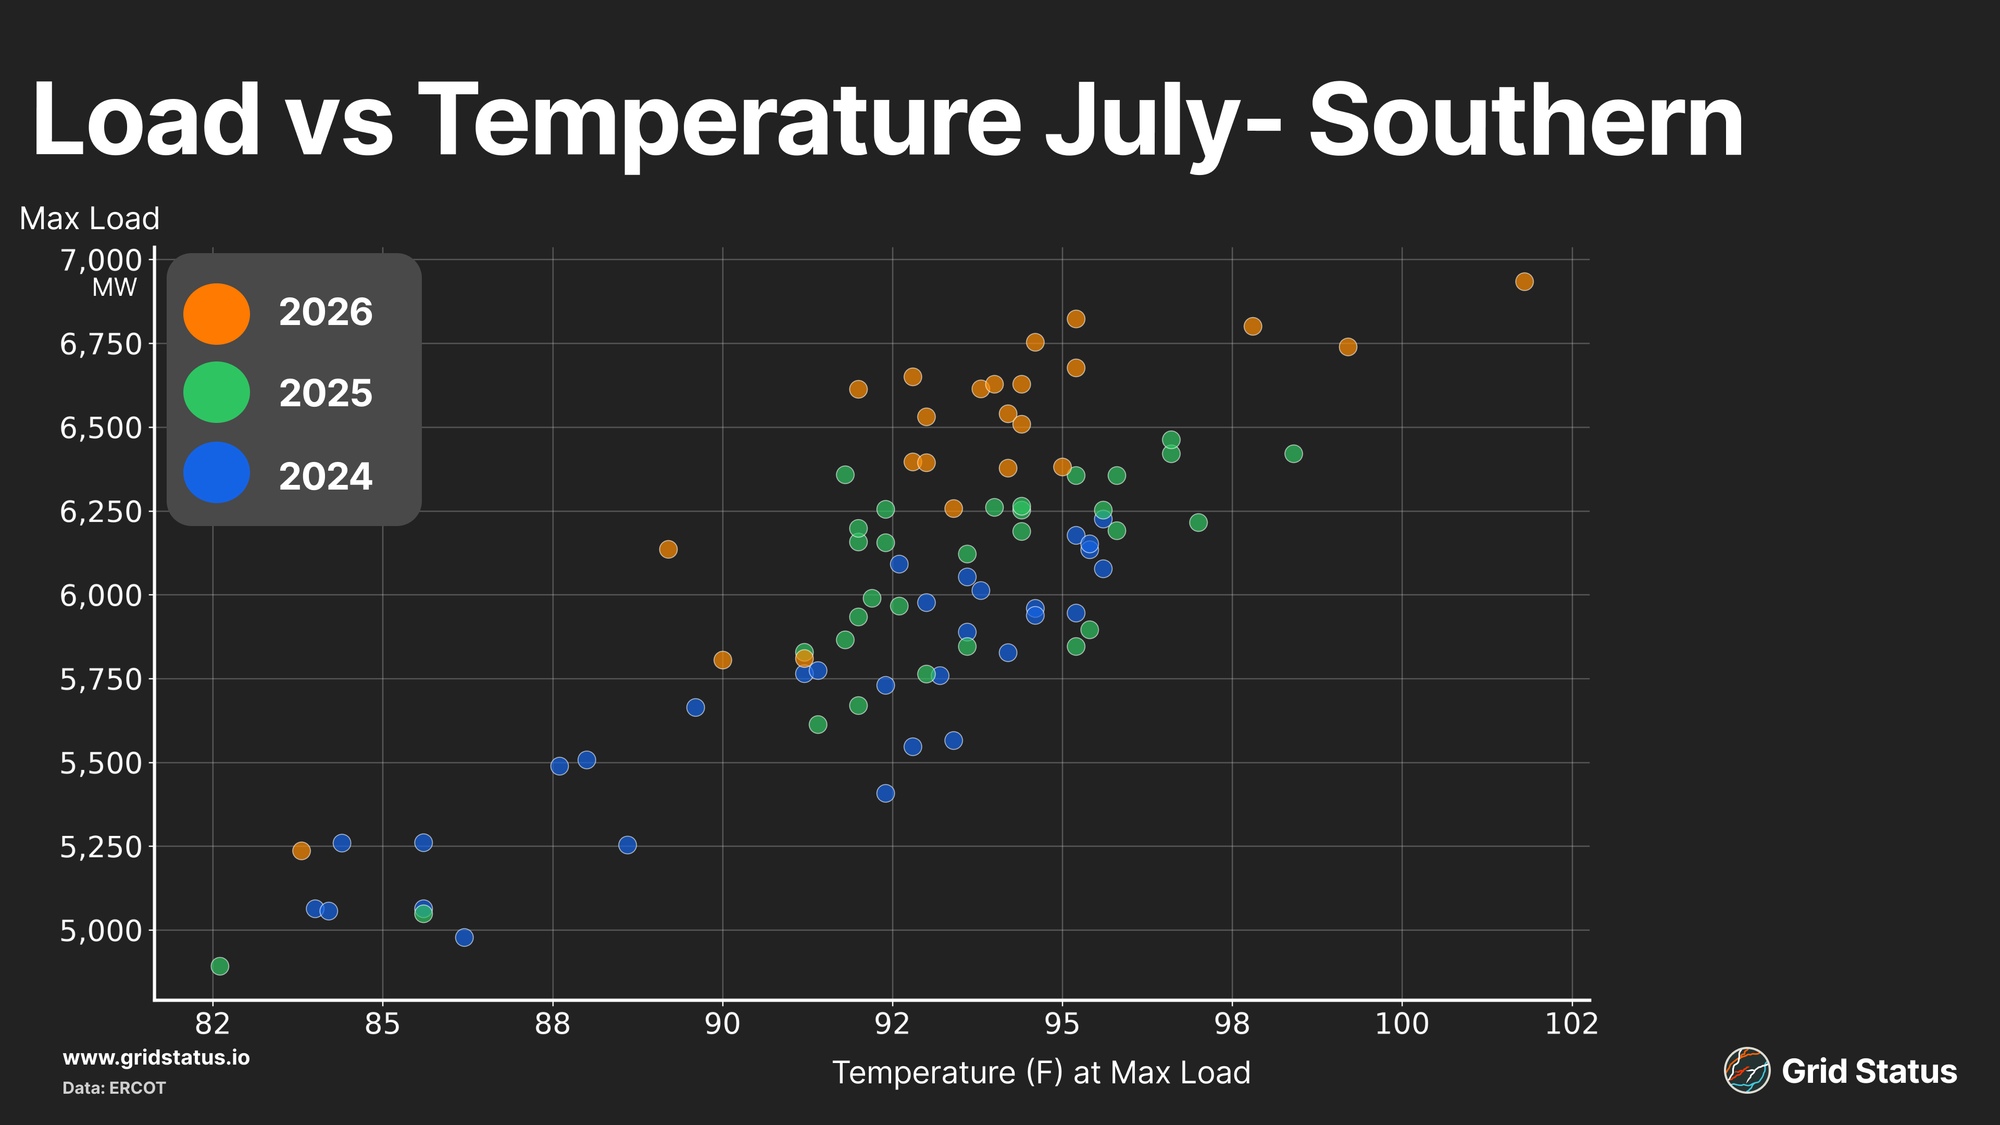
Both Southern and South Central have seen noticeable load growth at similar temperatures, but South Central has grown by multiple 1,000 MWs at the same temperature.
How the Game has changed
We are just under two weeks away from the new all-time load record, but it appears something has shifted in ERCOT. Load forecasts have tracked up, closer to the peak in the week following the all-time load record. A few different elements are at play here:
- Temperatures have remained elevated.
- The new peak load on July 22 set the July Coincident Peak
- This empowers large loads to cut loose under the assumption that another record is somewhat less unlikely after such a large record beat.
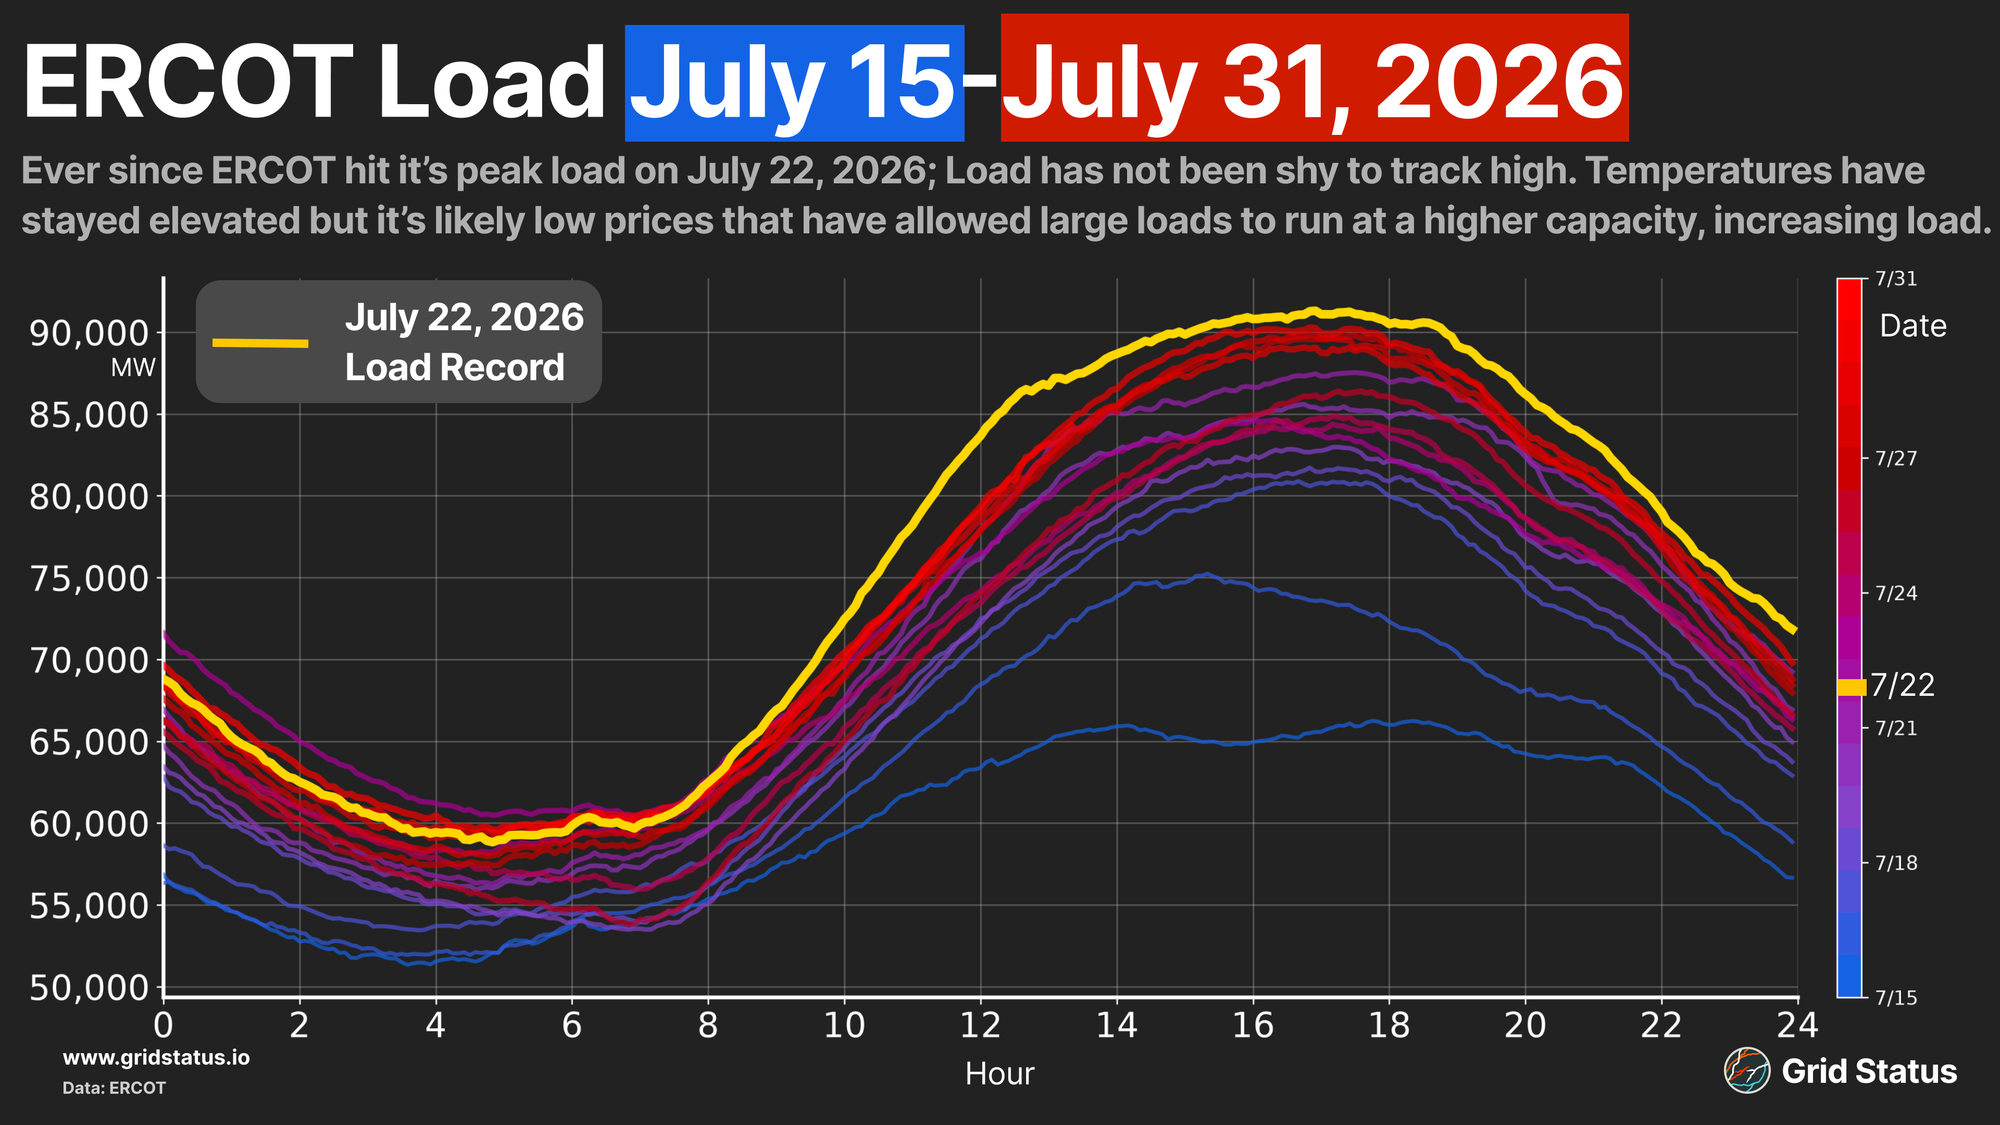
Additionally, prices have stayed muted at peak load, further allowing large loads to run at possibly a higher capacity, since ample generation is available and will not see steep economic impacts from running in the heat.
When Demand Isn’t Load
ERCOT’s peak load may have been set on July 22nd, but system demand was higher on the 30th, because wholesale storage load (WSL, or battery charging) has not been included in ERCOT’s public load reporting since the implementation of RTC+B on December 5th, 2025.
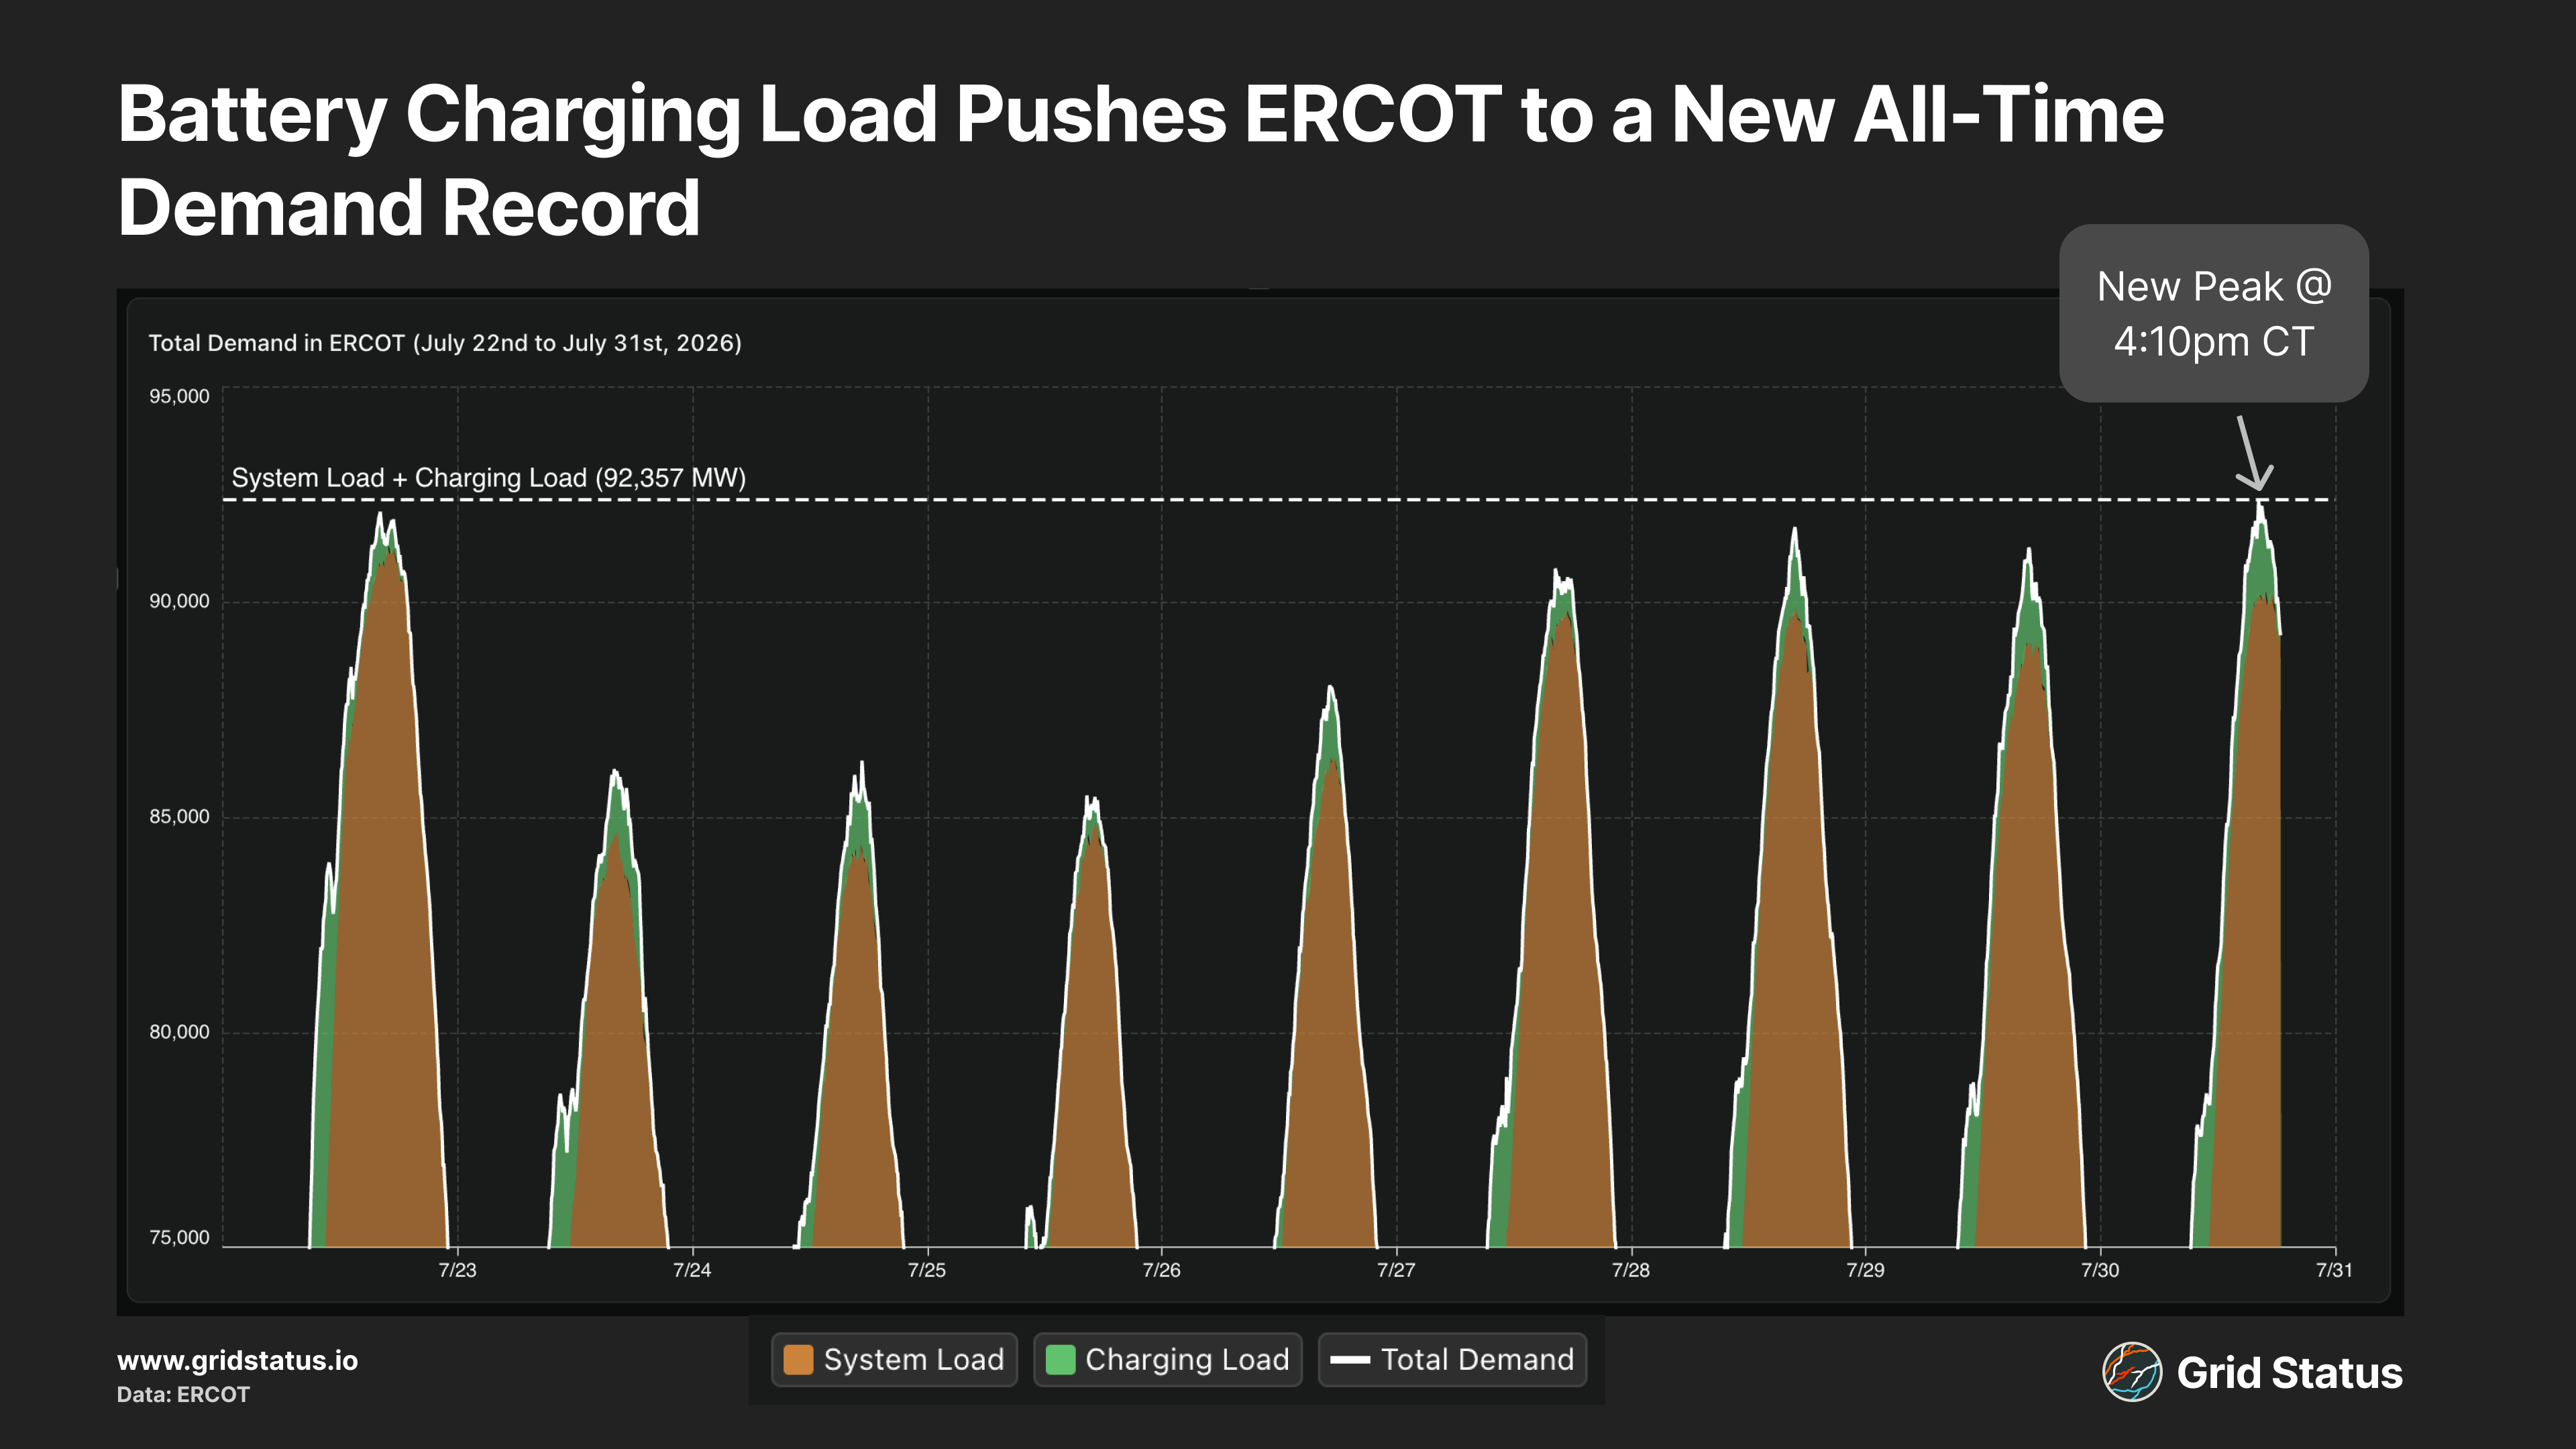
In a historic sense, this would have had a minimal impact on determining the peak load, due to the impact of price. In a market where the correlation between peak load and peak prices has been severed, this is no longer the case.
ERCOT’s reported load exceeded 84 GW for 12 days straight to end July. Some amount of battery charging was present at the peak load moment in each of these days. At its smallest, storage charging at peak was under 500 MW. At its greatest, it exceeded 2 GW. This speaks to widespread low prices at peak.
On the 30th, there were plenty of nodes with LMPs below $10/MWh. Rather than extremely localized congestion providing opportunity for a small handful of projects, the system-wide low prices we detailed above provided an attractive opportunity to charge for a substantial portion of the battery fleet.
Generators spun up to meet this additional demand, but it doesn’t count as load in the official statistics.
Breaking Down the Box Score
The third week of July 2026 set a new bar for ERCOT. As load reached new peaks, blowing its prior load record out of the water, prices remained low all the way through the net load denouement.
July 2026 may prove to be a temporary high-water mark in the dynamic ERCOT market. Crossing the 90-GW threshold garnered headlines, and high load has persisted as the grid has shown its capability to meet rising peaks. Summer 2026 may prove to be the start of a new normal due to an influx of large loads coming down the pipeline. As always, we will be watching along at Gridstatus with Insights and our newly redesigned 4CP app.