Ontario Wildfire Smoke Complicates Grid Forecasts Across the East
Smoke from wildfires in northwestern Ontario has pushed into markets across the Eastern Interconnection. From solar forecasting to load, system operators in NYISO, PJM, ISO-NE, IESO, and MISO are dealing with the impacts.



In what has become a nearly annual occurrence, thick wildfire smoke from Canada has drifted across much of the Eastern Interconnection.
We first wrote about the impact of wildfire smoke on solar forecasts more than 3 years ago (one of our earliest blogs). Now, Canadian smoke is back, although this time from Ontario.
We’re taking another look at the impact wildfire smoke had on market outcomes, from demand, generation, and pricing from ISO-NE to MISO.
Watch out for big changes over the next month as we deploy a redesign of the experience to support new ways to keep everyone informed on grid happenings.
Here (Does Not) Come The Sun
Heavy wildfire smoke from Ontario blew into New England on what was supposed to be the region's third-highest peak of the summer.
One of the earliest impacts seen in New England was the drop-off in solar generation over the late morning and into the afternoon of July 14th. Solar generation peaked at 11 AM and quickly dropped over the afternoon.
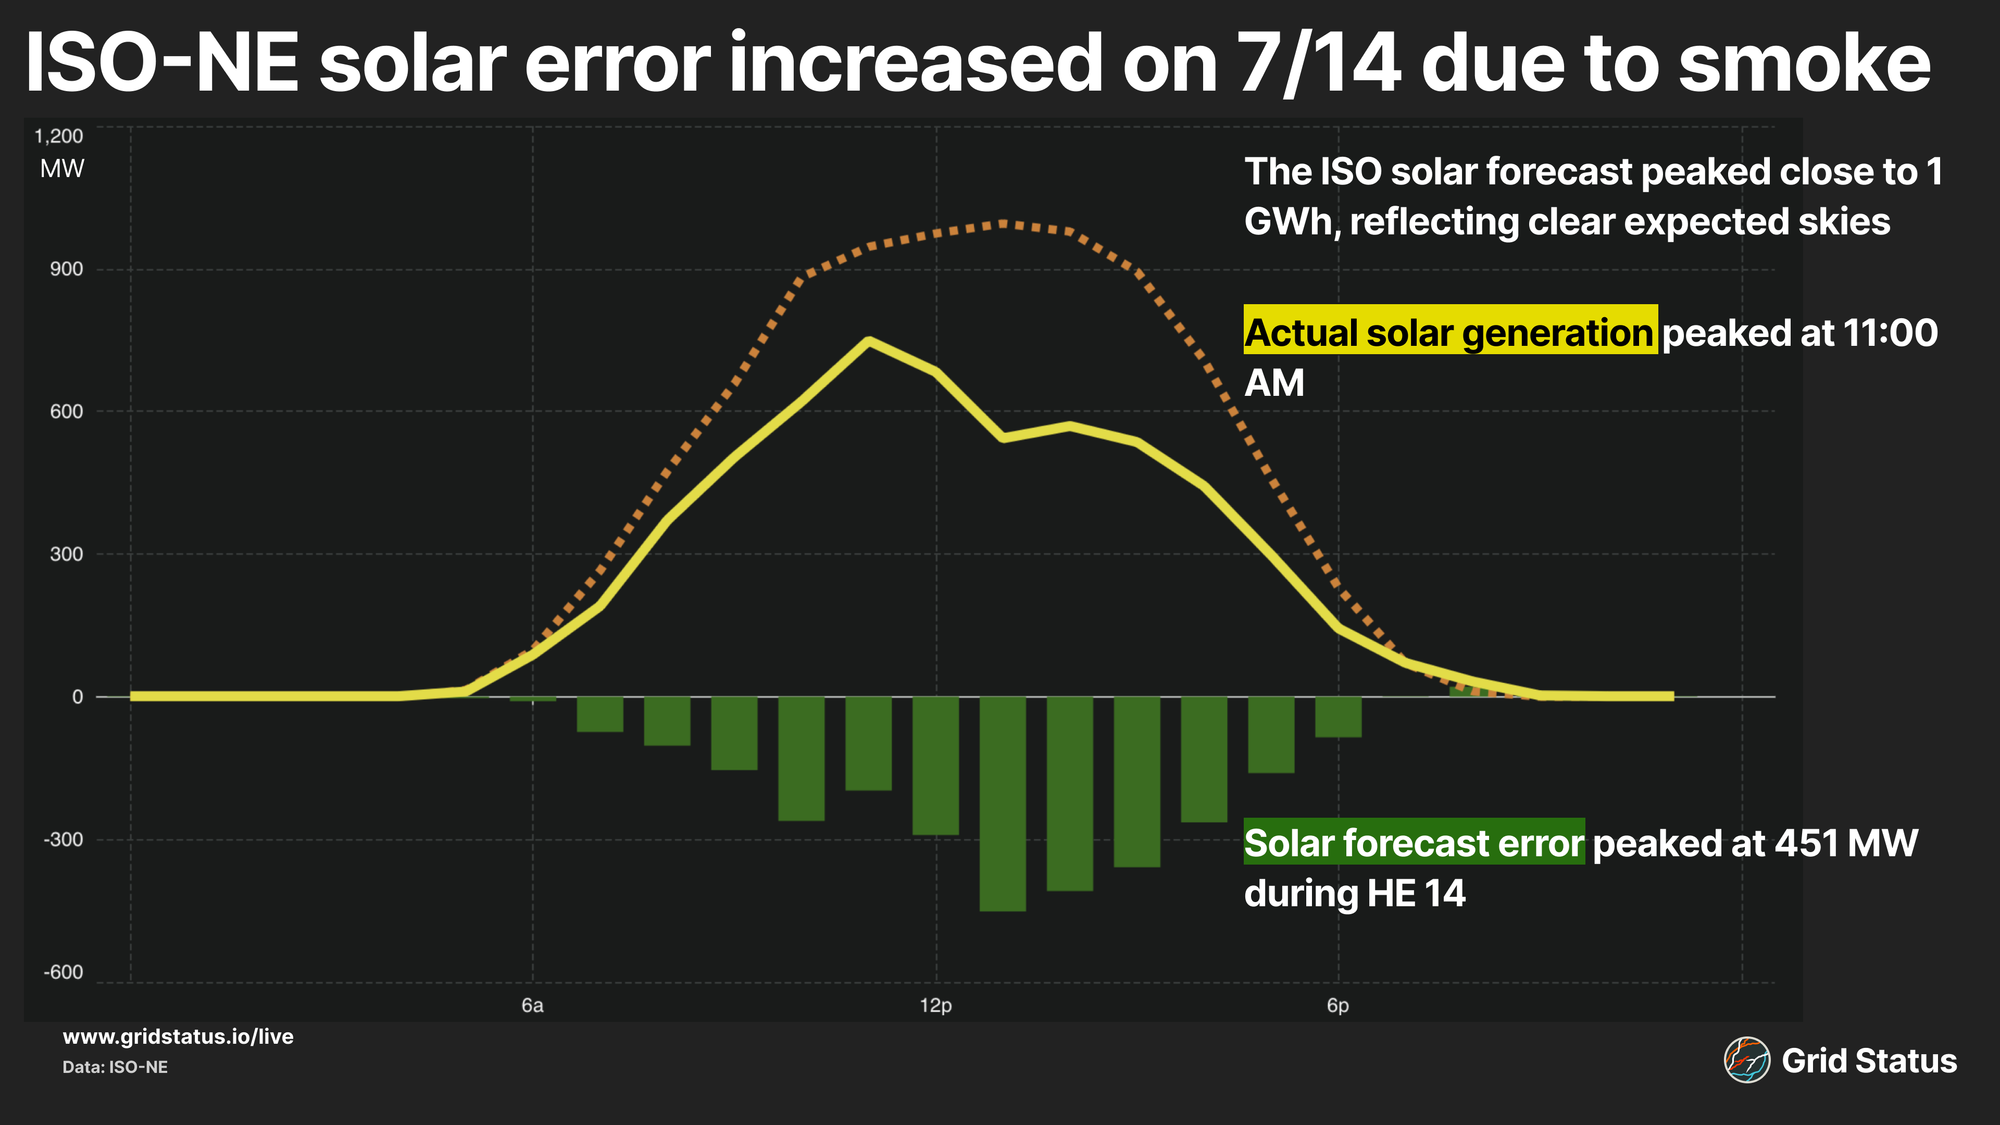
This drop in front-of-the-meter solar generation lines up with the arrival of heavy wildfire smoke in Southern New England.
Taking a longer view, we can look back to the beginning of 2024. On an hourly basis, the ISO’s utility-scale forecast tends to overestimate possible generation.
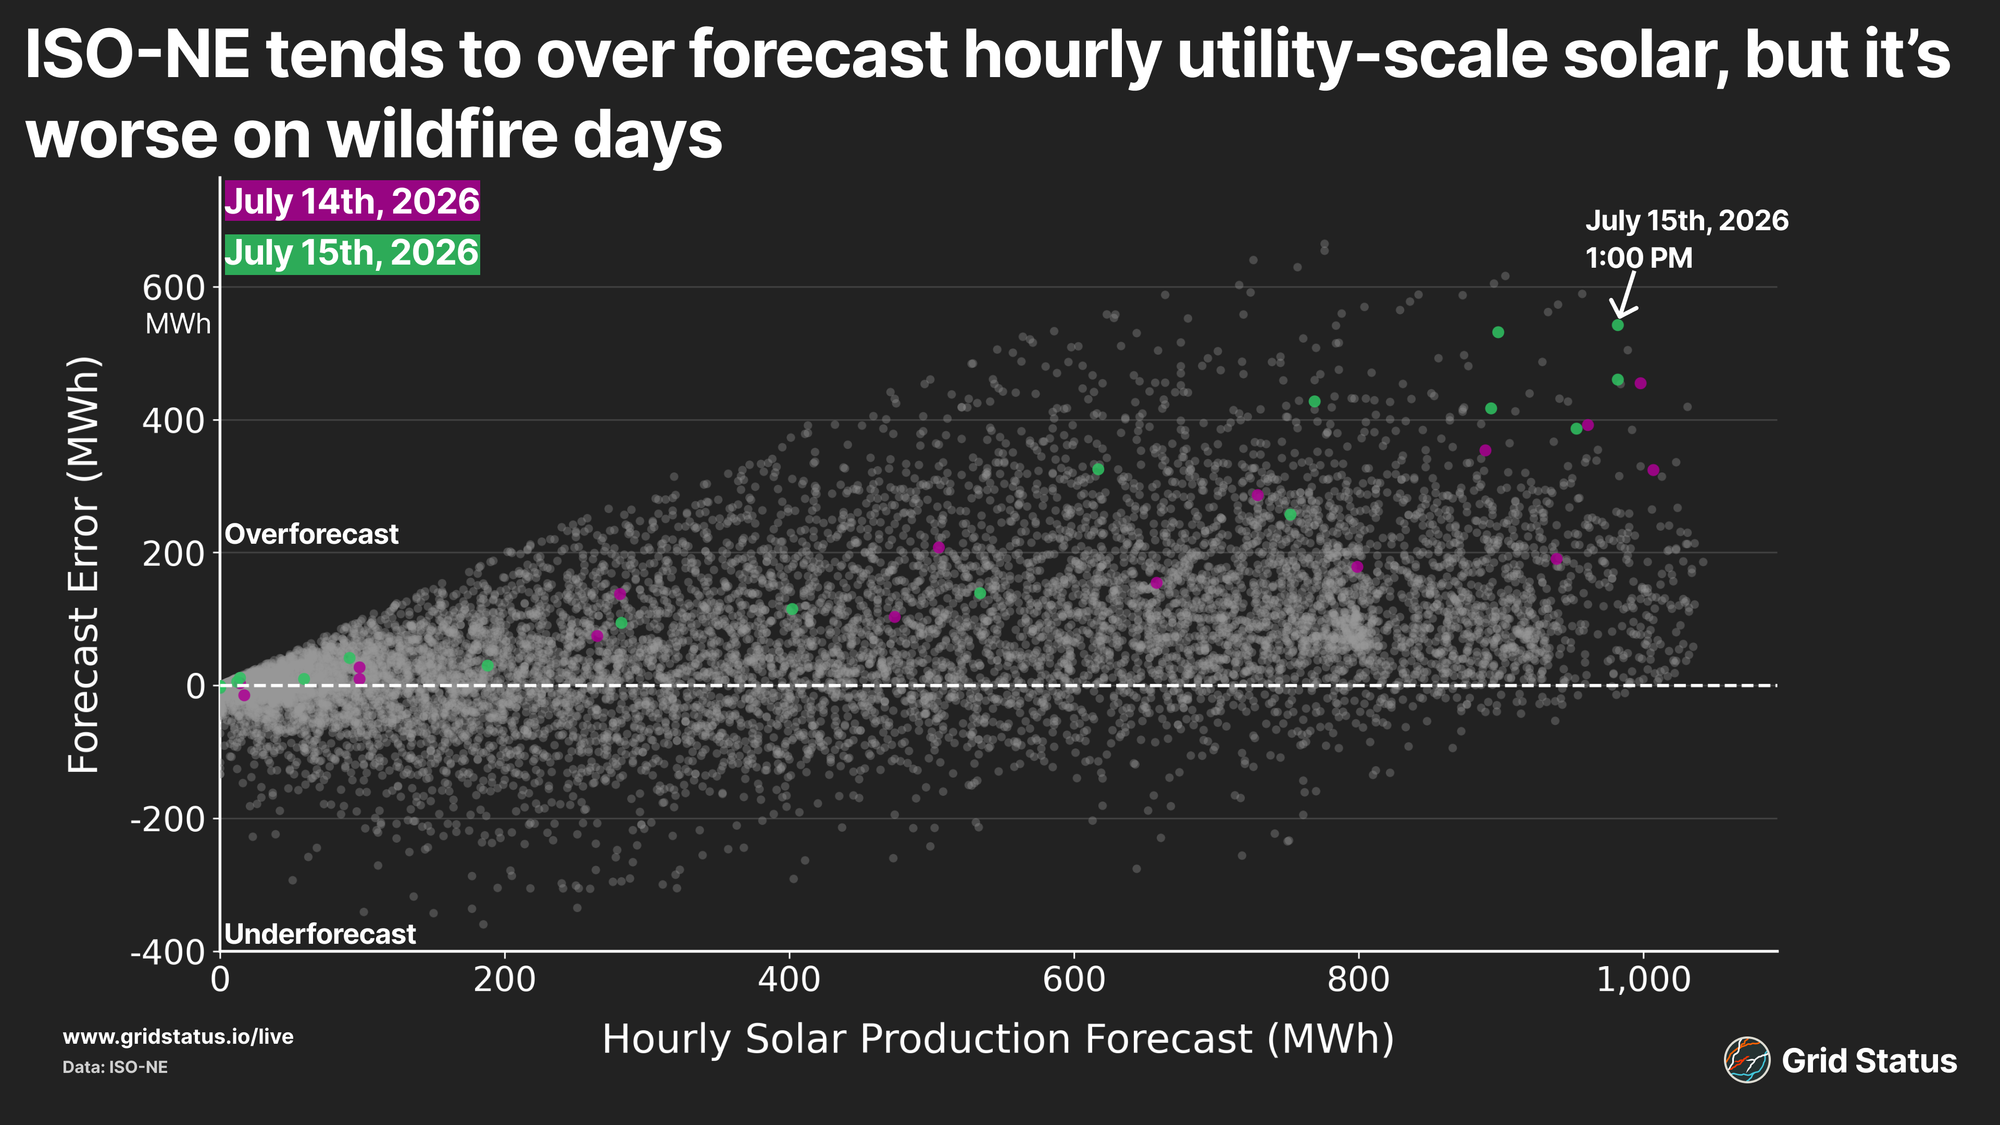
July 14th and 15th did not have the largest forecast-error-hours across the last few years, but the afternoon forecast error was on the high end of the distribution.
Similar to what we see with cloud coverage, smoke, and particularly smoke lower in the atmosphere, limits the amount of sunlight that makes its way to ground level. This not only reduces the amount of solar generation but, like cloud coverage, limits temperature upside.
Models expected to see high heat indices in New England as temperatures pushed into the 90s over the afternoon, due to clear skies, amplified by high dew points.
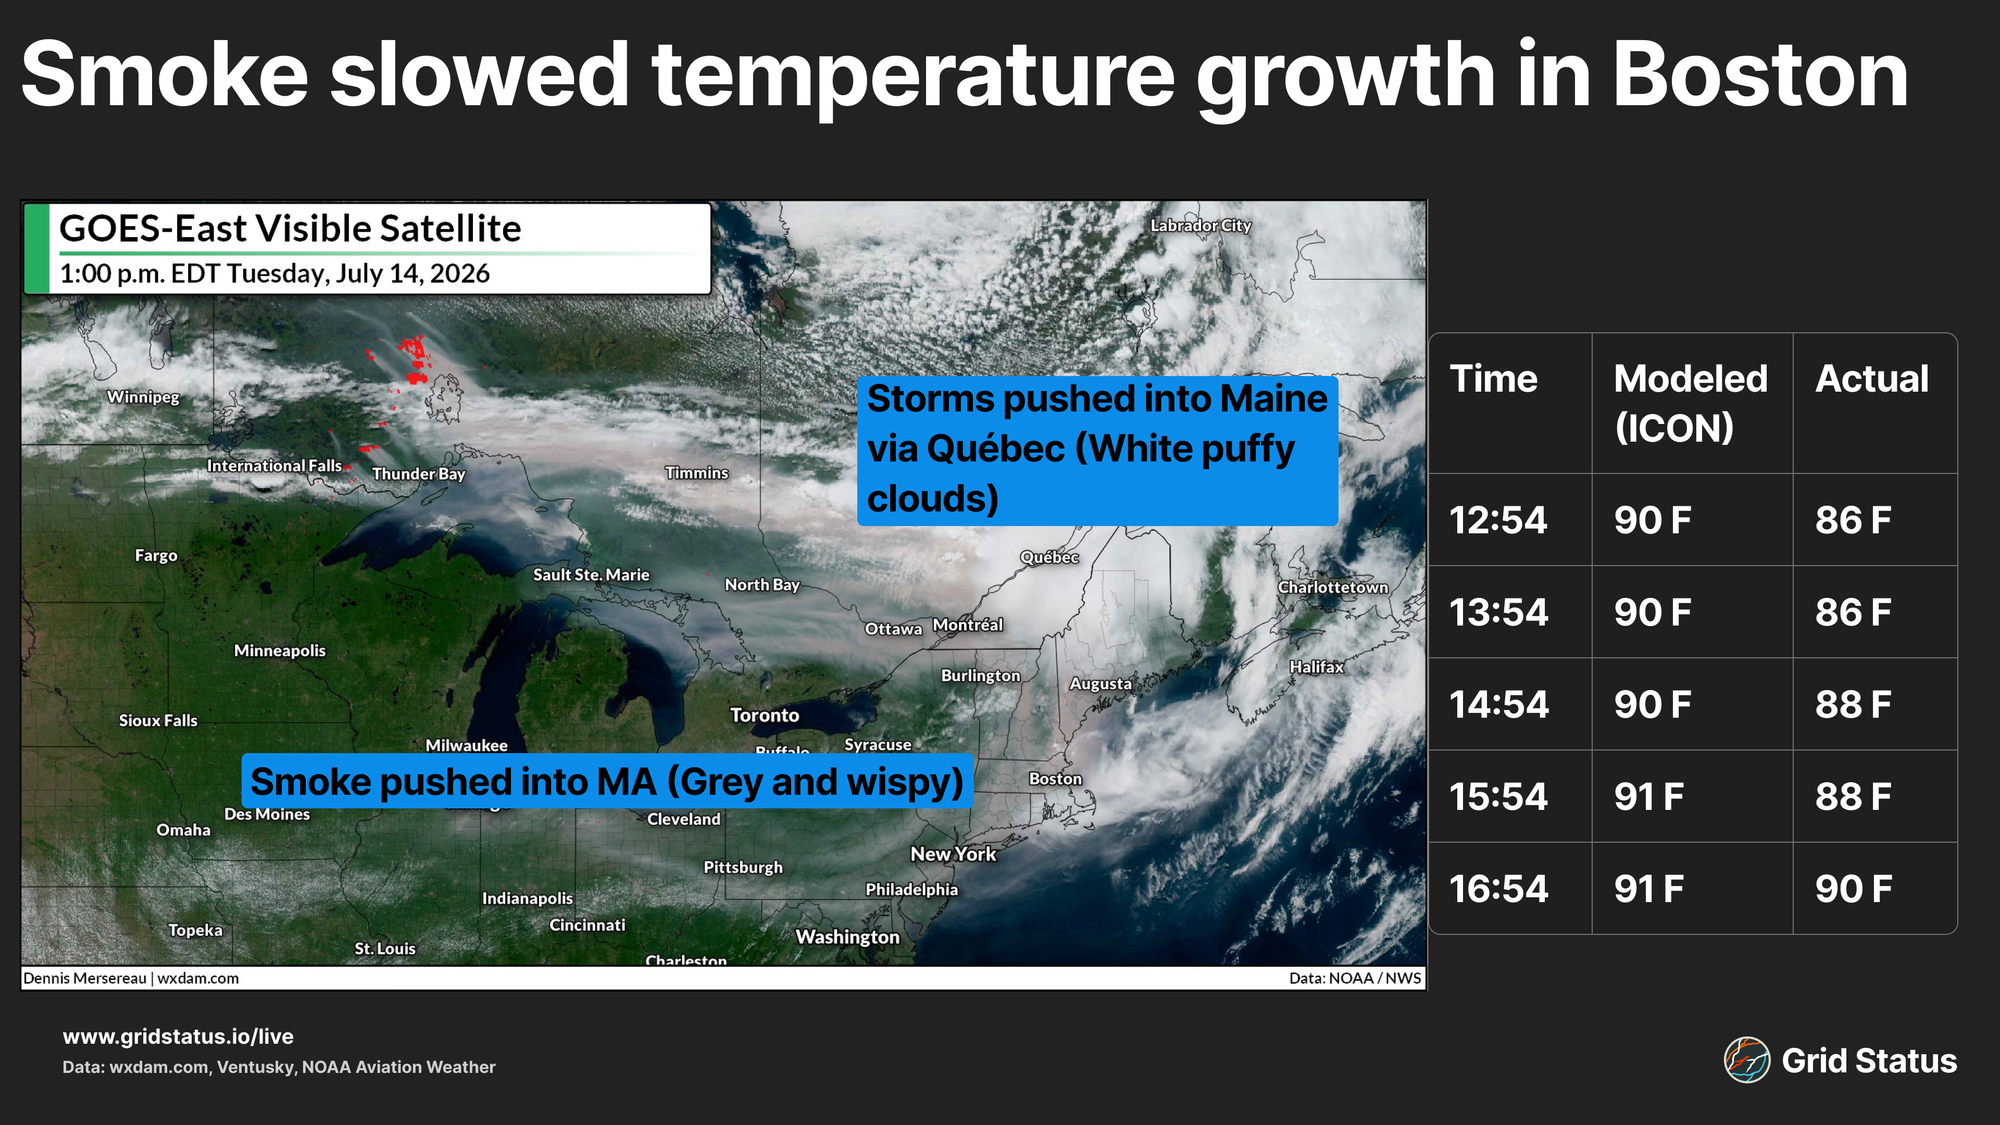
As smoke pushed into Southern New England over the afternoon, temperatures flattened, failing to reach the high temperatures that models had predicted. The timing of this temperature plateau came at a crucial time for cooling load development.
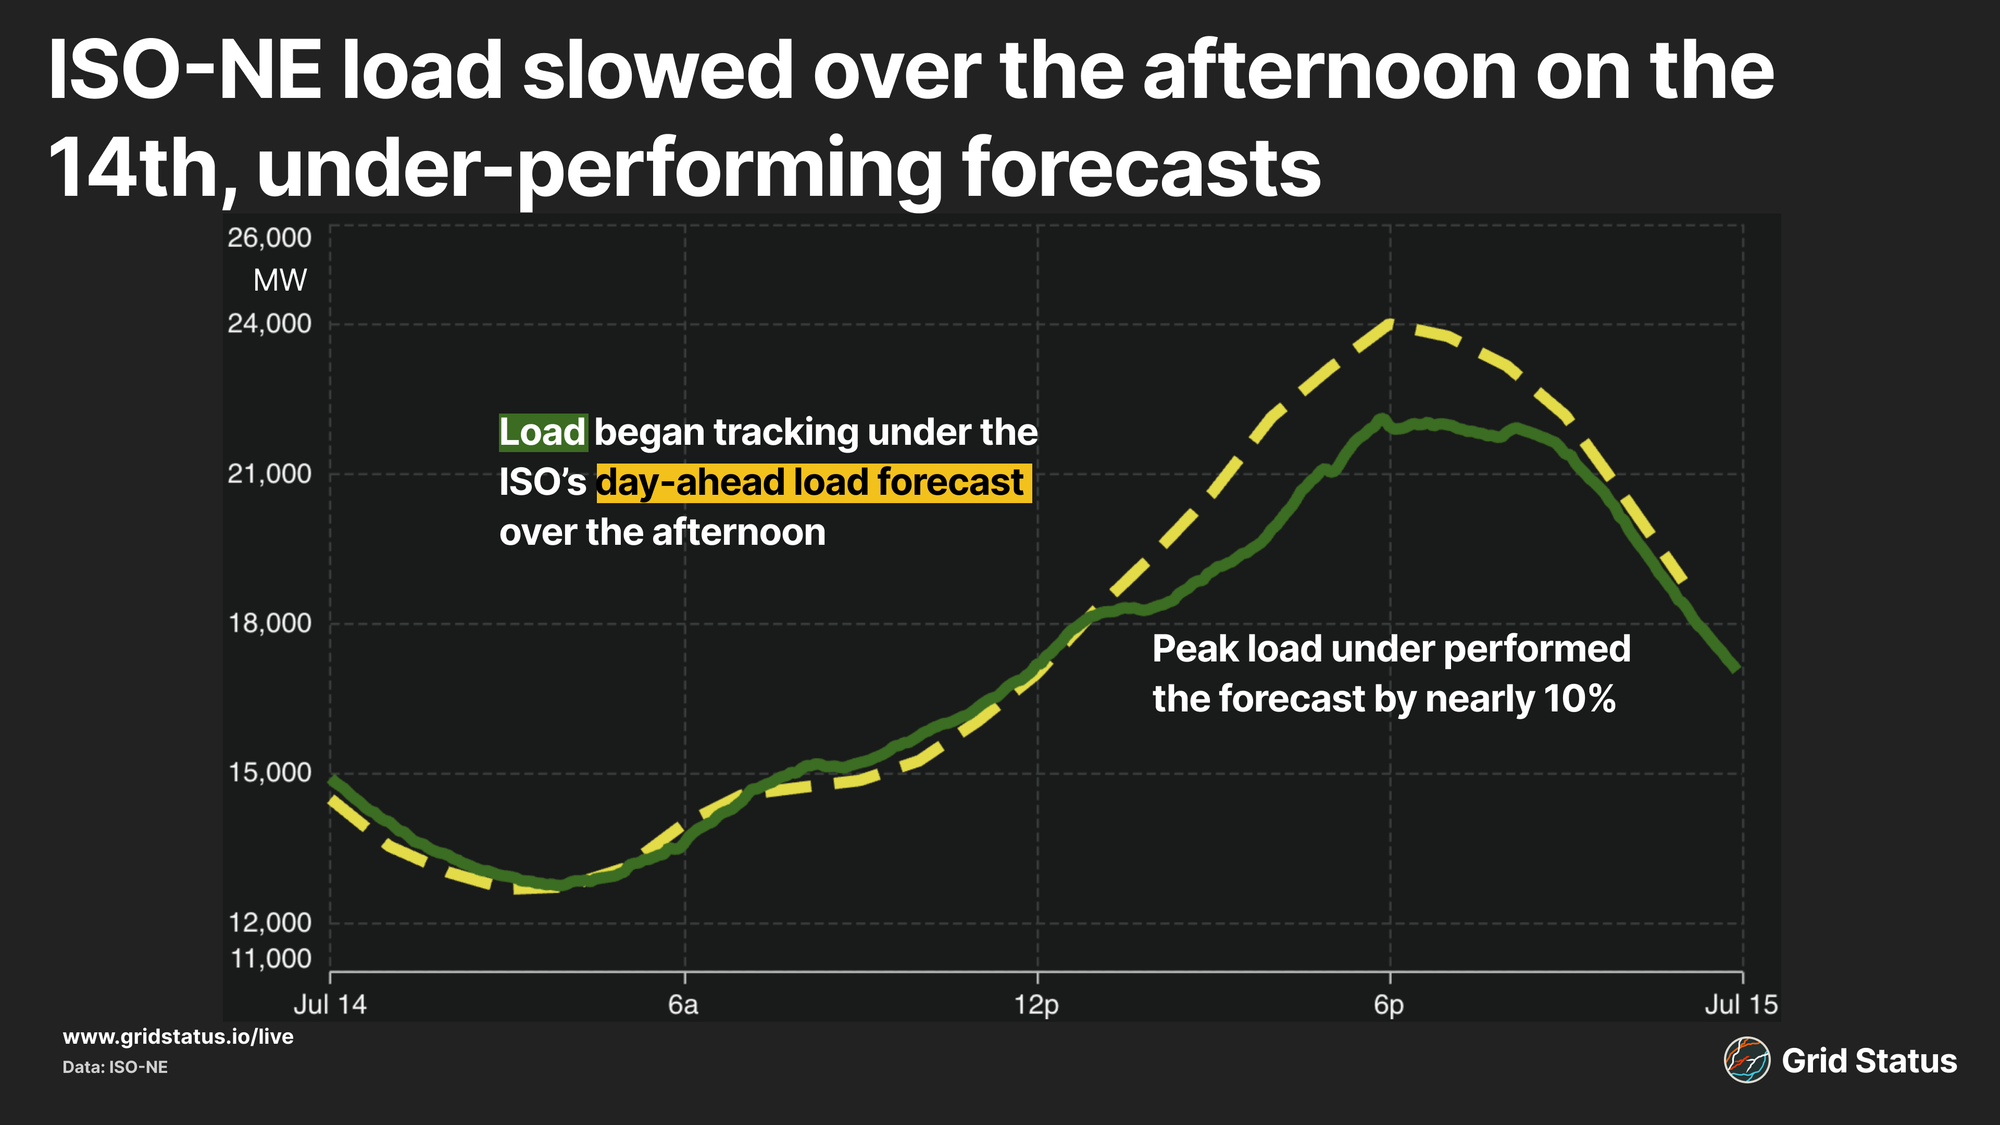
Temperatures underperformed model expectations during the afternoon ramp, which is typically when heat indices are at their peak. As a result of this, load diverged from earlier forecasts over the afternoon. Falling BTM solar over the afternoon and evening still drove load to peak in the evening, but nearly 10% below initial forecasts due to the lack of cooling load.
ISO-NE itself published a NewsWire article on the difficulty of forecasting under these conditions.
These impacts were visible in market outcomes as well. On 7/15, heavy wildfire smoke drove RT load overperformance over the morning ramp as BTM solar generation was suppressed.
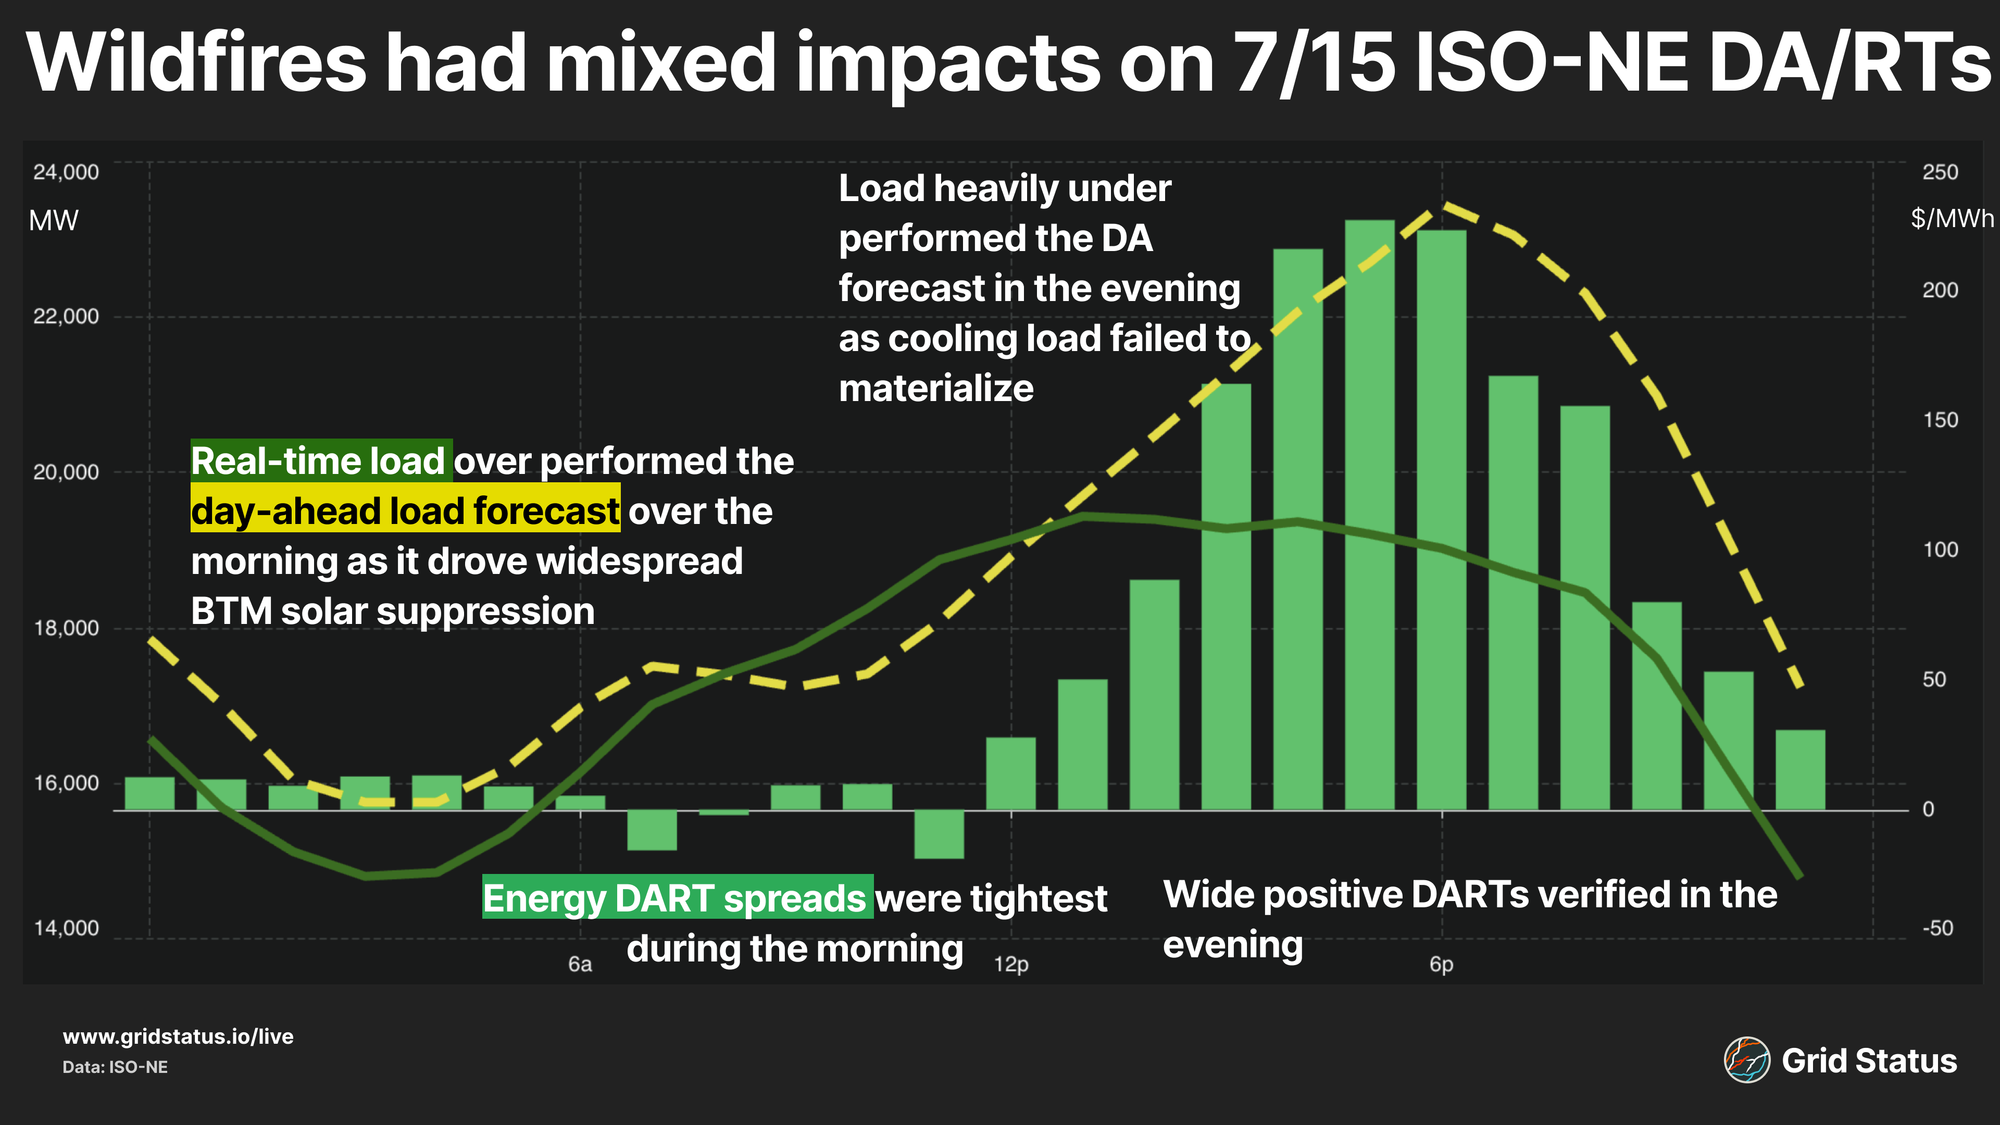
This BTM suppression, which came in above the ISO forecast, drove real-time energy price spikes and corresponded with the only negative energy price DARTs over the day. By the afternoon, load began to track below the ISO forecast as smoke limited cooling load. This lack of cooling load, paired with a drop in humidity, kept load well below forecasts and drove $200/MWh+ positive energy price DARTs.
Wildfires x Peak Demand in Ontario
The current smoke may be originating in Ontario, but IESO has relatively little solar, and what capacity exists is quite far from the fires themselves. Despite that, similar forecast issues cropped up in the province, with overforecasts peaking on the 15th.
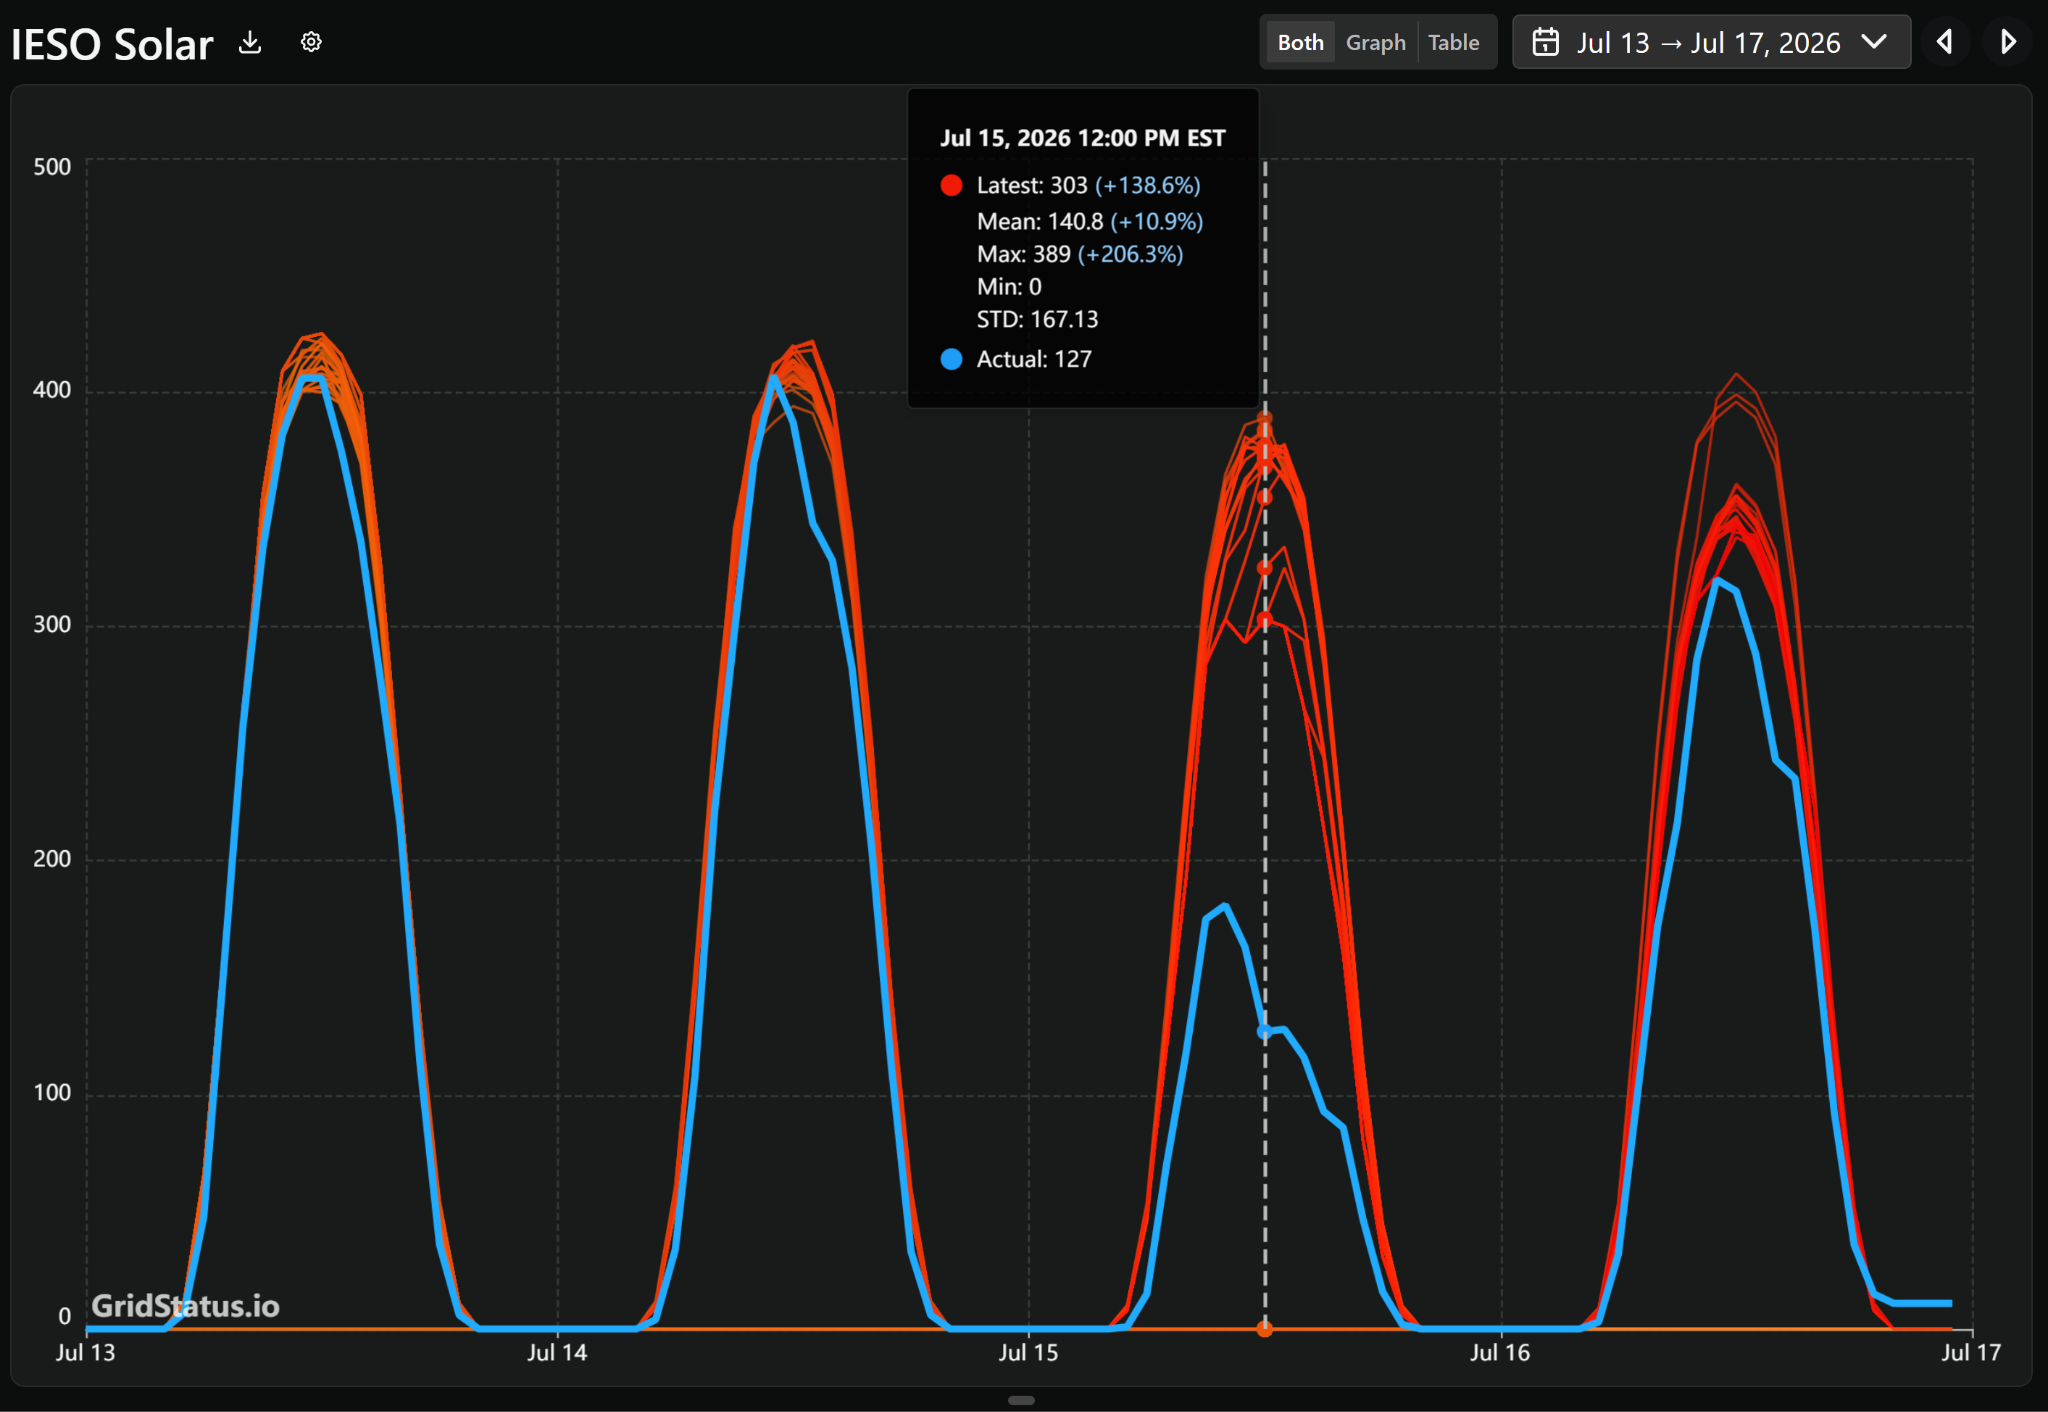
Using our Forecast Analysis app, the gap between outlook and actuals is clear, as is the model’s attempt to begin correcting for the smoke. Unlike the 13th and 14th (essentially normal days), the 15th’s forecasts cover a wider range of possible outputs and also vary in shape across the peak. Despite this, the last forecast prior to the real-time still predicted more than twice the actual output.
Generation impacts from the wildfires have not only been felt by the province’s solar fleet. Silver Falls, a 51 MW hydroelectric dam located in Northwest Ontario near wildfires in the Thunder Bay region, has seen changes in its generating behavior since the fires began.
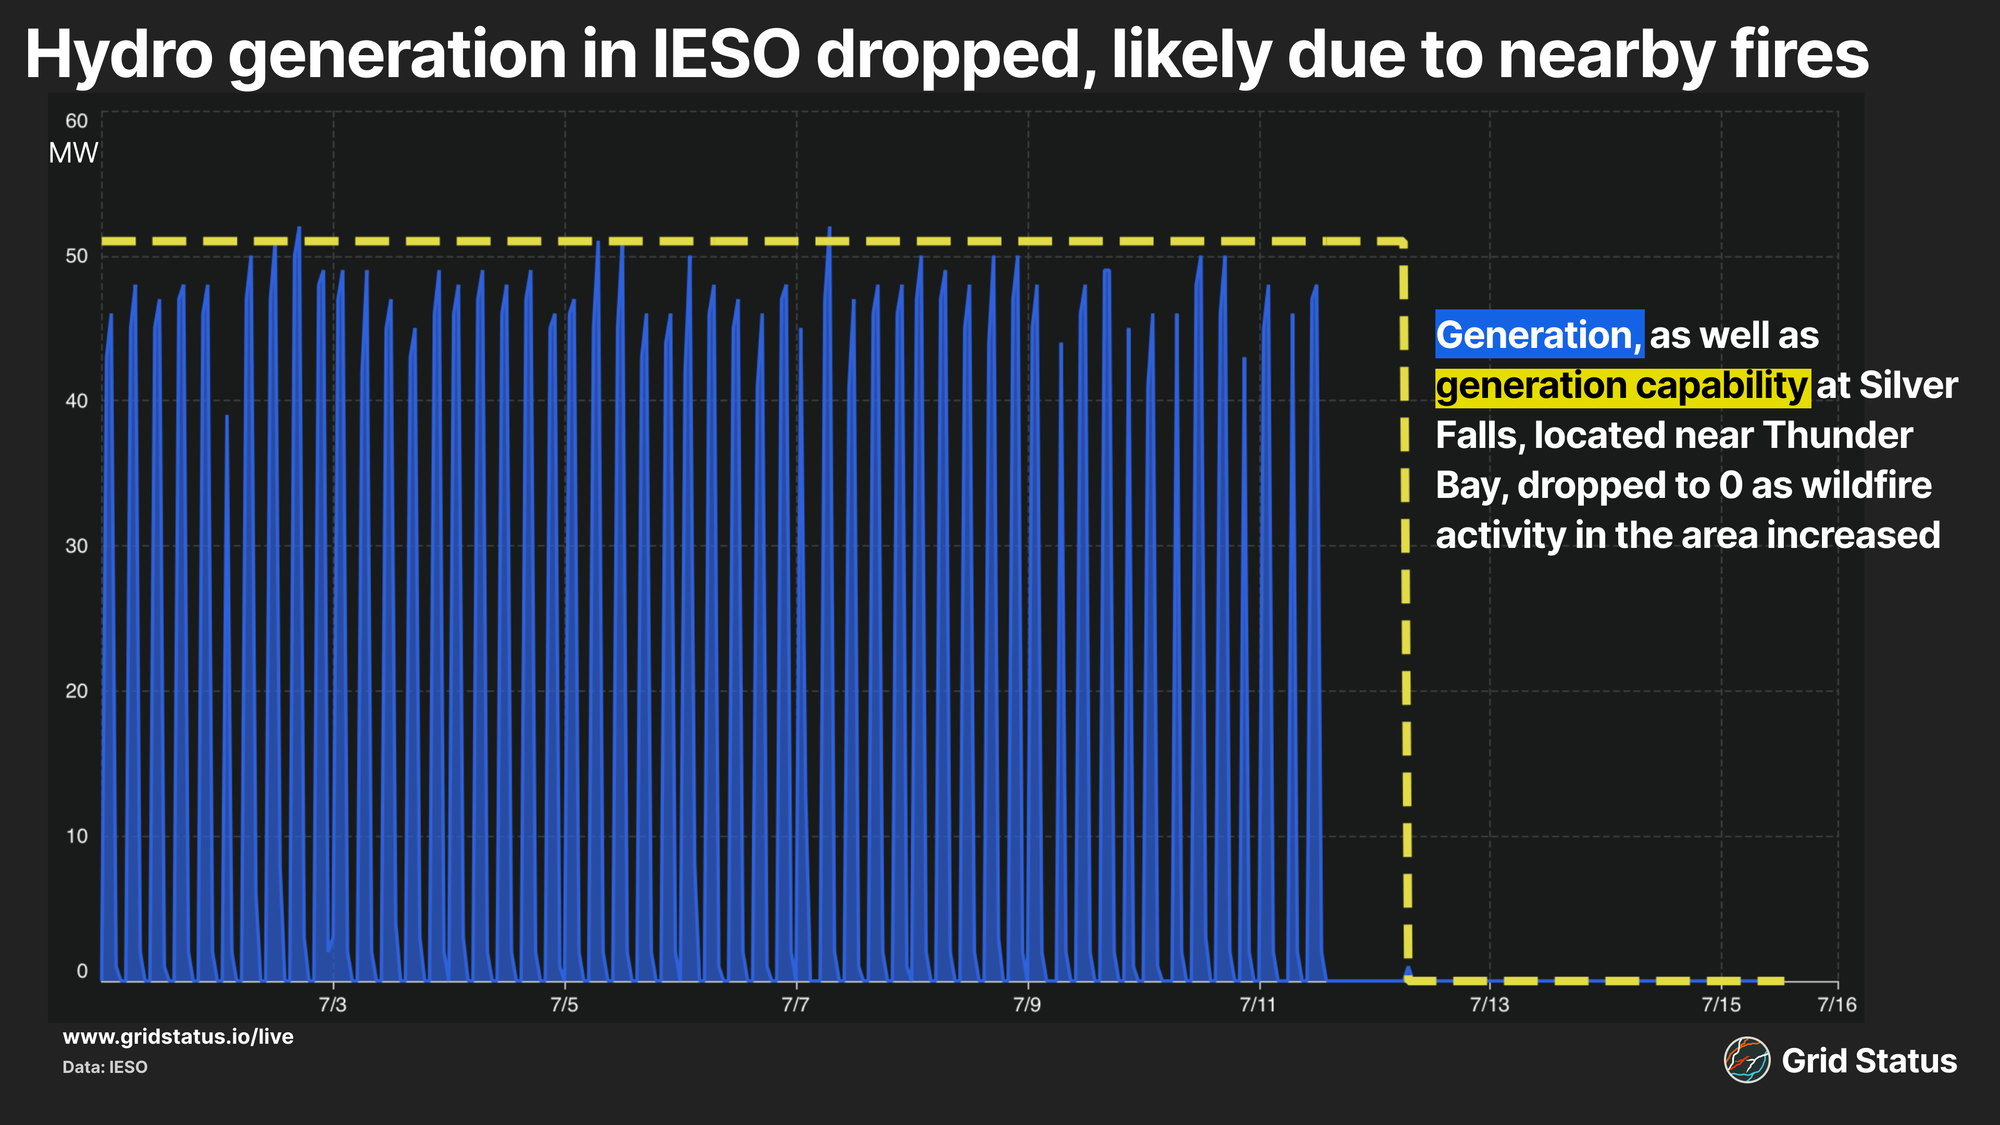
Over much of the start of the month, the dam operated on a relatively consistent cycle, generating in 5 distinct patterns throughout the day.
Starting on 7/11, the dam has not generated any power, despite retaining its capability of 51 MW. This drop likely indicated a change in operations that occurred in real time.
The lack of generation stands out even more against the backdrop of demand in Ontario, exceeding load from the heat wave that opened July.
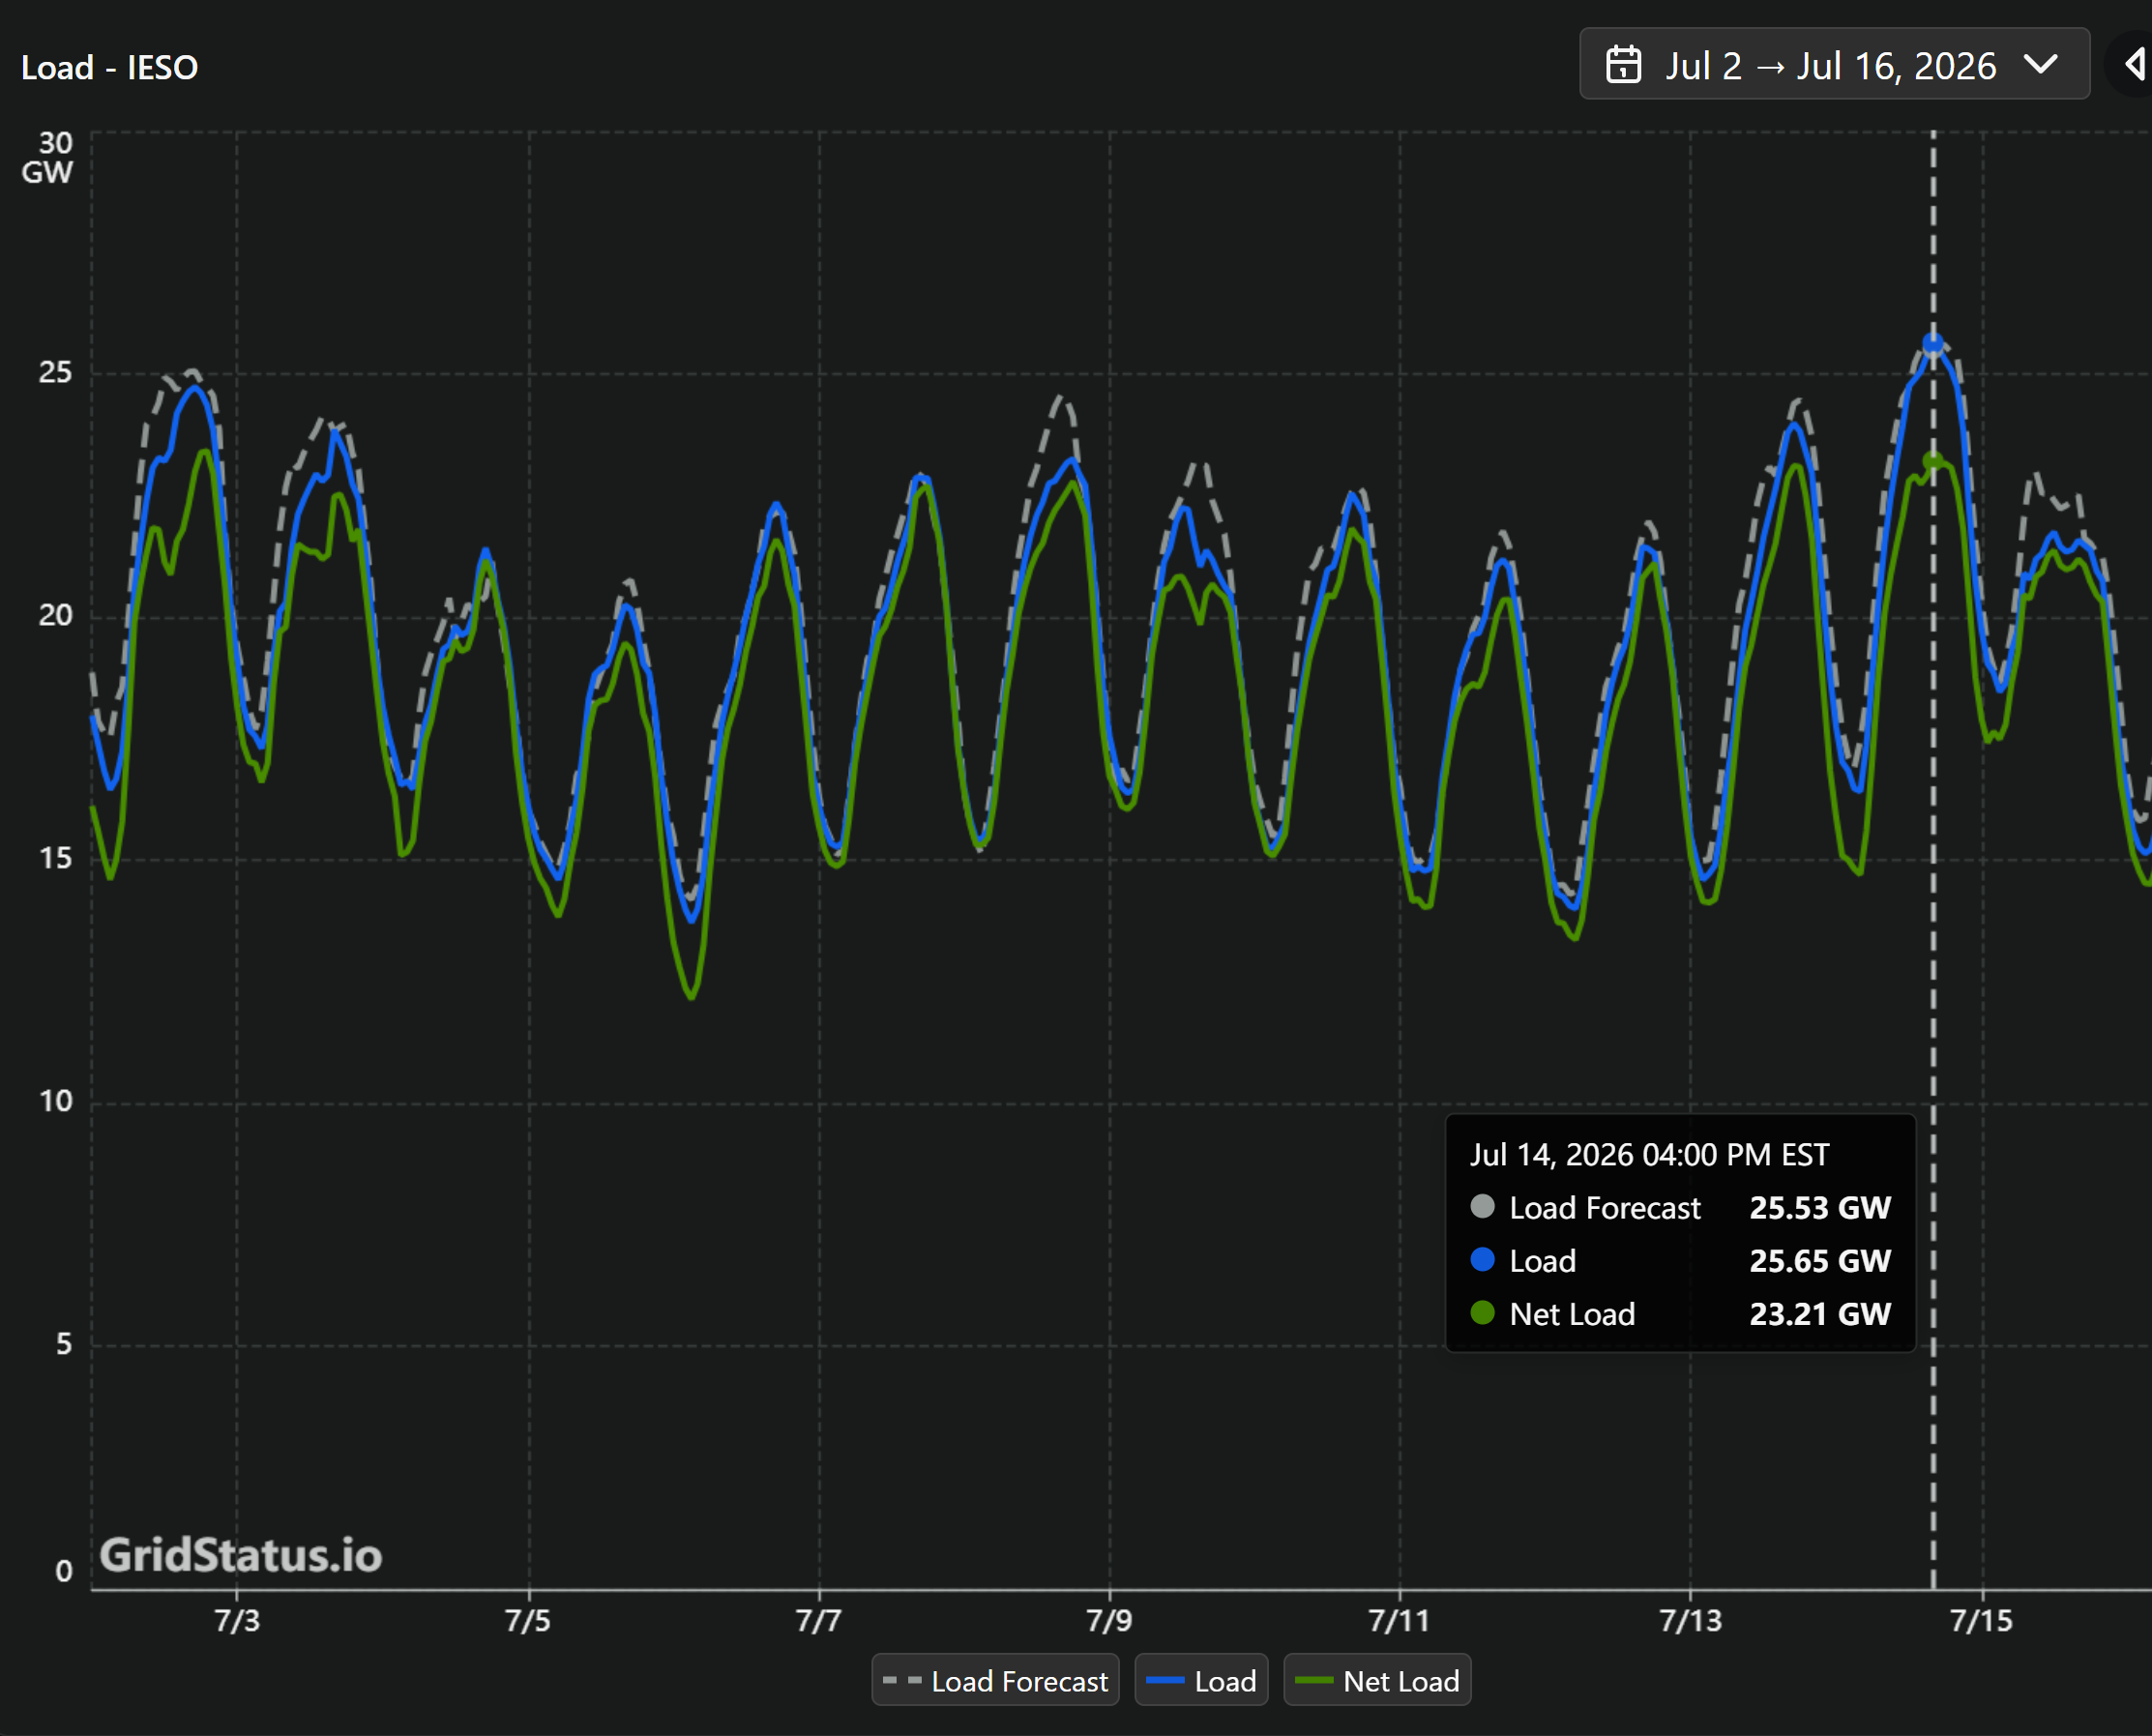
This level of demand was the highest peak in 15 years.
While fires remain west of Lake Nipigon, further impacts on generation seem unlikely, but if they move further east, more generation and transmission will fall into their path.
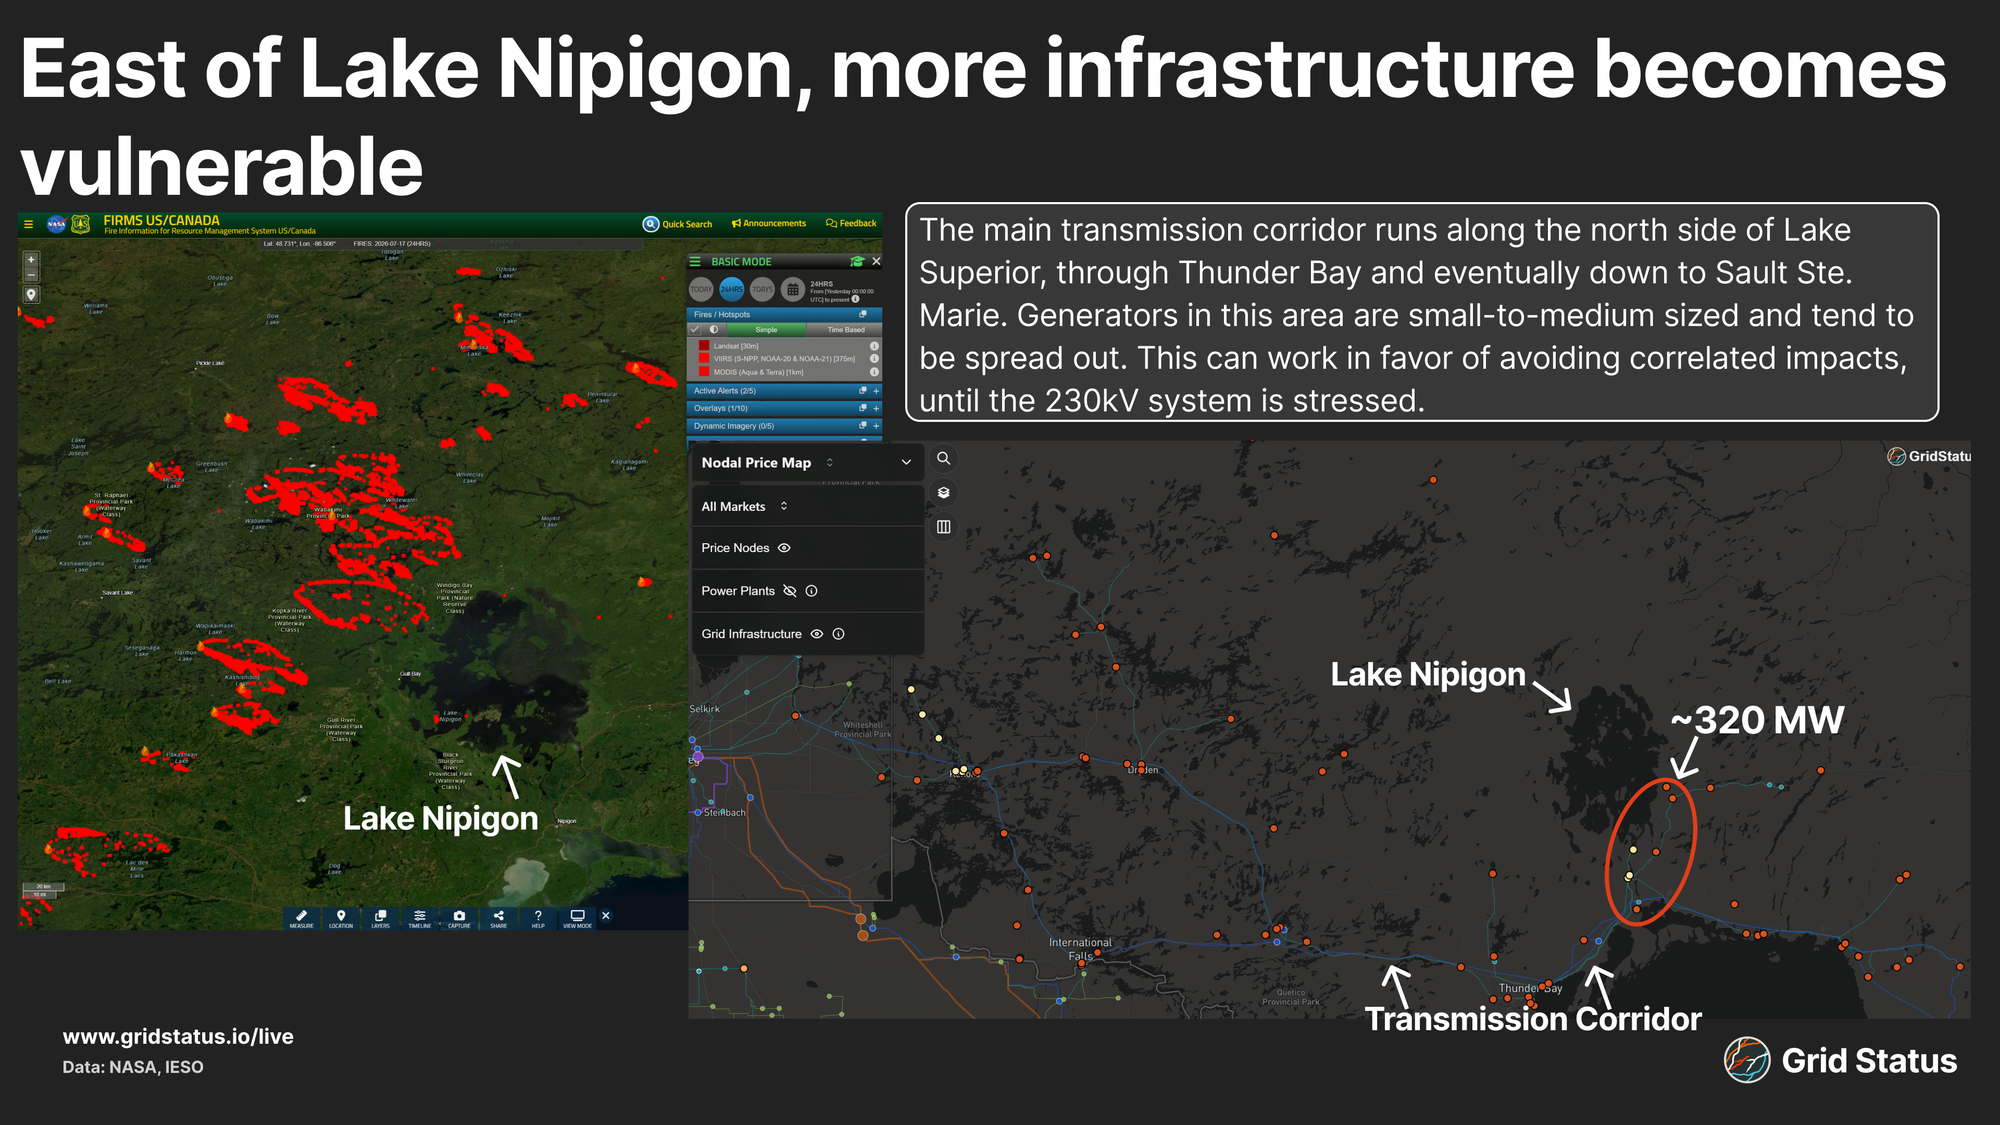
The main transmission corridor in the region runs along the north side of Lake Superior, through Thunder Bay and eventually down to Sault Ste. Marie. Generators in this area are small-to-medium-sized and tend to be spread out. This can work in favor of avoiding correlated impacts until the 230kV system is stressed. There are another ~390 MWs of capacity further to the west, as well as connections with Minnesota and Manitoba. While the line limits for interchange are low, the region is also sparsely populated.
Behind the Meter Misfortune in NYISO
Wildfire smoke pushed NYISO's BTM solar forecasts to the breaking point on Wednesday.
On July 15th, NYISO had the largest forecast error to date for behind-the-meter (BTM) solar across the state’s system.
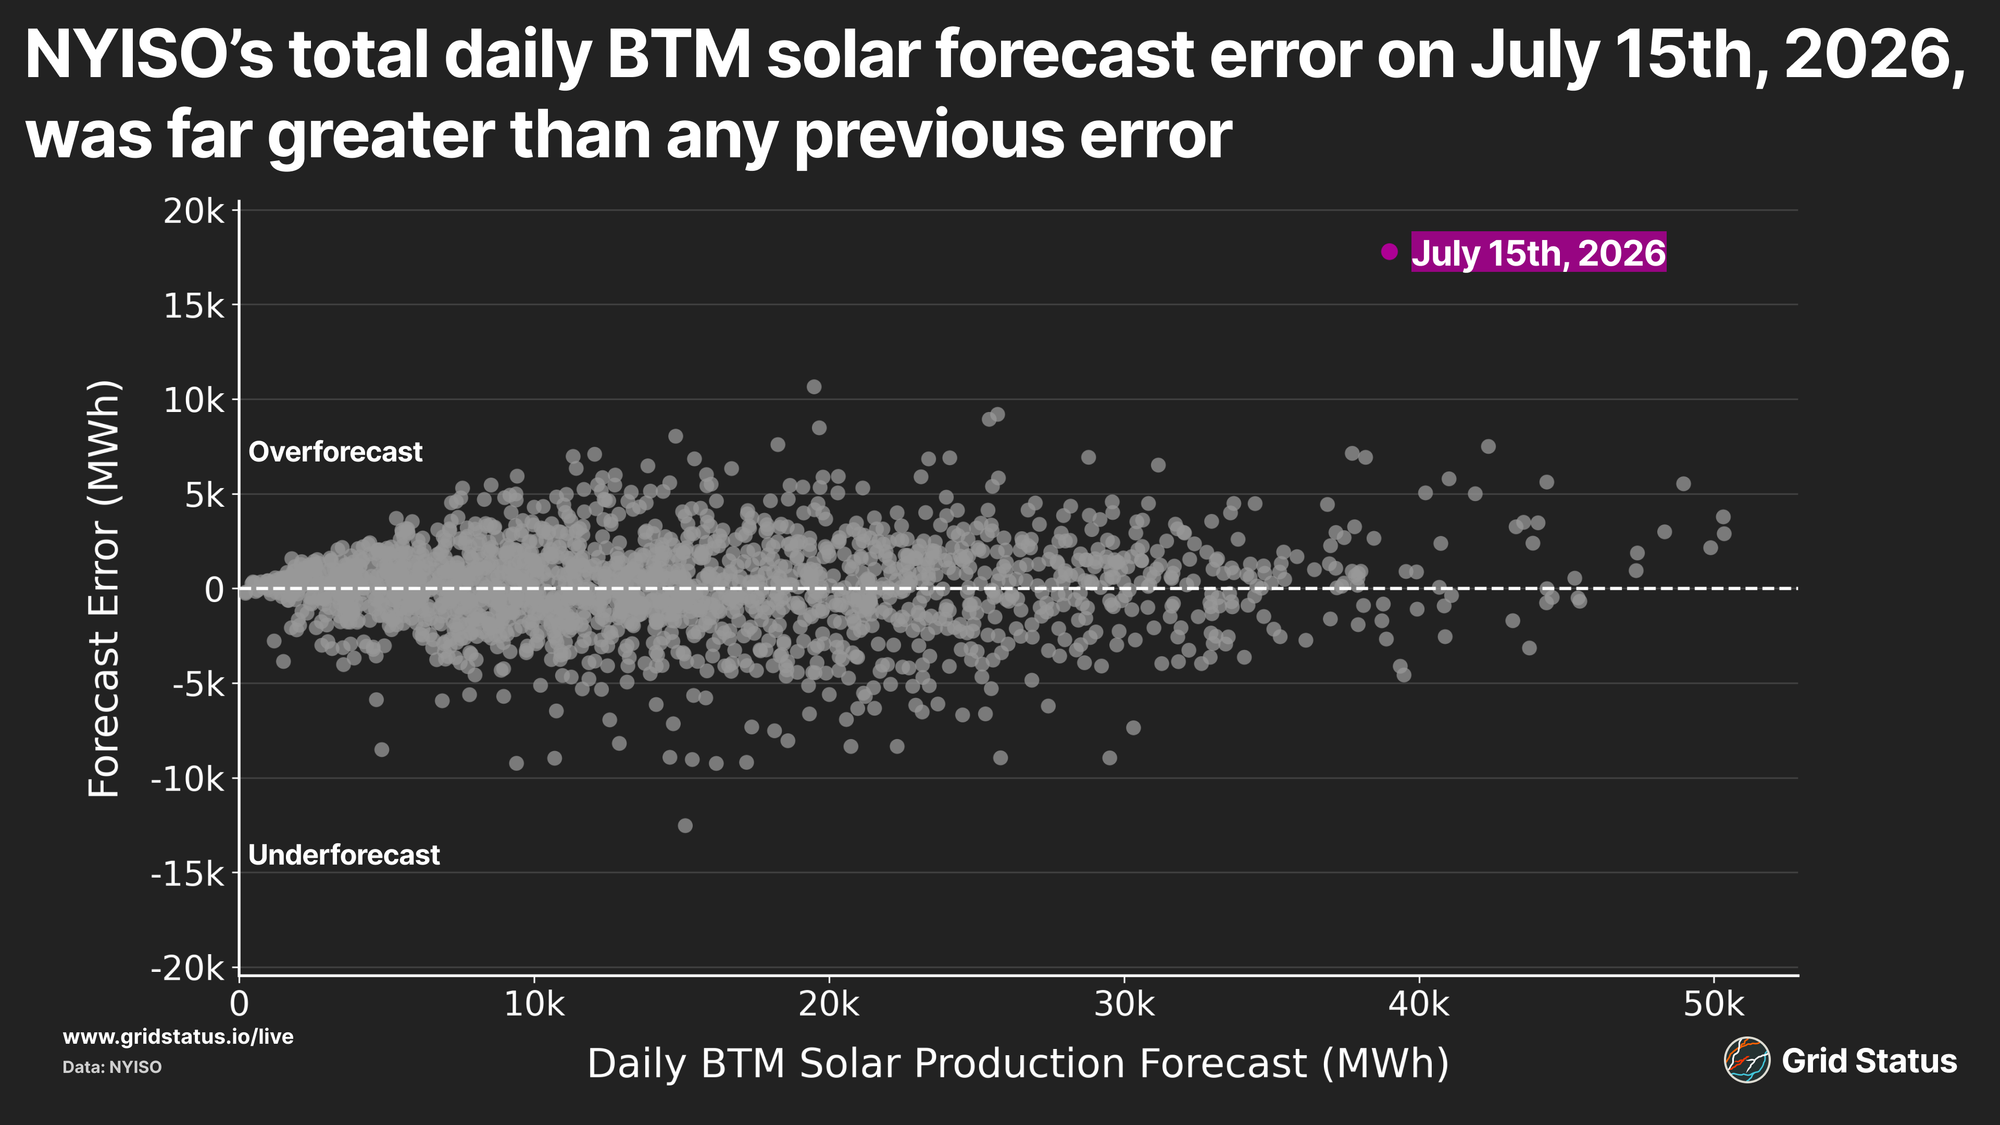
On a daily basis, the total error was far beyond any previous day. Over time, this isn't necessarily surprising, as more capacity comes online, there is a greater opportunity for forecast error during similar situations.
I limited the visualized data to start in 2021, but there wouldn't have been sufficient capacity in prior months to match these values, even with a complete miss. Unlike New England, NYISO’s hourly forecast error isn’t so concentrated on one side of over- or under-forecasting.
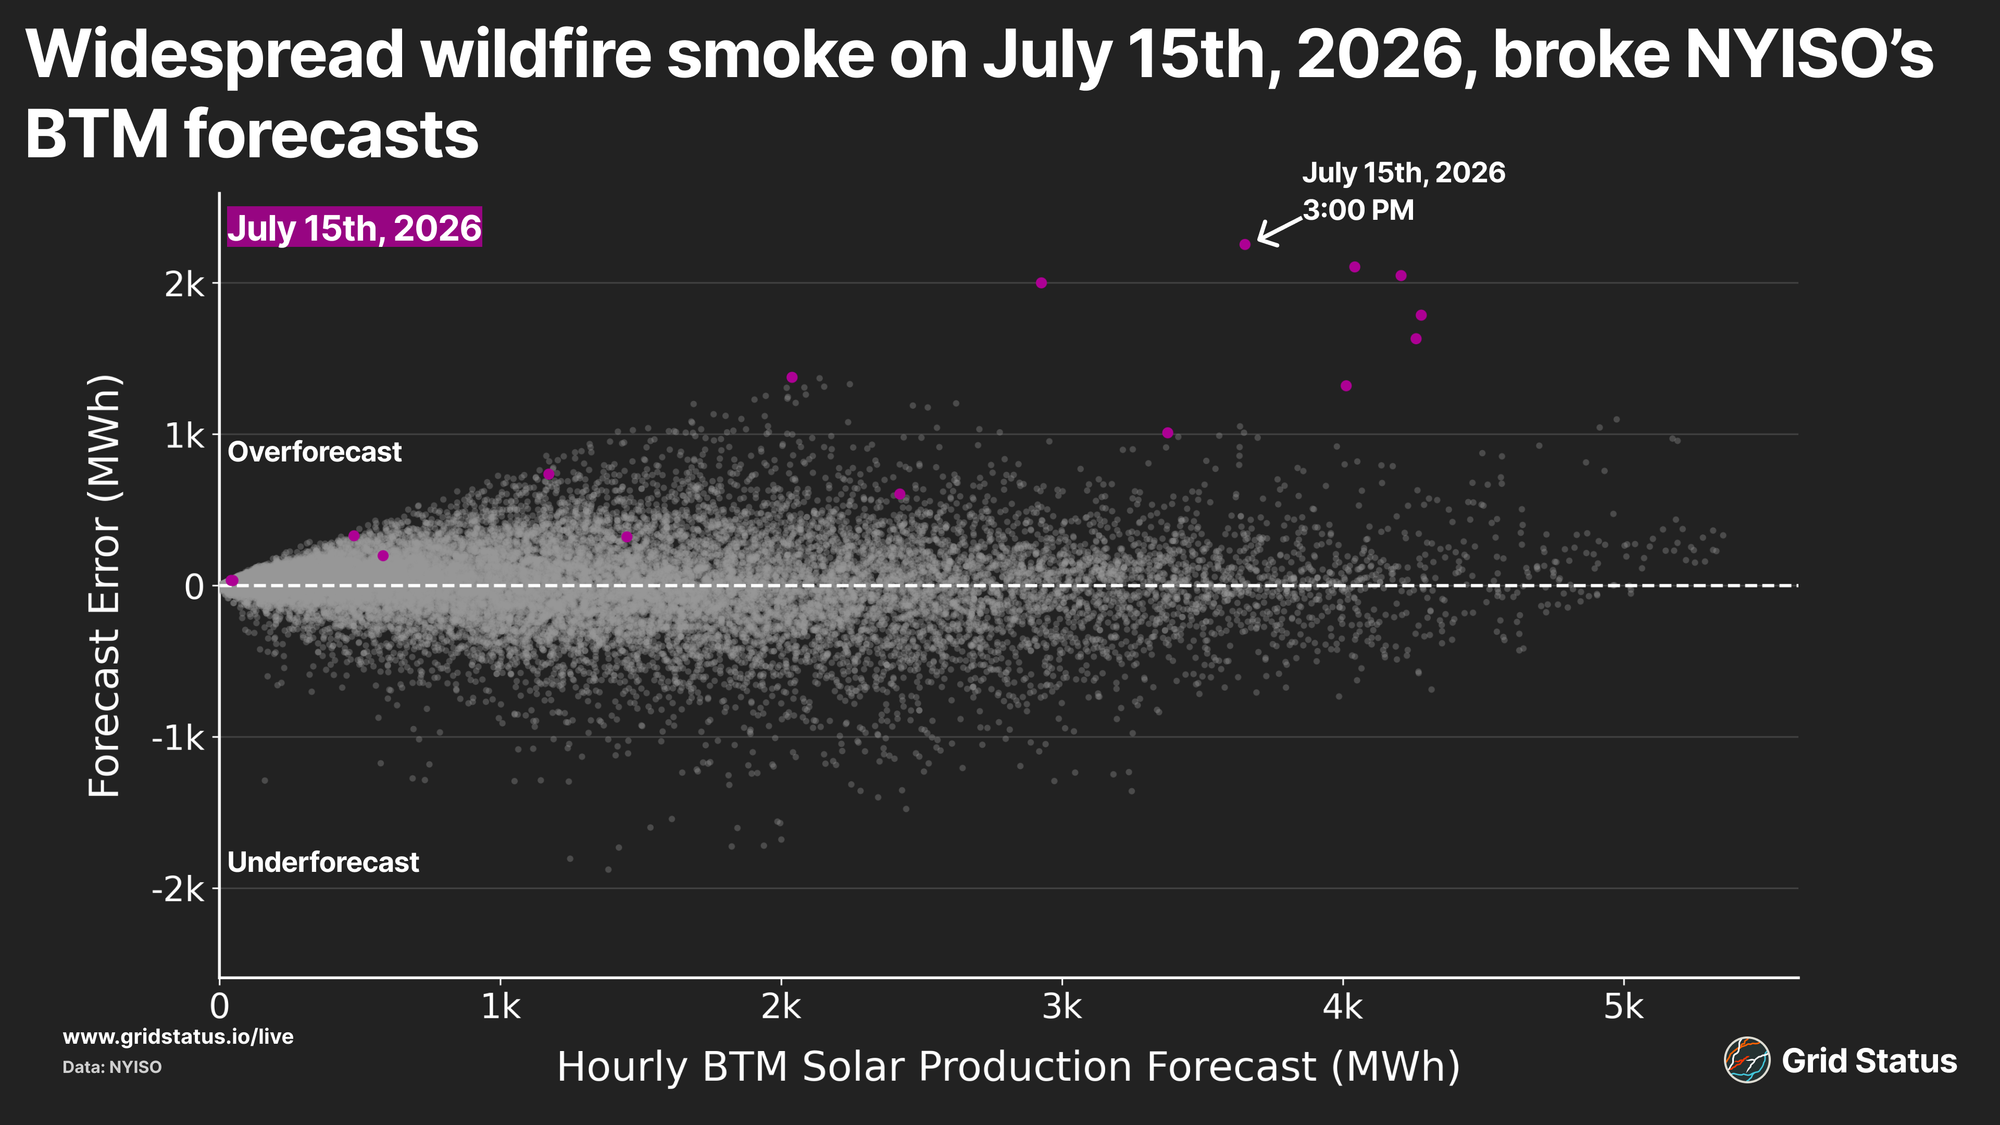
On an hourly basis, the top ten largest error hours of all time are now dominated by yesterday's results. Out of zones, Genese, Mohawk Valley, and Central had particularly large misses, while zones downstate like Dunwoodie and Long Island have experienced a larger mismatch during previous events.
Load Impacts in PJM
Until Thursday, July 16th, the bulk of PJM’s geography had largely avoided impacts. As smoke finally pushed past COMED and into the broader region, impacts on demand materialized in the Mid-Atlantic portion of the RTO.
Despite a peak forecast of 161,322 MW just two days earlier, RTO-wide load underperformed all forecasts, peaking at 154,181 MW, a 4.6% miss.
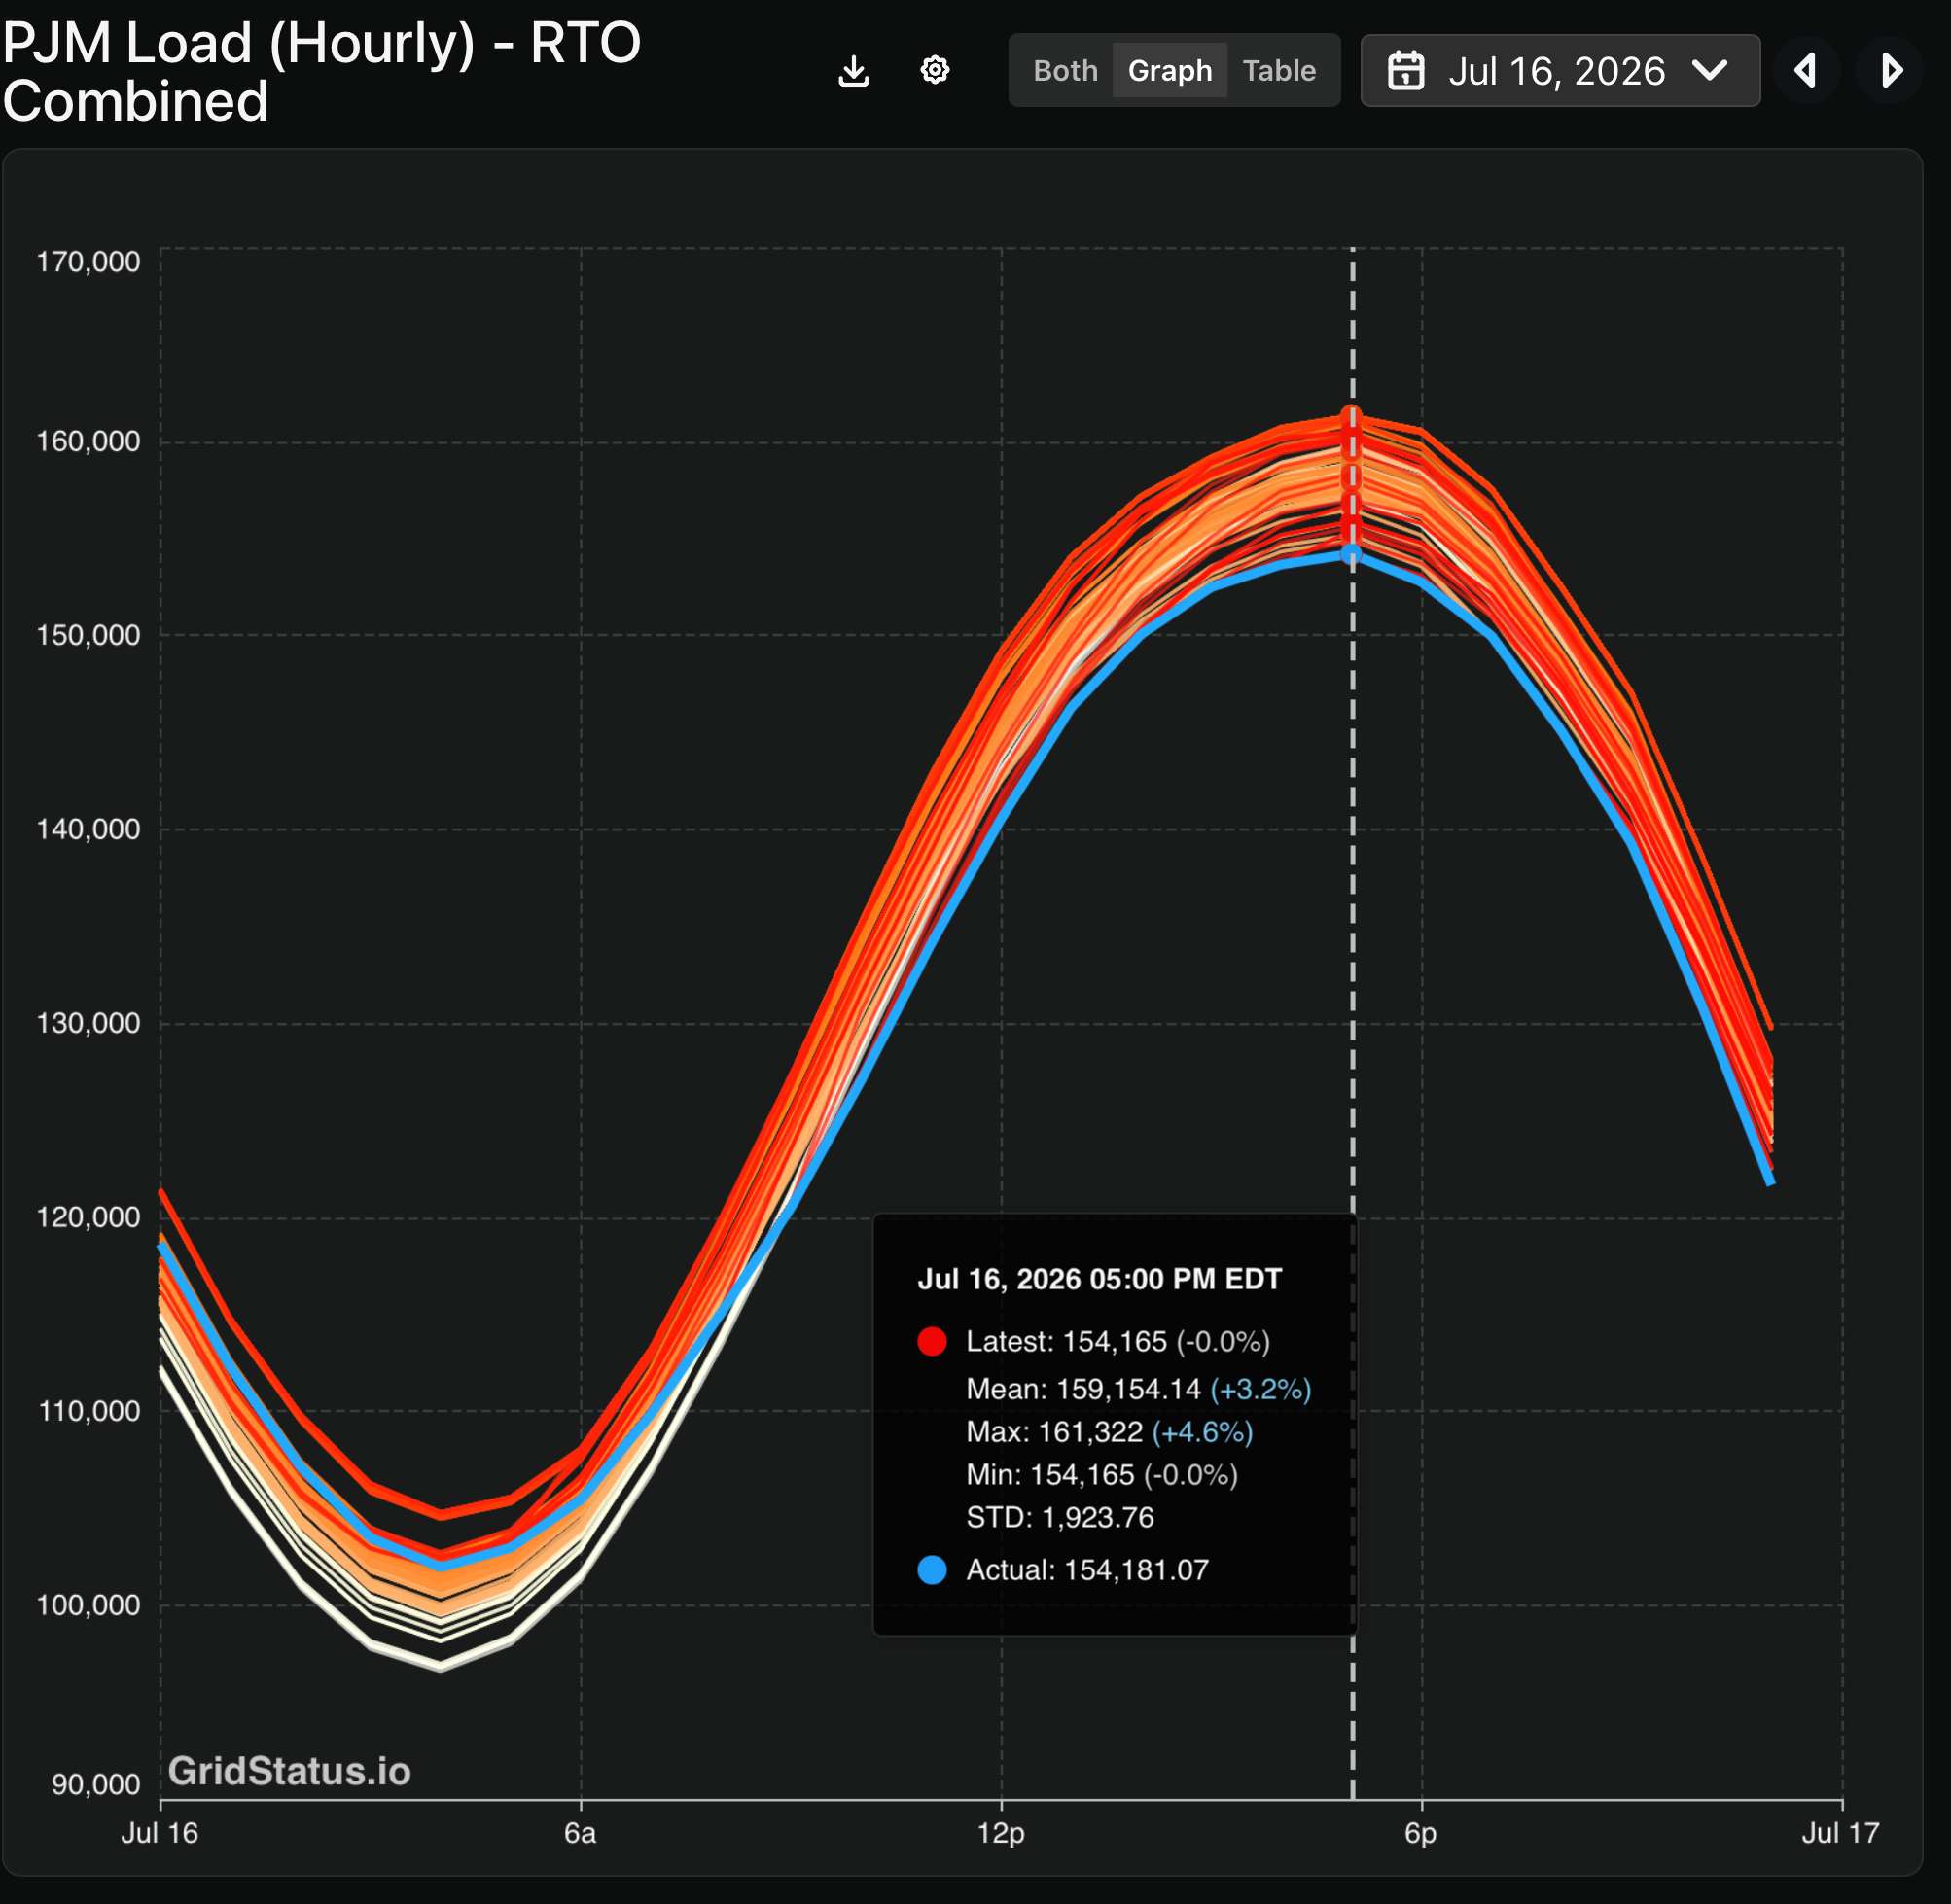
Even with a miss of this magnitude, the downside was not evenly spread across the market. The majority of the miss was due to underperformance in the Mid-Atlantic region, where load fell 3,855 MW short of the RTO’s peak forecast.
During the peak hour, the Mid-Atlantic, which made up just a third of the RTO’s total peak load, accounted for nearly 55% of the region’s total demand miss.
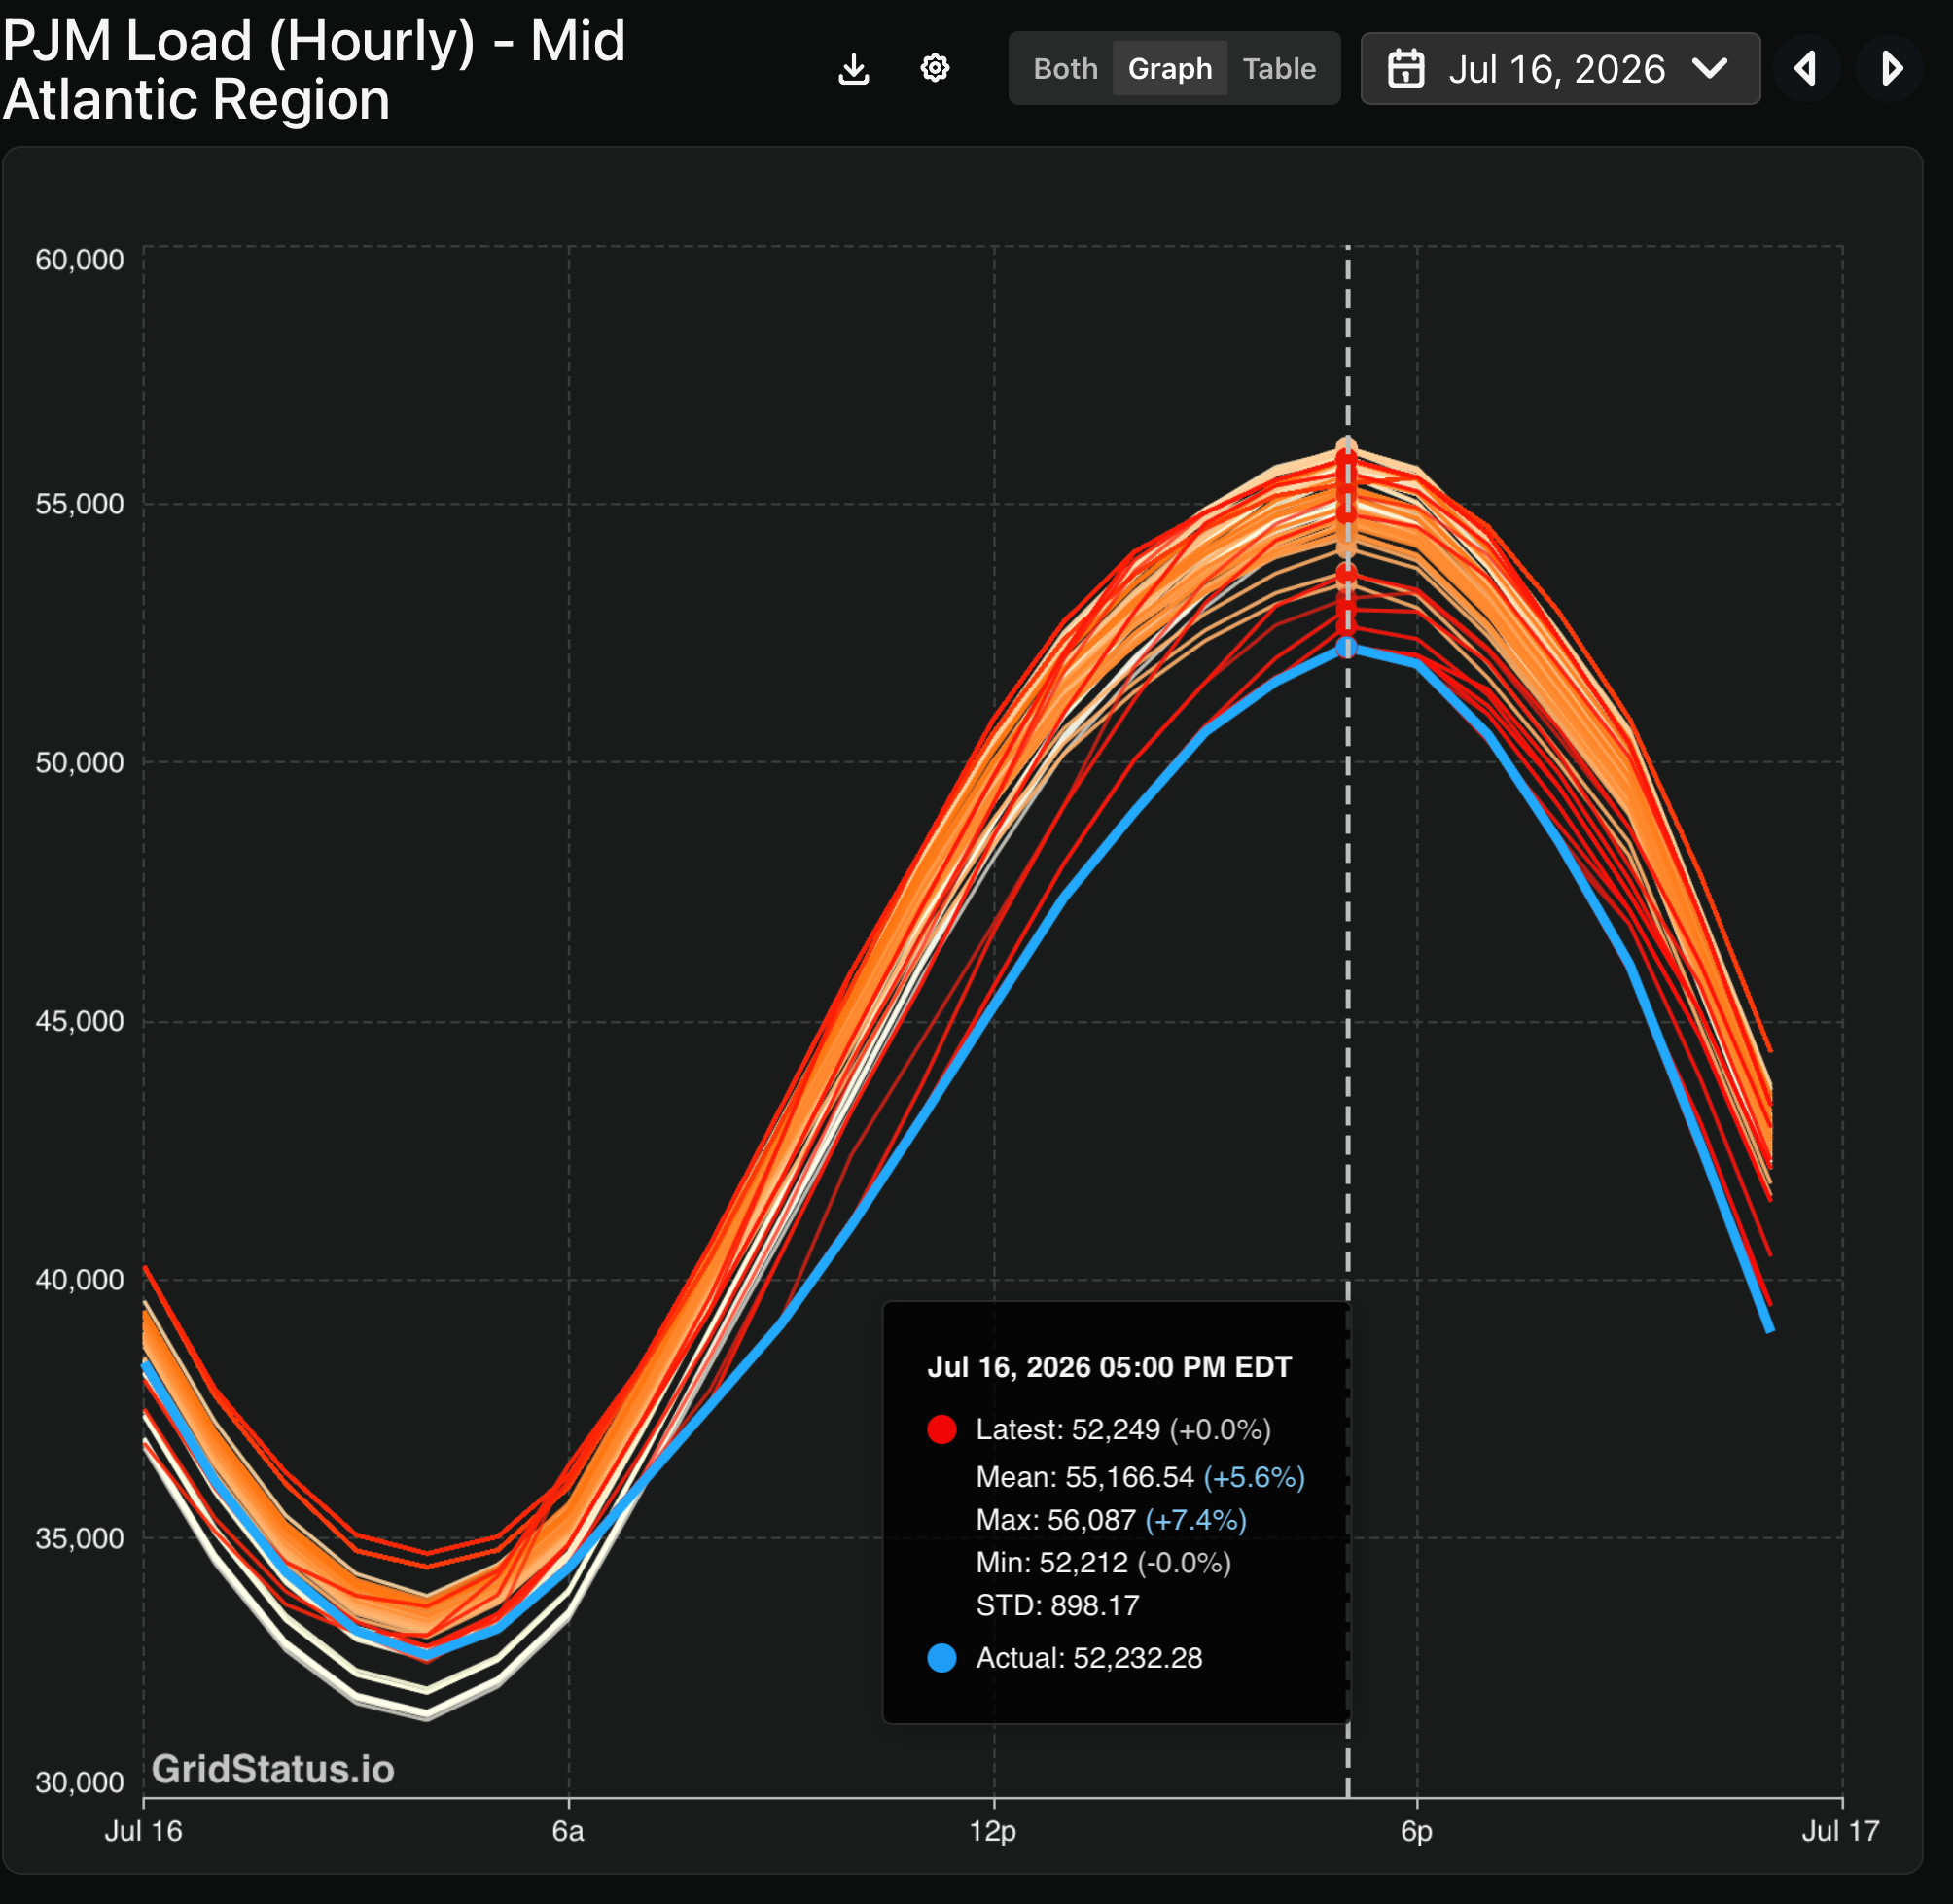
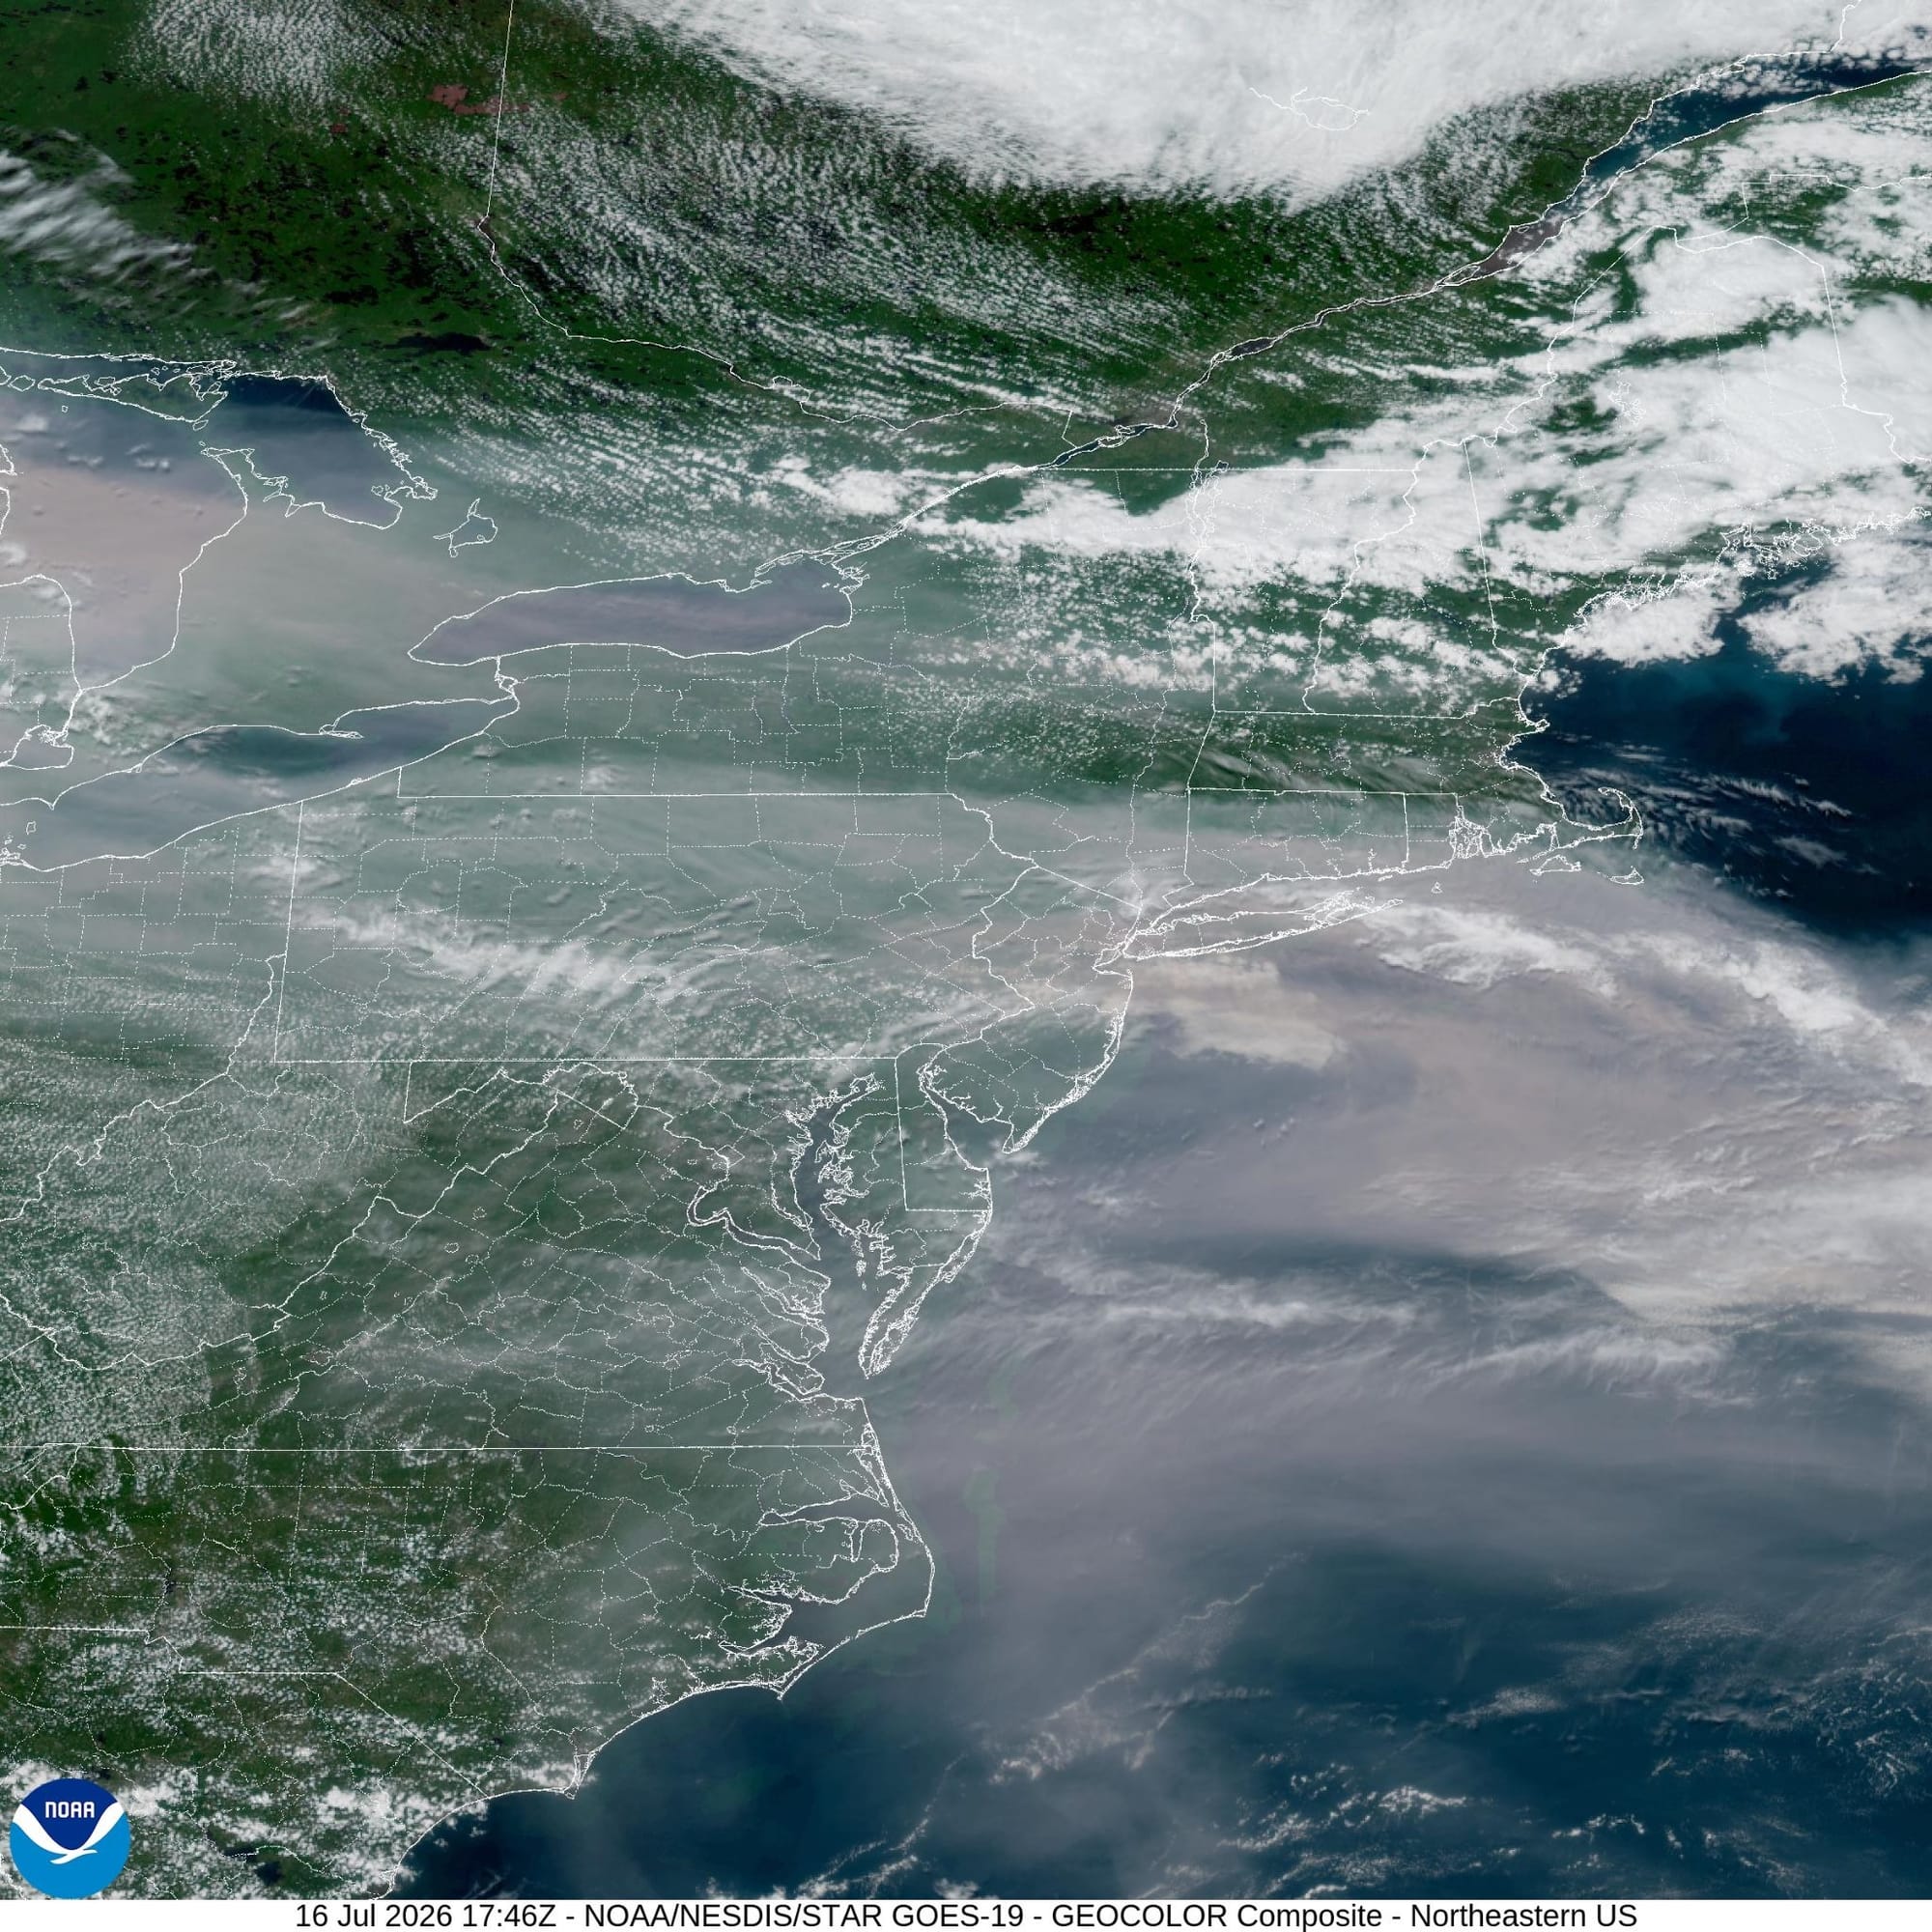
This miss was largely driven by an increase in wildfire smoke concentrated above the Mason-Dixon line, reducing cooling load in the Mid-Atlantic by blocking out the sun.
The impact of this load miss also shaped market outcomes. Over the morning, source-side underperformance helped contribute to congestion on the Conastone-Peach Bottom 500kV line, driven in large part by flows from the Mid-Atlantic south of the Mason-Dixon line. Flows were so strong that a NERC Transmission Loading Relief was issued for the line itself, giving operators more control to mitigate violations on the network.
Smoke had a market-wide impact largely due to the level of load underperformance in the Mid-Atlantic.
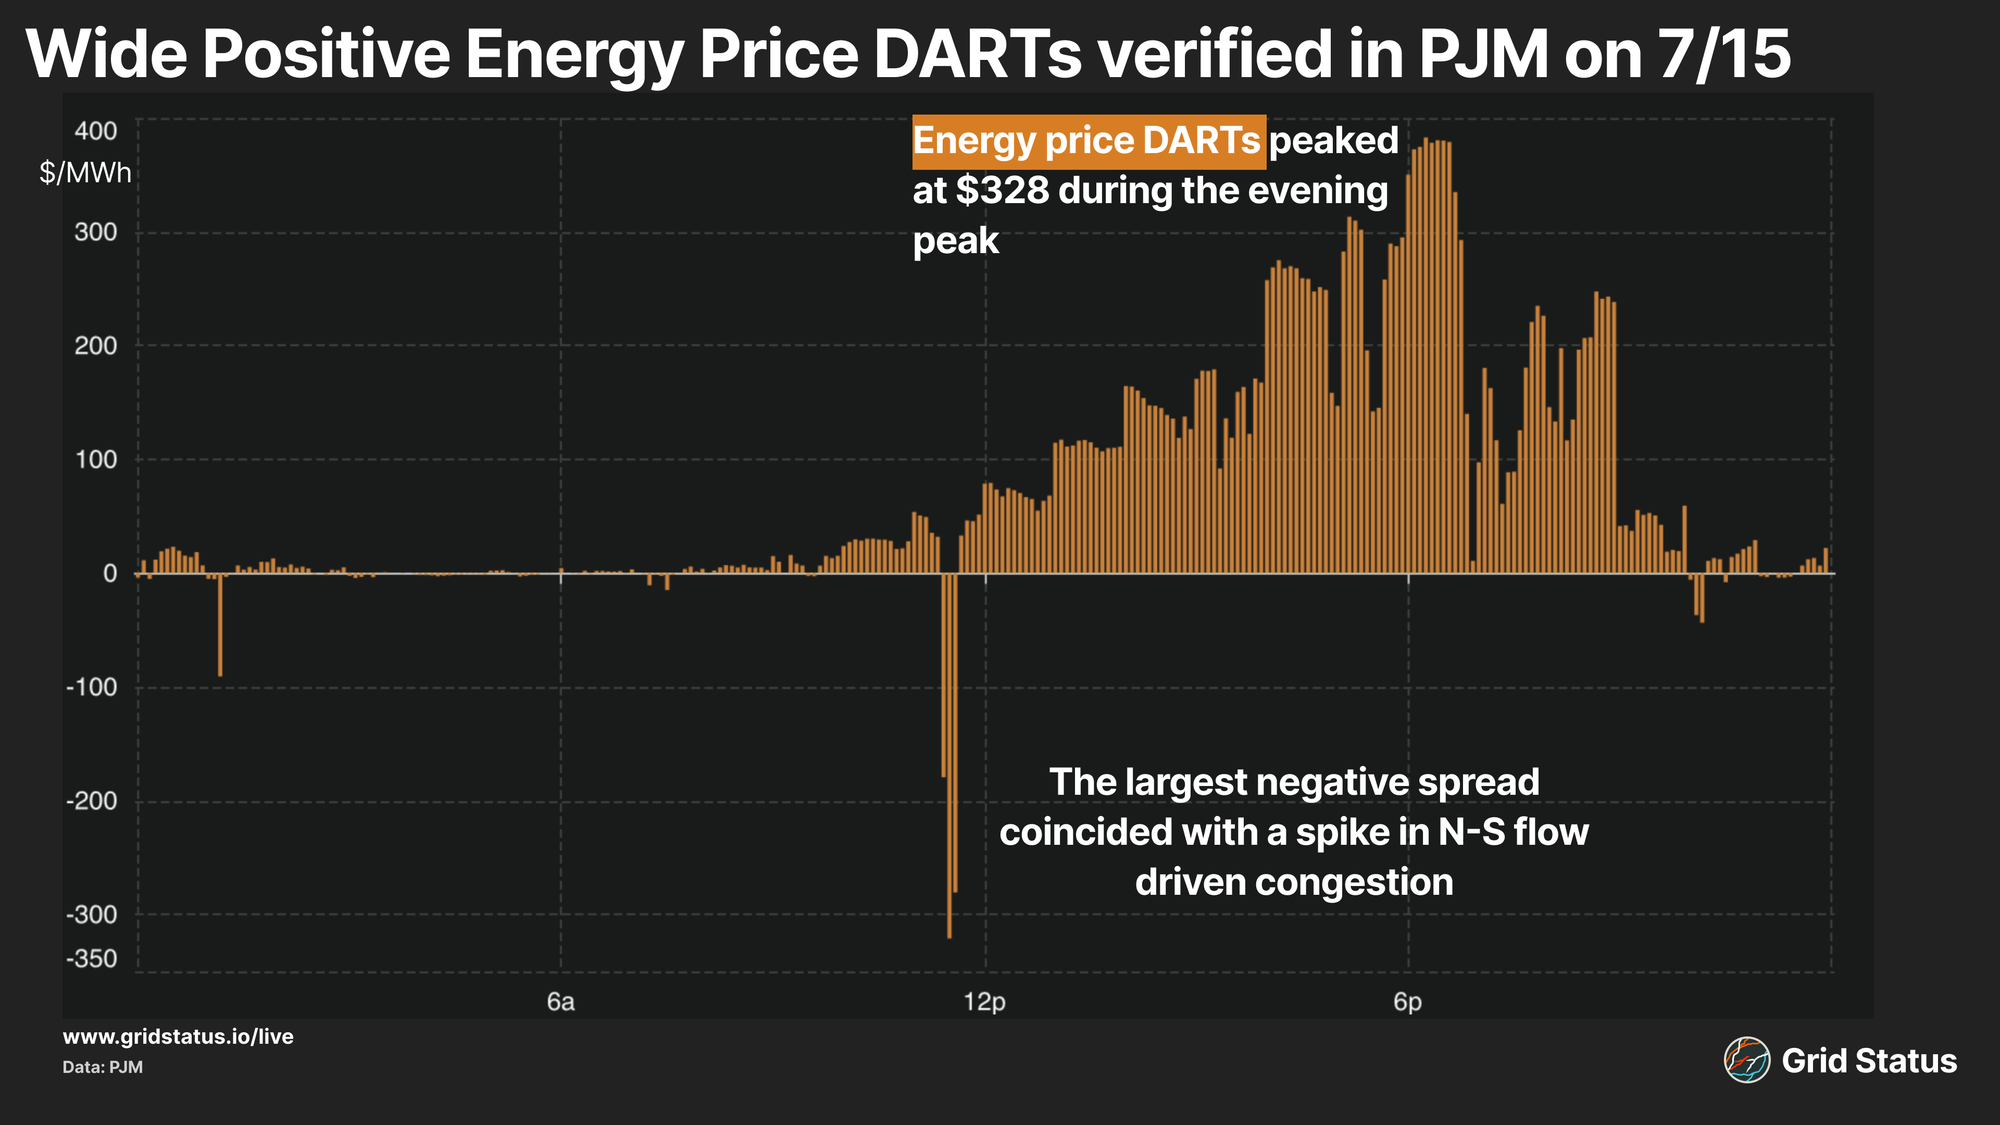
Real-time system-wide energy prices heavily underperformed the day-ahead clear throughout the afternoon and evening, which lines up with the impacts of wildfire smoke as the day-ahead market priced in the cost of serving cooling load that failed to materialize. Prices underperformed by over $300/MWh through almost all of HE 19.
Minimal MISO Impacts
The midcontinent saw smoke creep into Michigan on Wednesday and into Thursday, covering Wisconsin, eastern Illinois, and Minnesota. With MISO’s large footprint (spanning the Canadian border down to the Gulf), impacts were more muted as a smaller percentage of the grid saw smoke cover. MISO breaks out its DA clear by fuel mix in three regions, looking at Central, which includes Michigan and Illinois, we see real-time solar decrease day over day.
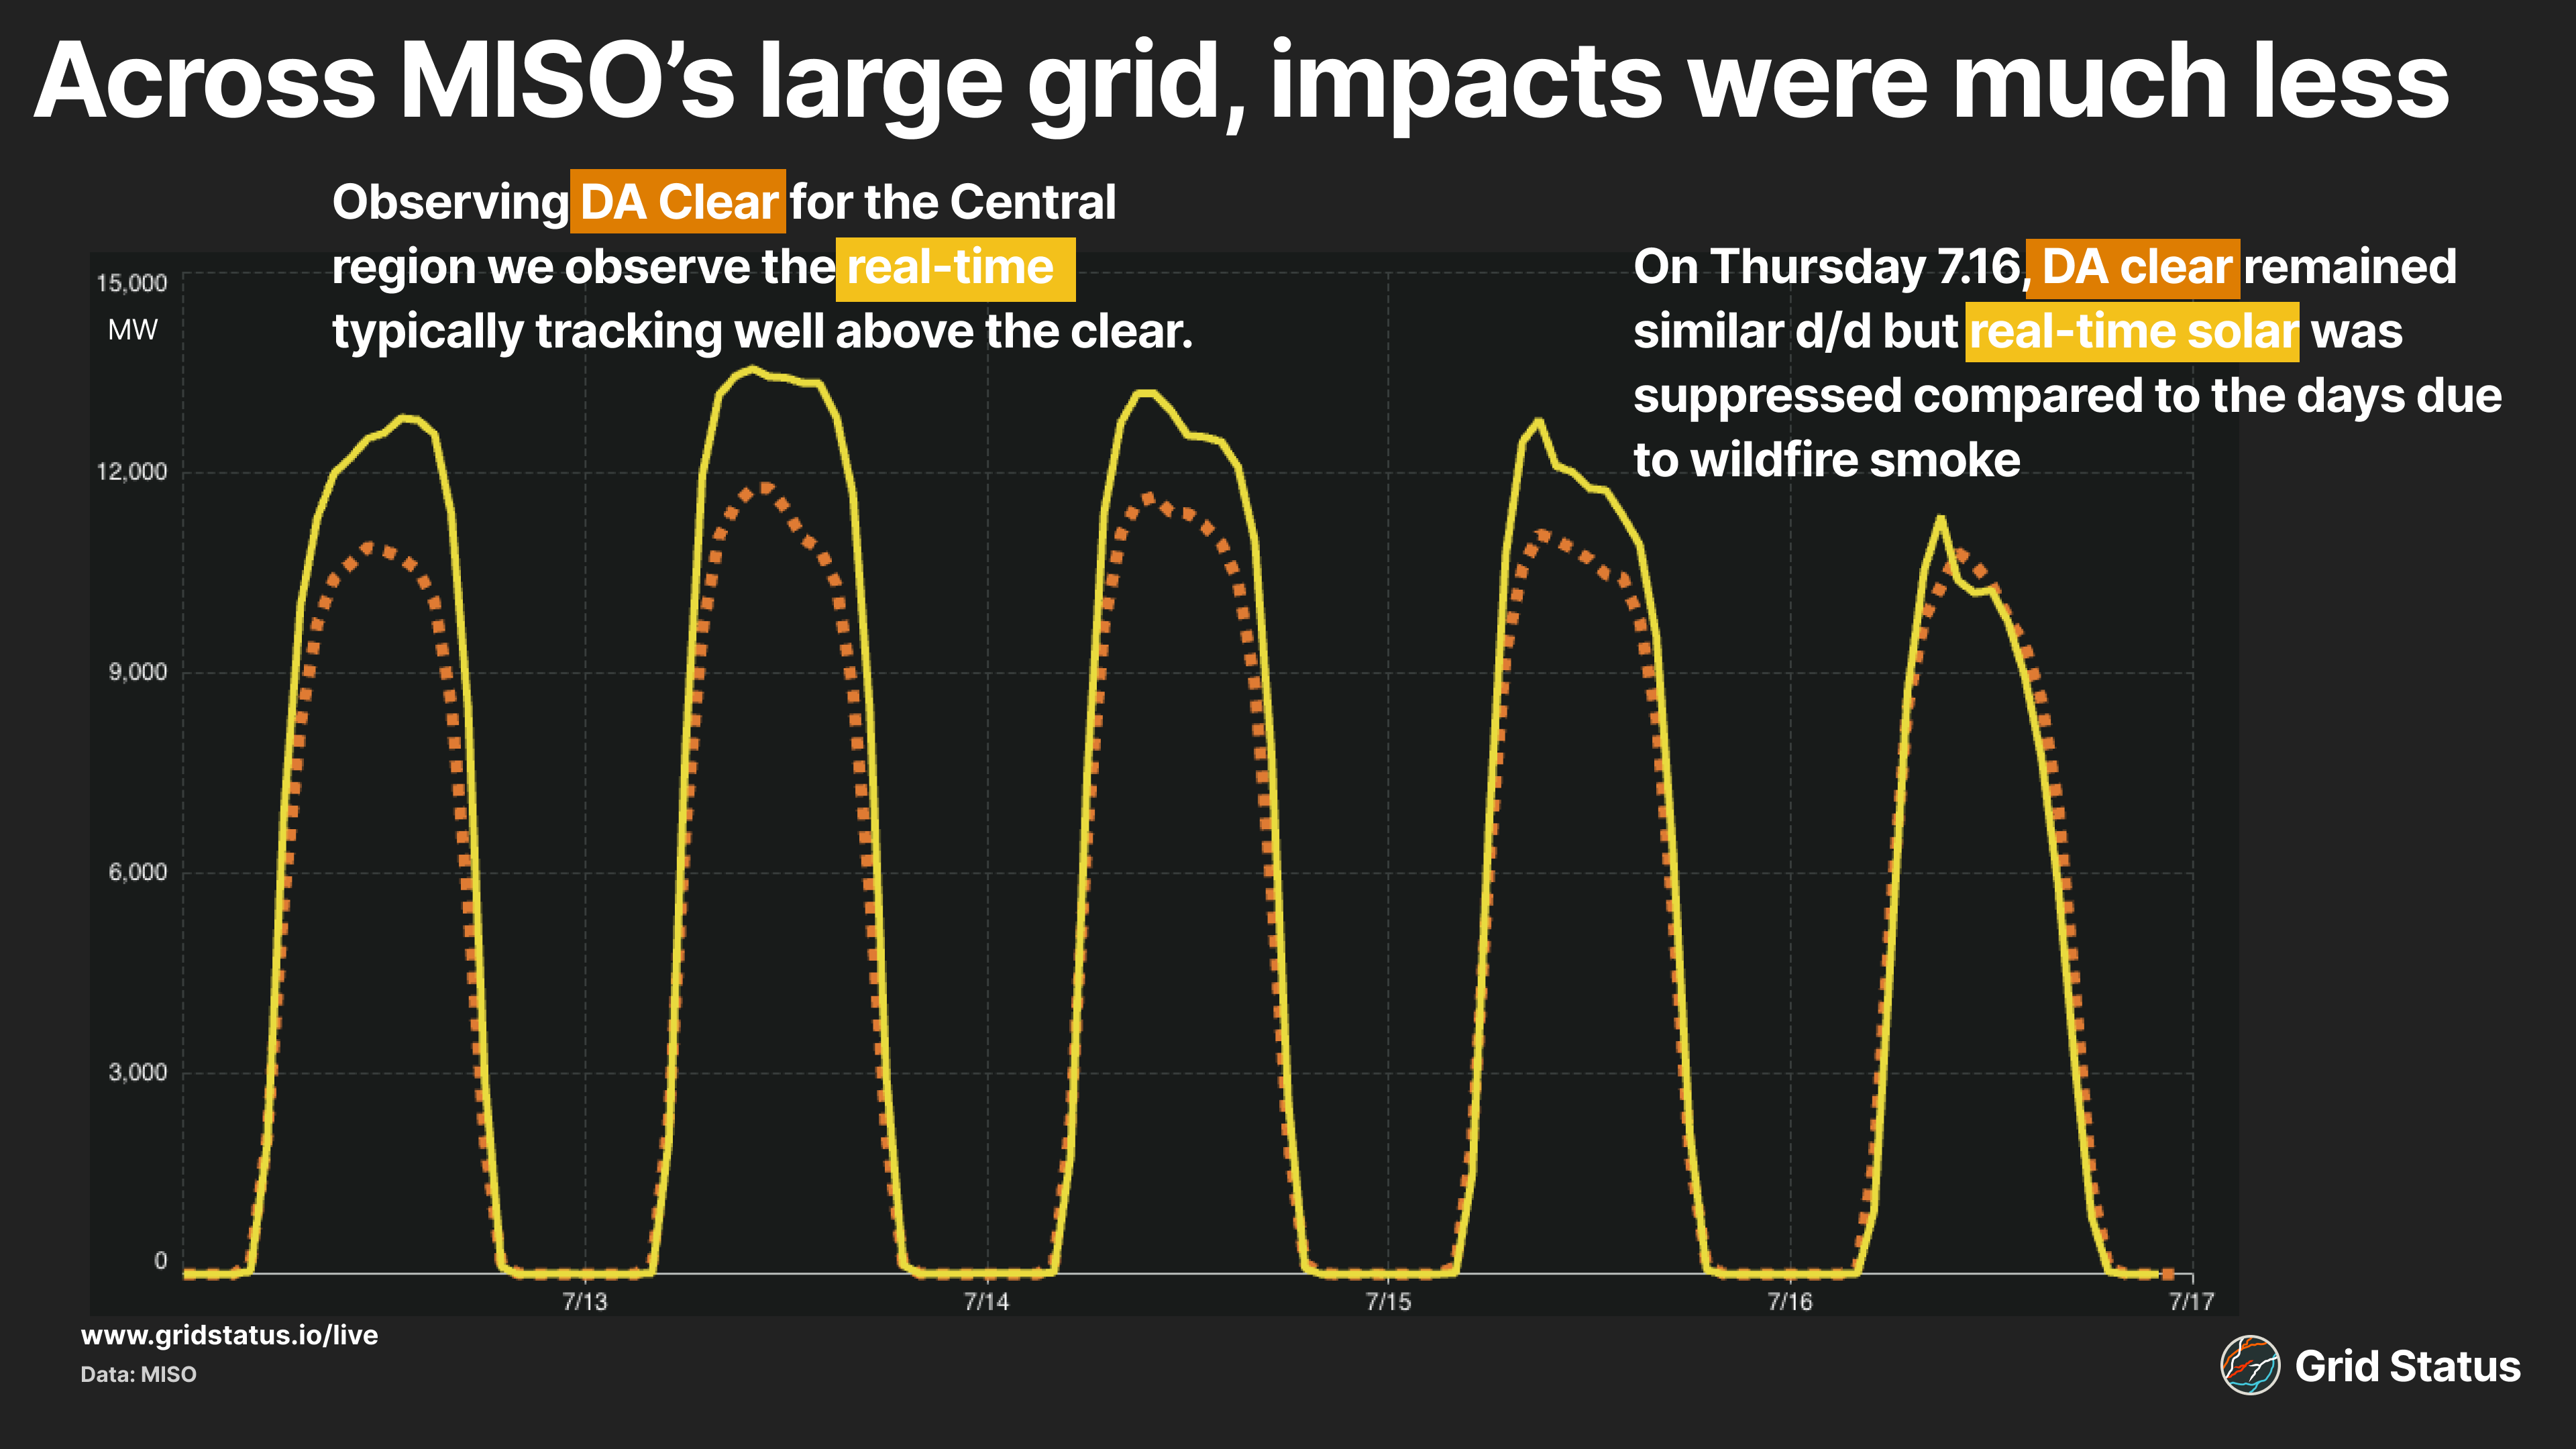
The Day Ahead clear for solar actually stayed consistent, but on the day with the most smoke cover, real-time solar tracked more in line with the clear, which is unusual.
With its proximity to the smoke and smaller solar resource, impacts in the North region of MISO can be more readily observed.
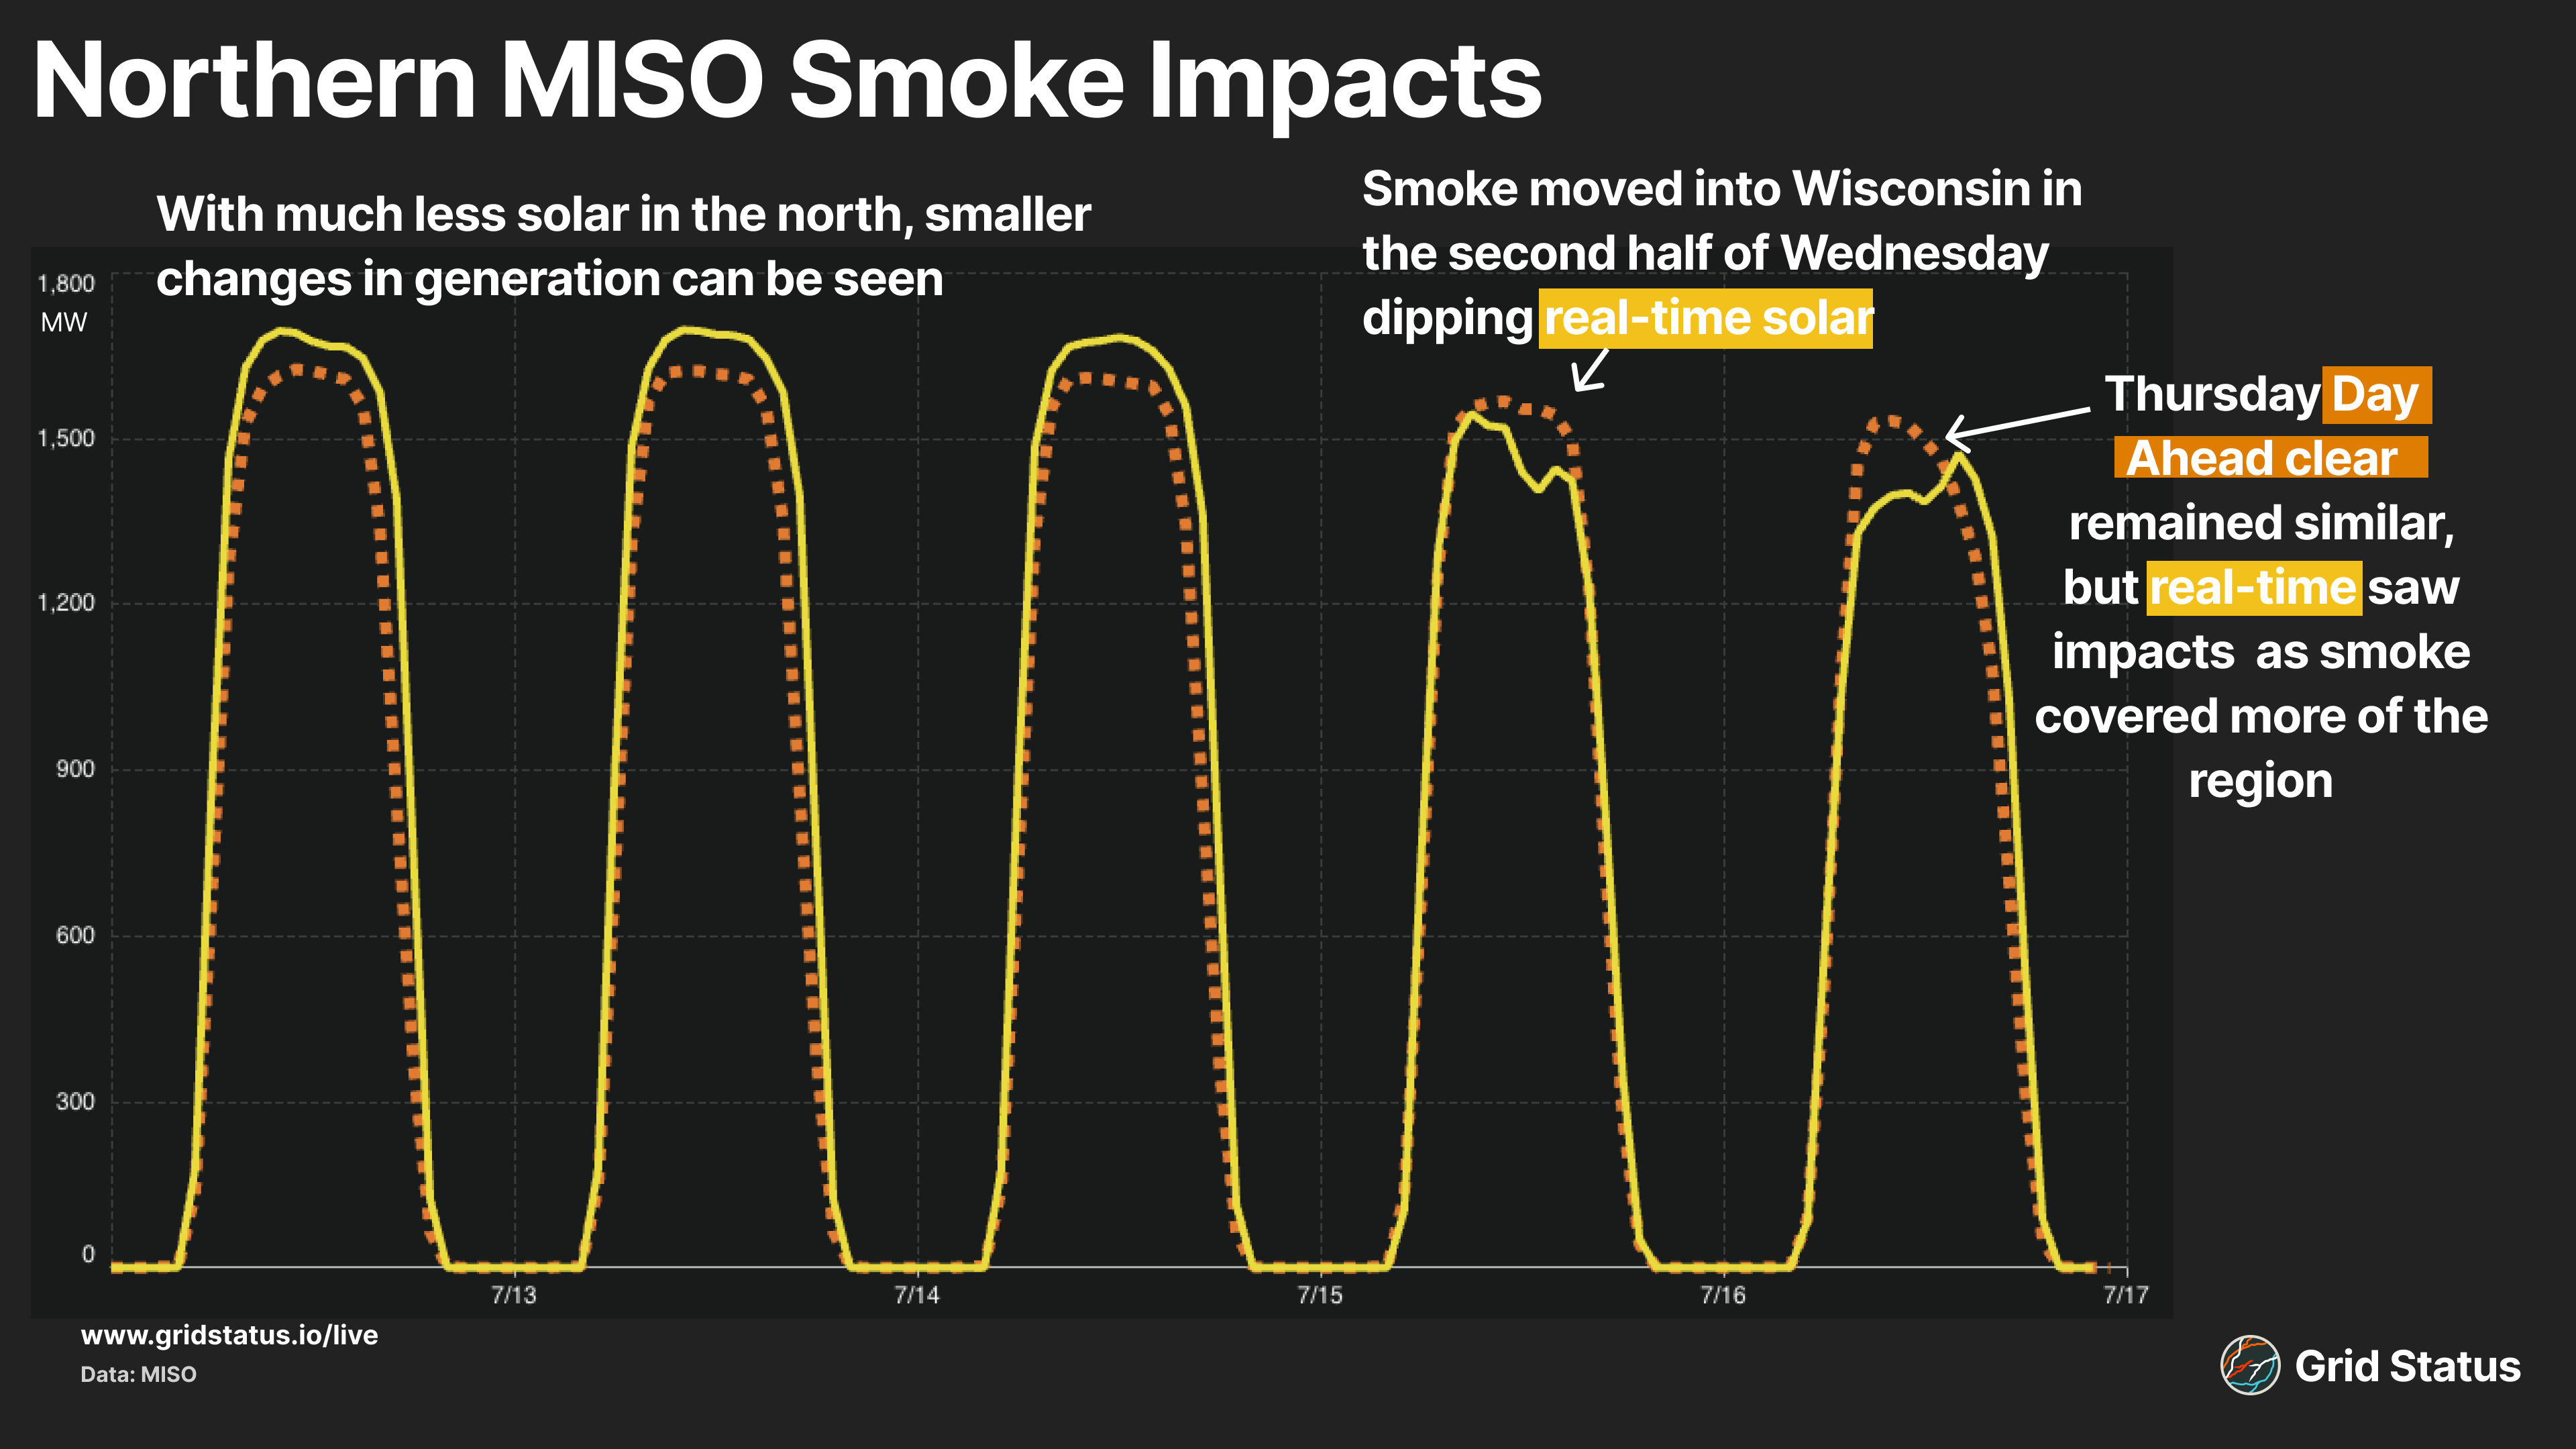
Despite the somewhat larger impact, it was still small relative to both the North region and MISO as a whole. With overall less solar, impacts to the grid remained minimal.
MISO regularly underforecasts solar generation, which we can observe earlier in the week. MISO noted in its Summer Readiness Workshop that real-time solar uncertainty is substantially more difficult to forecast than wind. This may be related to consistent underforecasting; better to ensure enough dispatchable generation is available to clear in the market.
Solar has grown quickly in MISO, so as more historical data becomes available, it will be interesting to see if forecasts start to become more accurate.
Sundown
Unfortunately, worsening drought conditions are expected to continue to drive wildfire risks not only in Canada but in the United States as well. Low winter precipitation and reduced snowpack levels have effectively rendered portions of the Western Interconnection a tinderbox, and Canada's vast wilderness is clearly under threat from fires.
We’ll continue to track wildfire impacts across the market and in real-time on our dedicated tab on Grid Status Insights.