Batteries Boom but Solar Slides in CAISO
For the first time in years, CAISO's solar output in April declined, but wind broke records after a 4-year drought. Gas was down, curtailment up, and battery operations continued to expand. We track all of these and more during a busy spring in California.


For the 4th year running, we’re taking a look at CAISO operations during April. As we’ve said in the past, April isn’t indicative of the entire year, but it is a glimpse into possible grid futures for California and beyond.
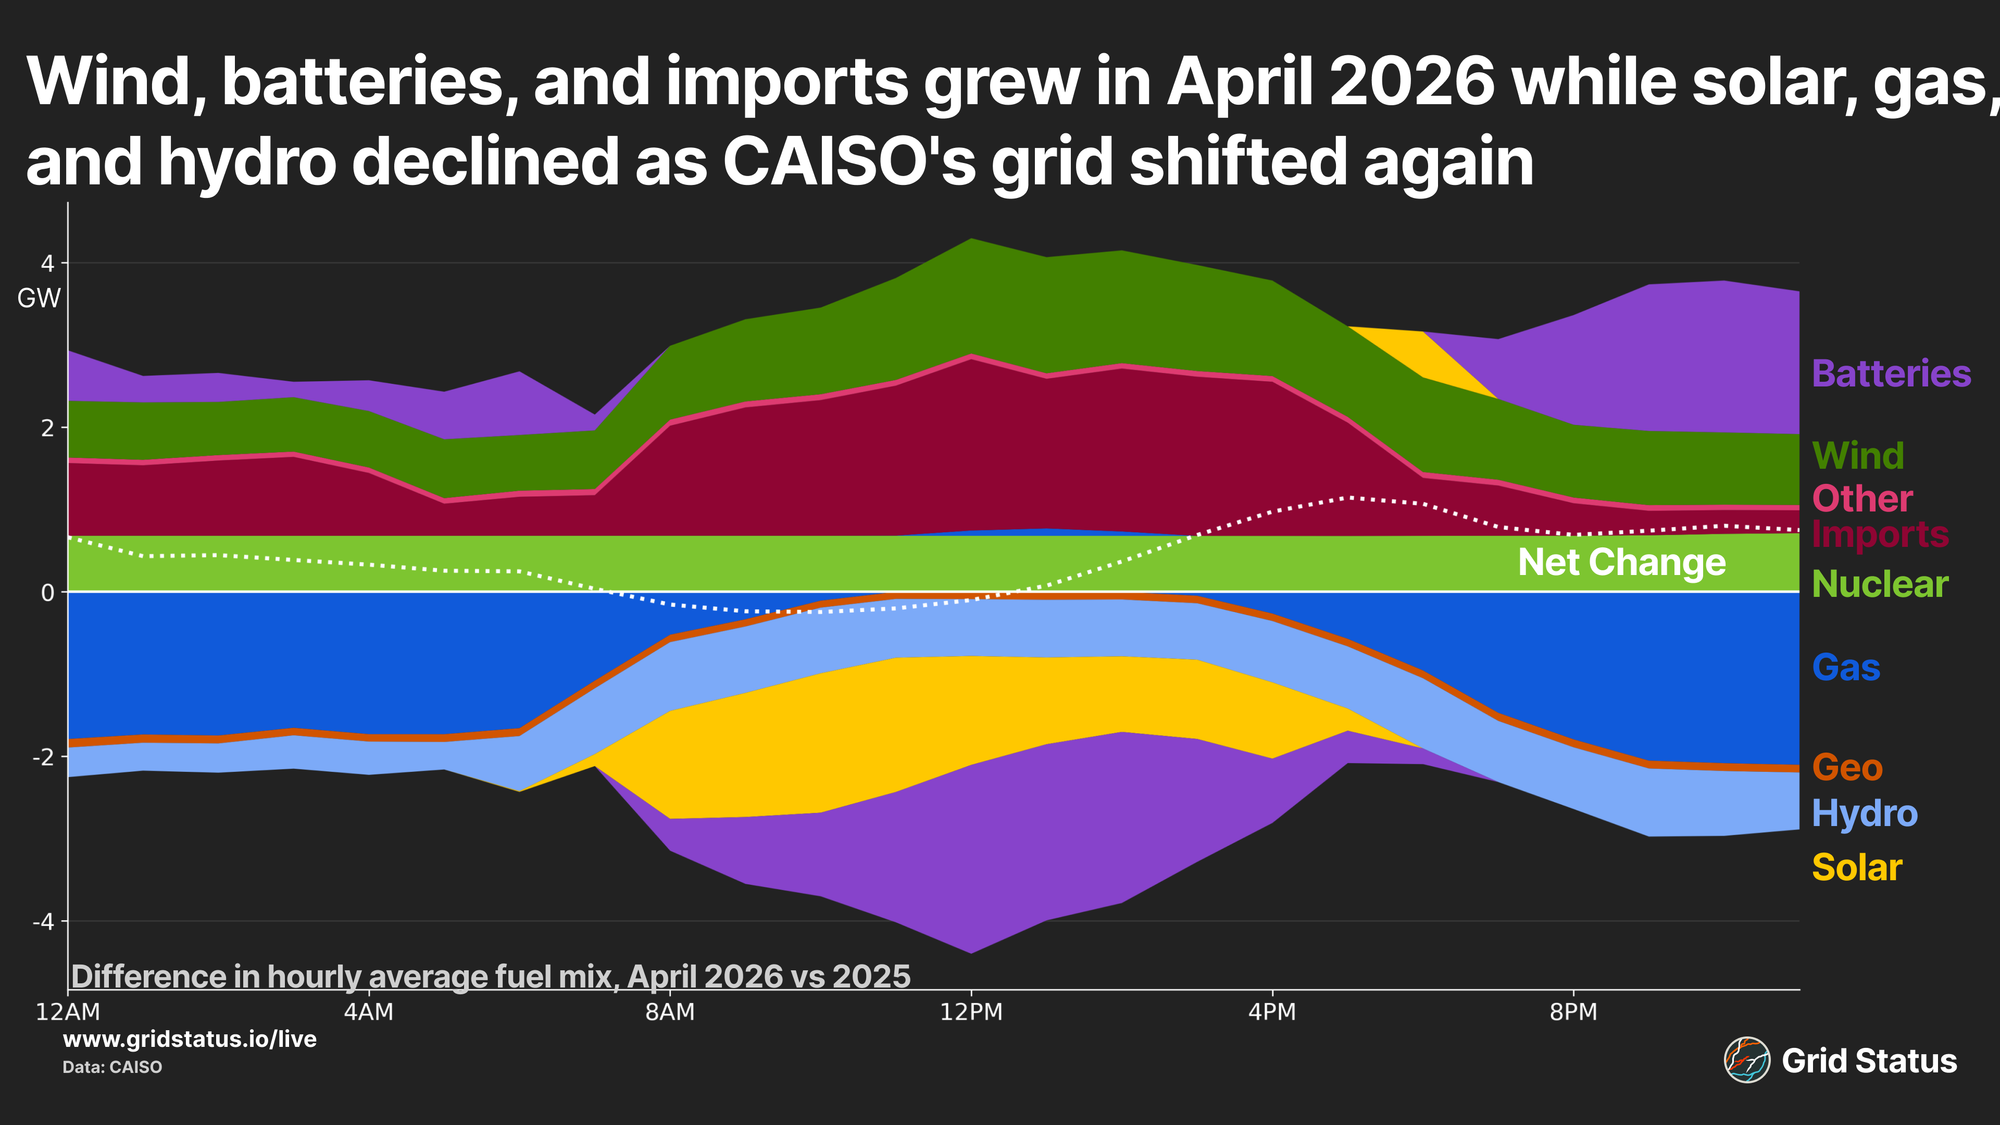
Every year has shifts in fuel mix and operations, and 2026 has been anything but subtle, with major swings on the surface signaling the complicated grid underneath. The headlines in 2026? Gas down, curtailment up, exports down, batteries more, solar down, wind up.
We’re diving into all of the above and more, so join us on this return visit to Hotel California(ISO), a market we may stray from, but which we can never leave.
- Solar - Generation and Curtailment
- Wind - Generation and Curtailment
- Batteries
- Imports and Exports
- Nuclear, Gas, and Hydro
- Geothermal
- Behind the Meter
- Wrap Up
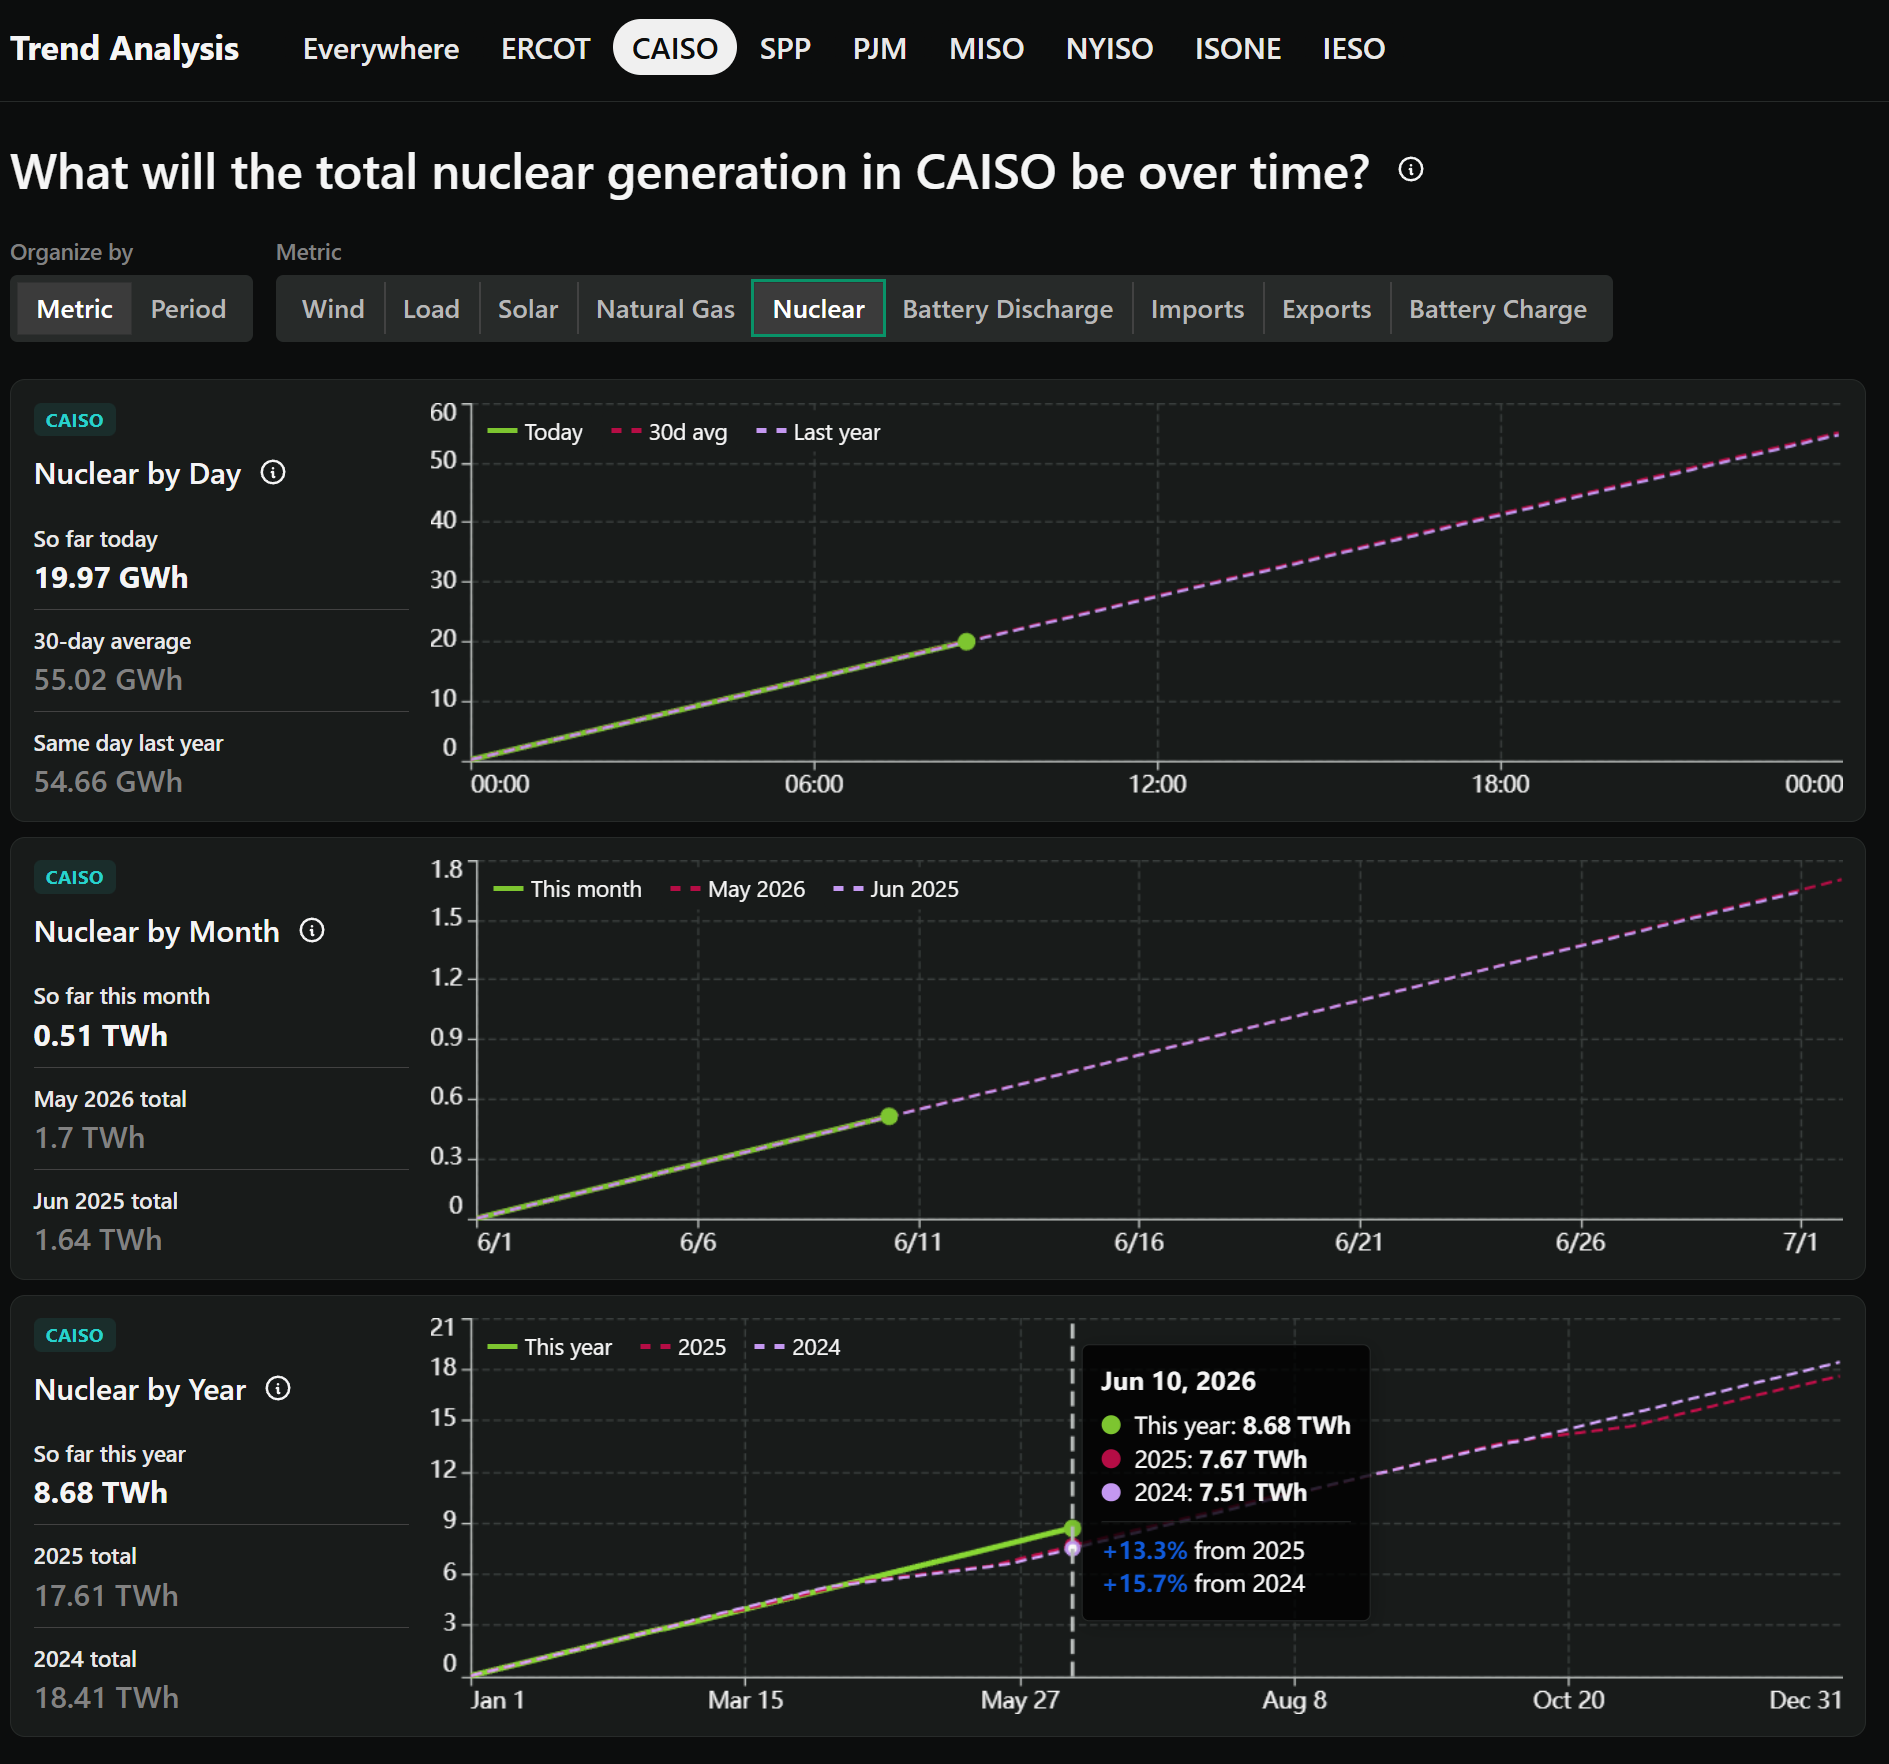
While you're on the site, try our new Trends App to understand where each grid is in terms of output and consumption, day-over-day or year-over-year.
Solar Eclipse
California and sunshine go hand-in-hand, and power generation has been no different over the past decade as installed solar capacity exploded across the state. Installed capacity of utility-scale solar has continued to grow across the Golden State, but this April was the first in years to see average grid-scale solar generation drop year over year.
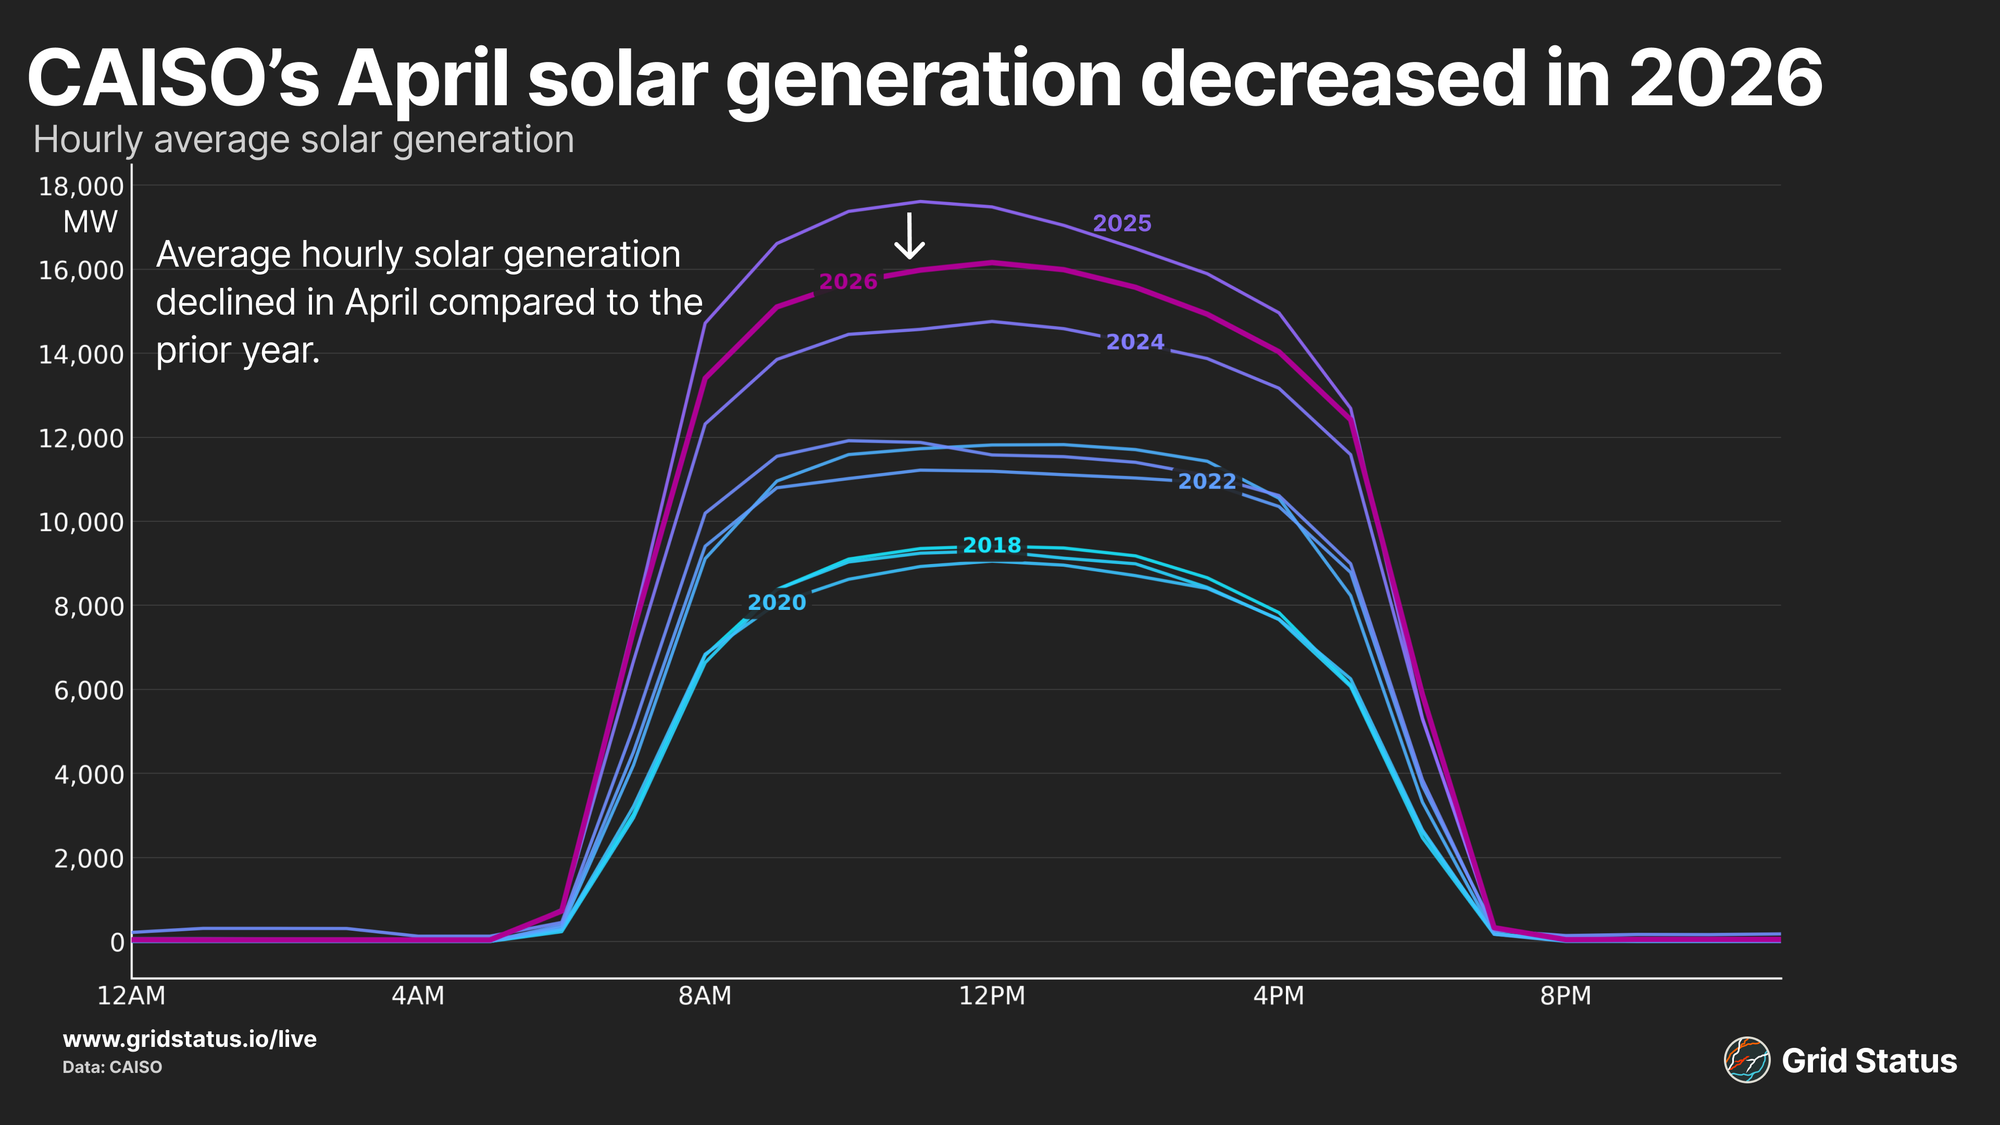
Compared to the prior year, solar generation at noon dropped an average of 1,772 MW. As CAISO continues to interconnect new renewable projects, such as new solar resources, these additions continue to run into existing grid bottlenecks, particularly during peak solar hours.
Solar has continued to be built out in the Central Valley and the desert South, but this generation is located away from major load centers along the coast. These bottlenecks manifest as congestion, which can generate locational marginal prices (LMPs) too negative for the Product Tax Credit (PTC) to overcome. When that happens, the most common outcome is curtailment. Curtailment can occur for a variety of reasons, but most commonly, renewable units purposely reduce output in response to negative prices.
Despite the continued increases in nameplate capacity, curtailment grew so much that solar generation actually declined year-over-year.
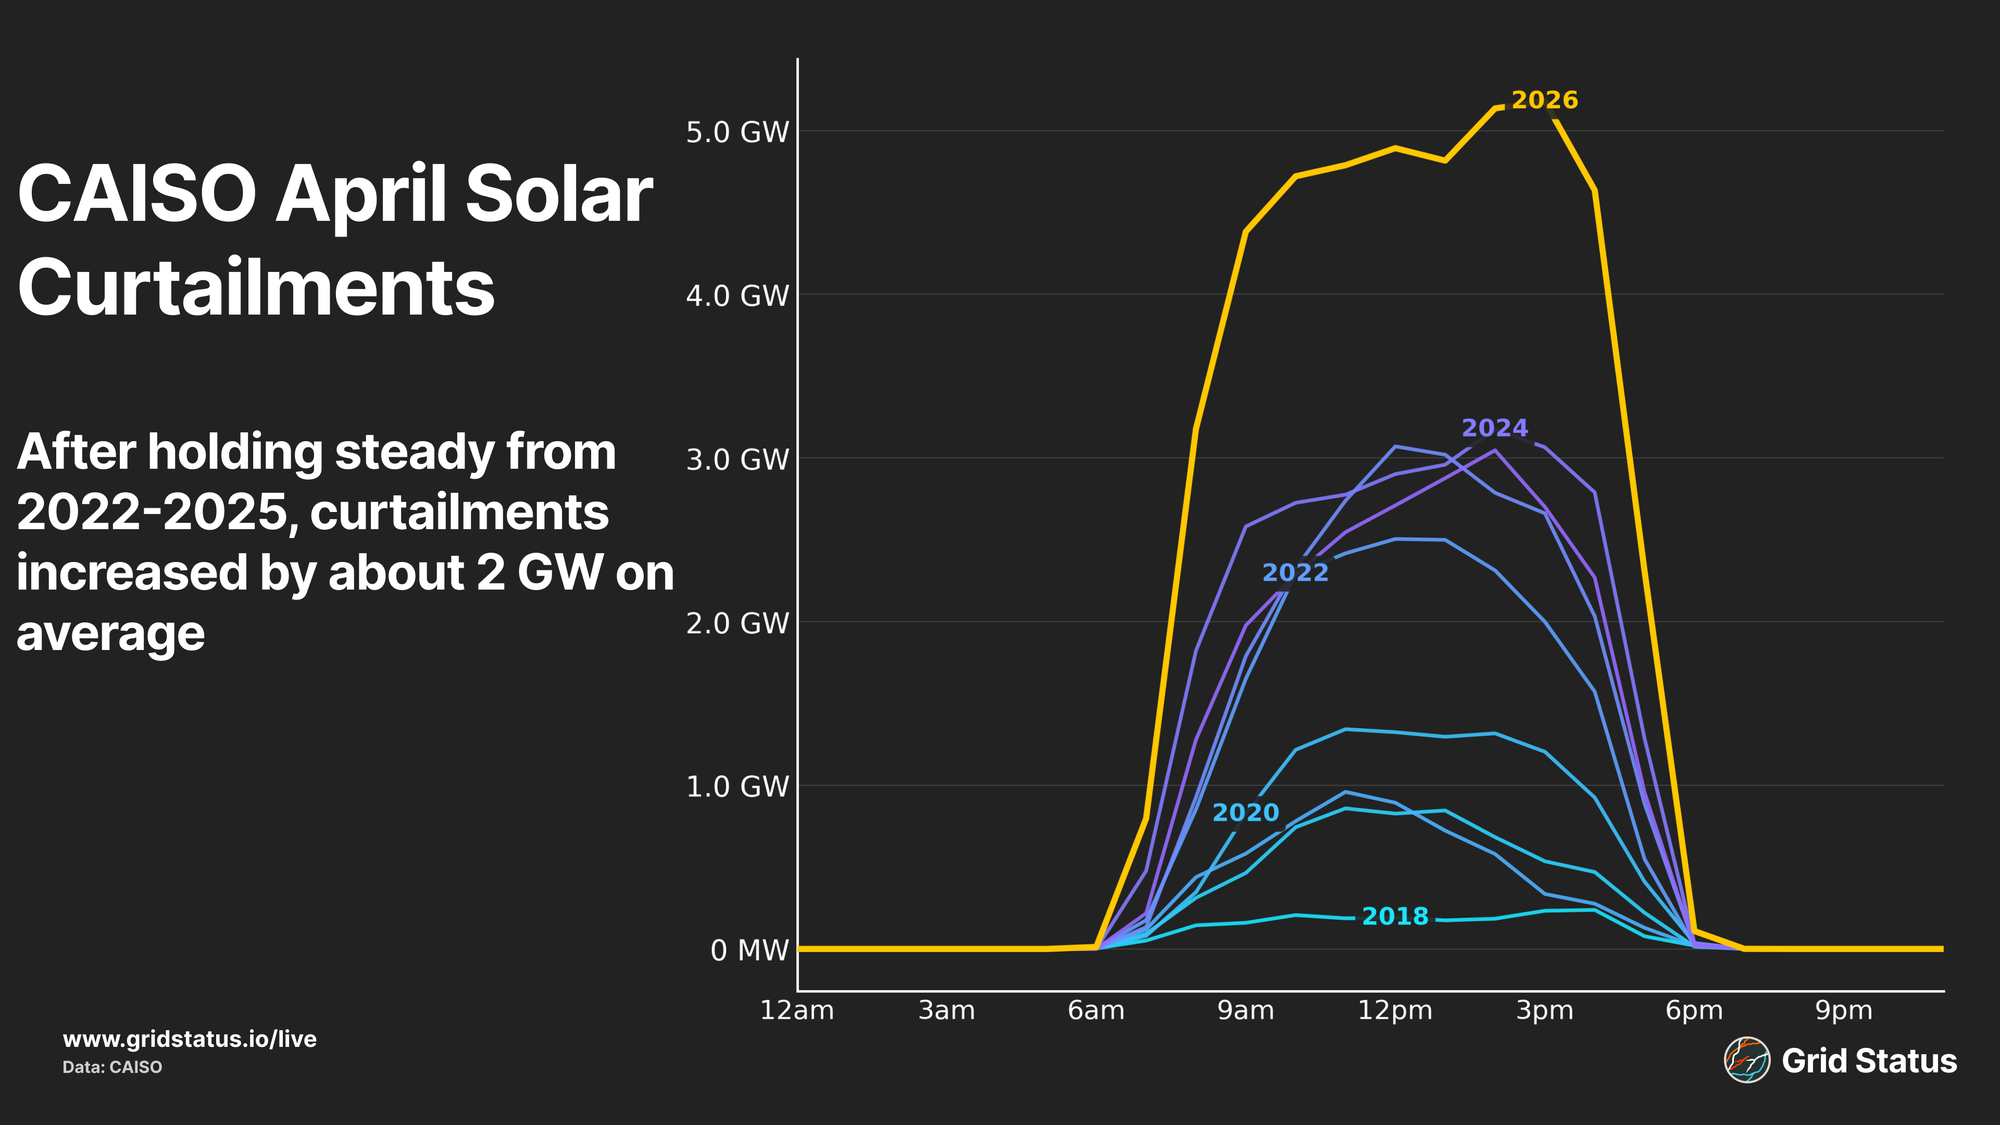
From 2022 through 2025, April solar curtailments remained in a similar band. No year dominated across all hours, and particularly over the last 3 years, it appeared that curtailment may have slowed down or even stabilized, driven by the growth in mid-day battery charging and exports from CAISO into the wider West. 2026 shattered this assumption as curtailment jumped by nearly 2 GW over the mid-day solar peak.
We can run a small counterfactual on the solar output: what if we add curtailment back into the actual generation?
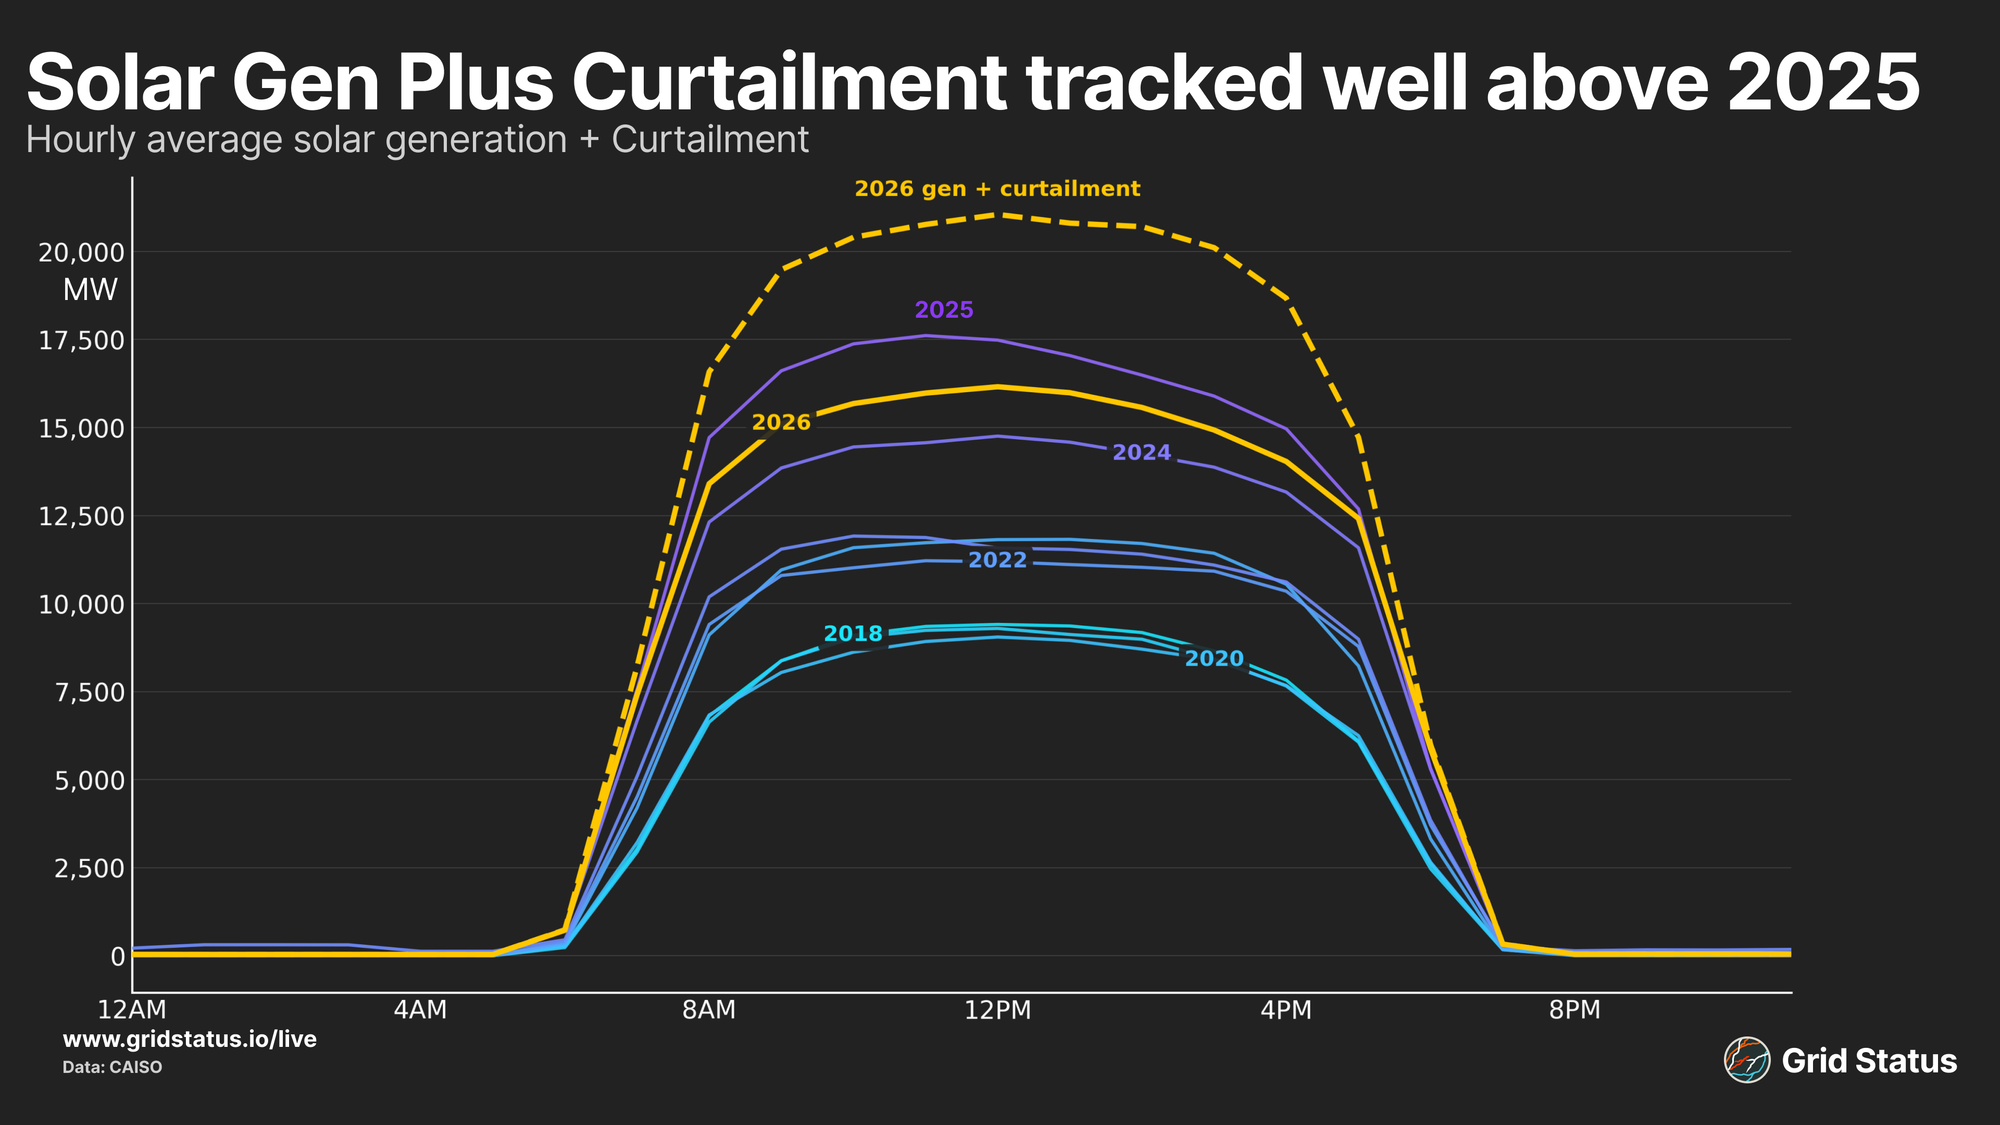
Upon folding in curtailment, average hourly solar generation would have pushed well over 20 GW through the late morning and into the middle of the afternoon, well above both the prior year and this year’s actuals. This also exceeds the same metric of generation+curtailment for 2025.
While April solar curtailment had slowed, increases over the years are not a new story on the CAISO grid, as it has grown steadily over most of the last decade.
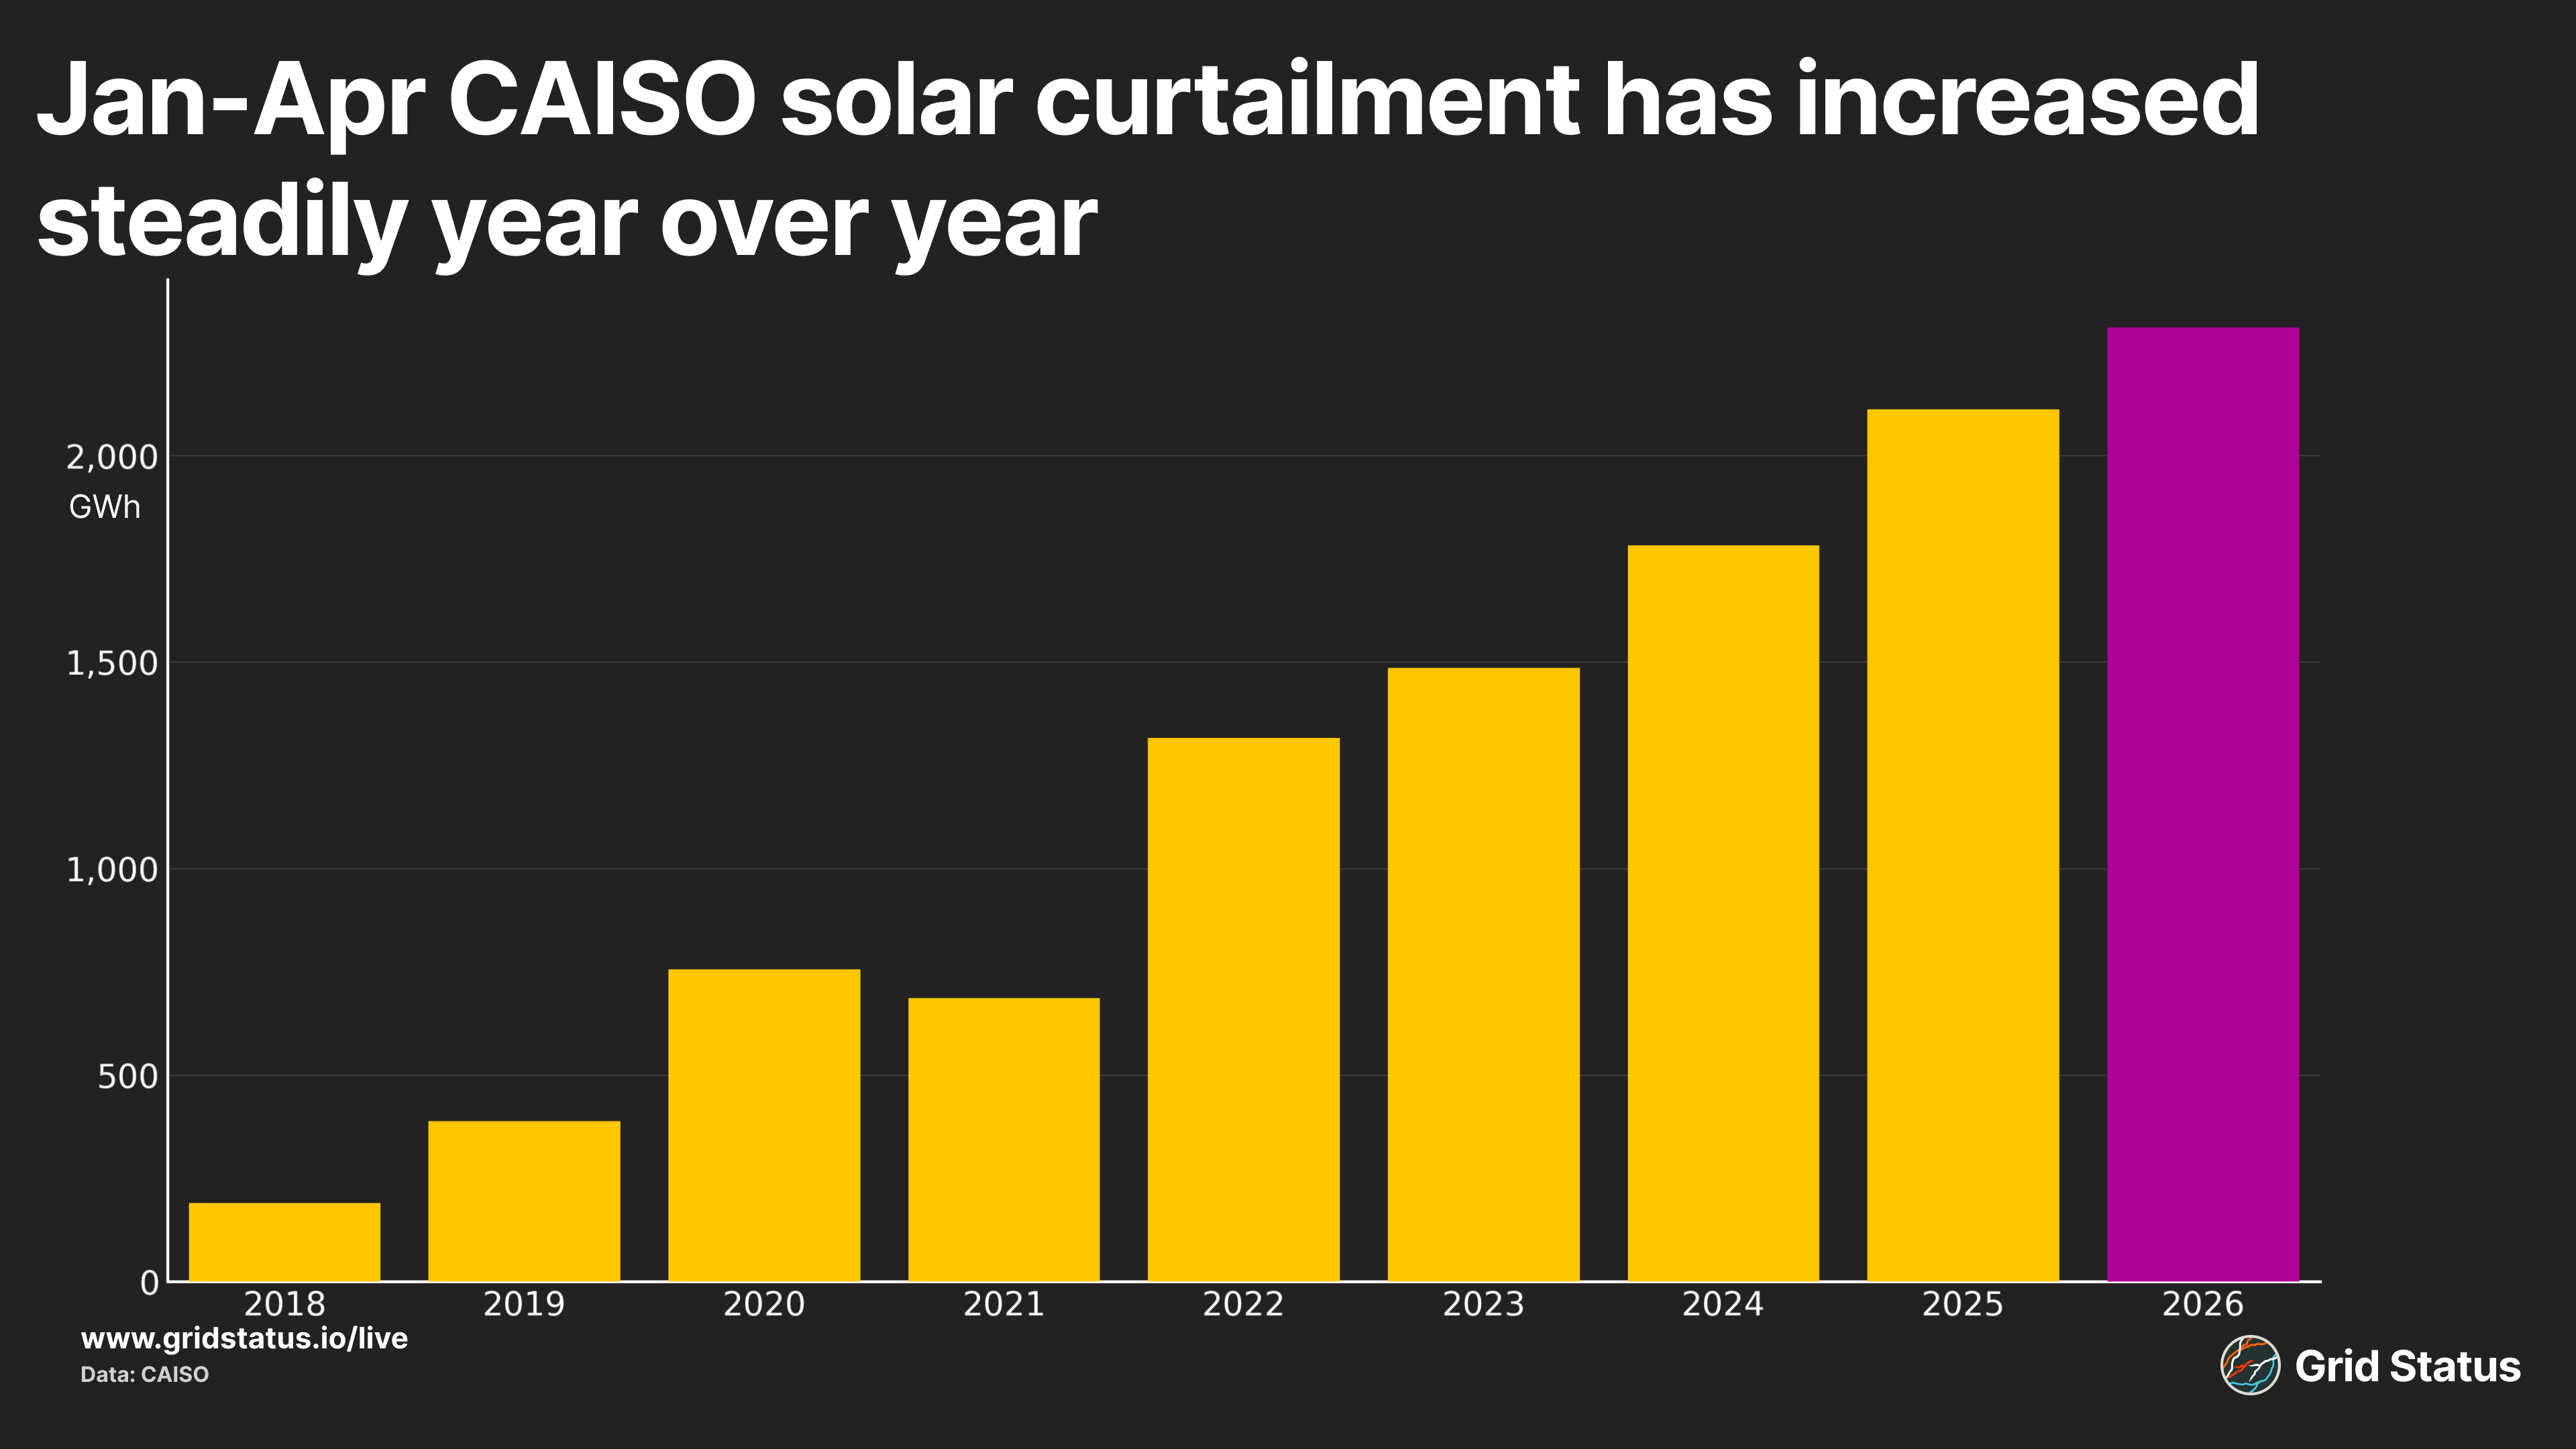
In the context of the first four months of the year, April’s outcomes still fit the steady trend observed since 2022.
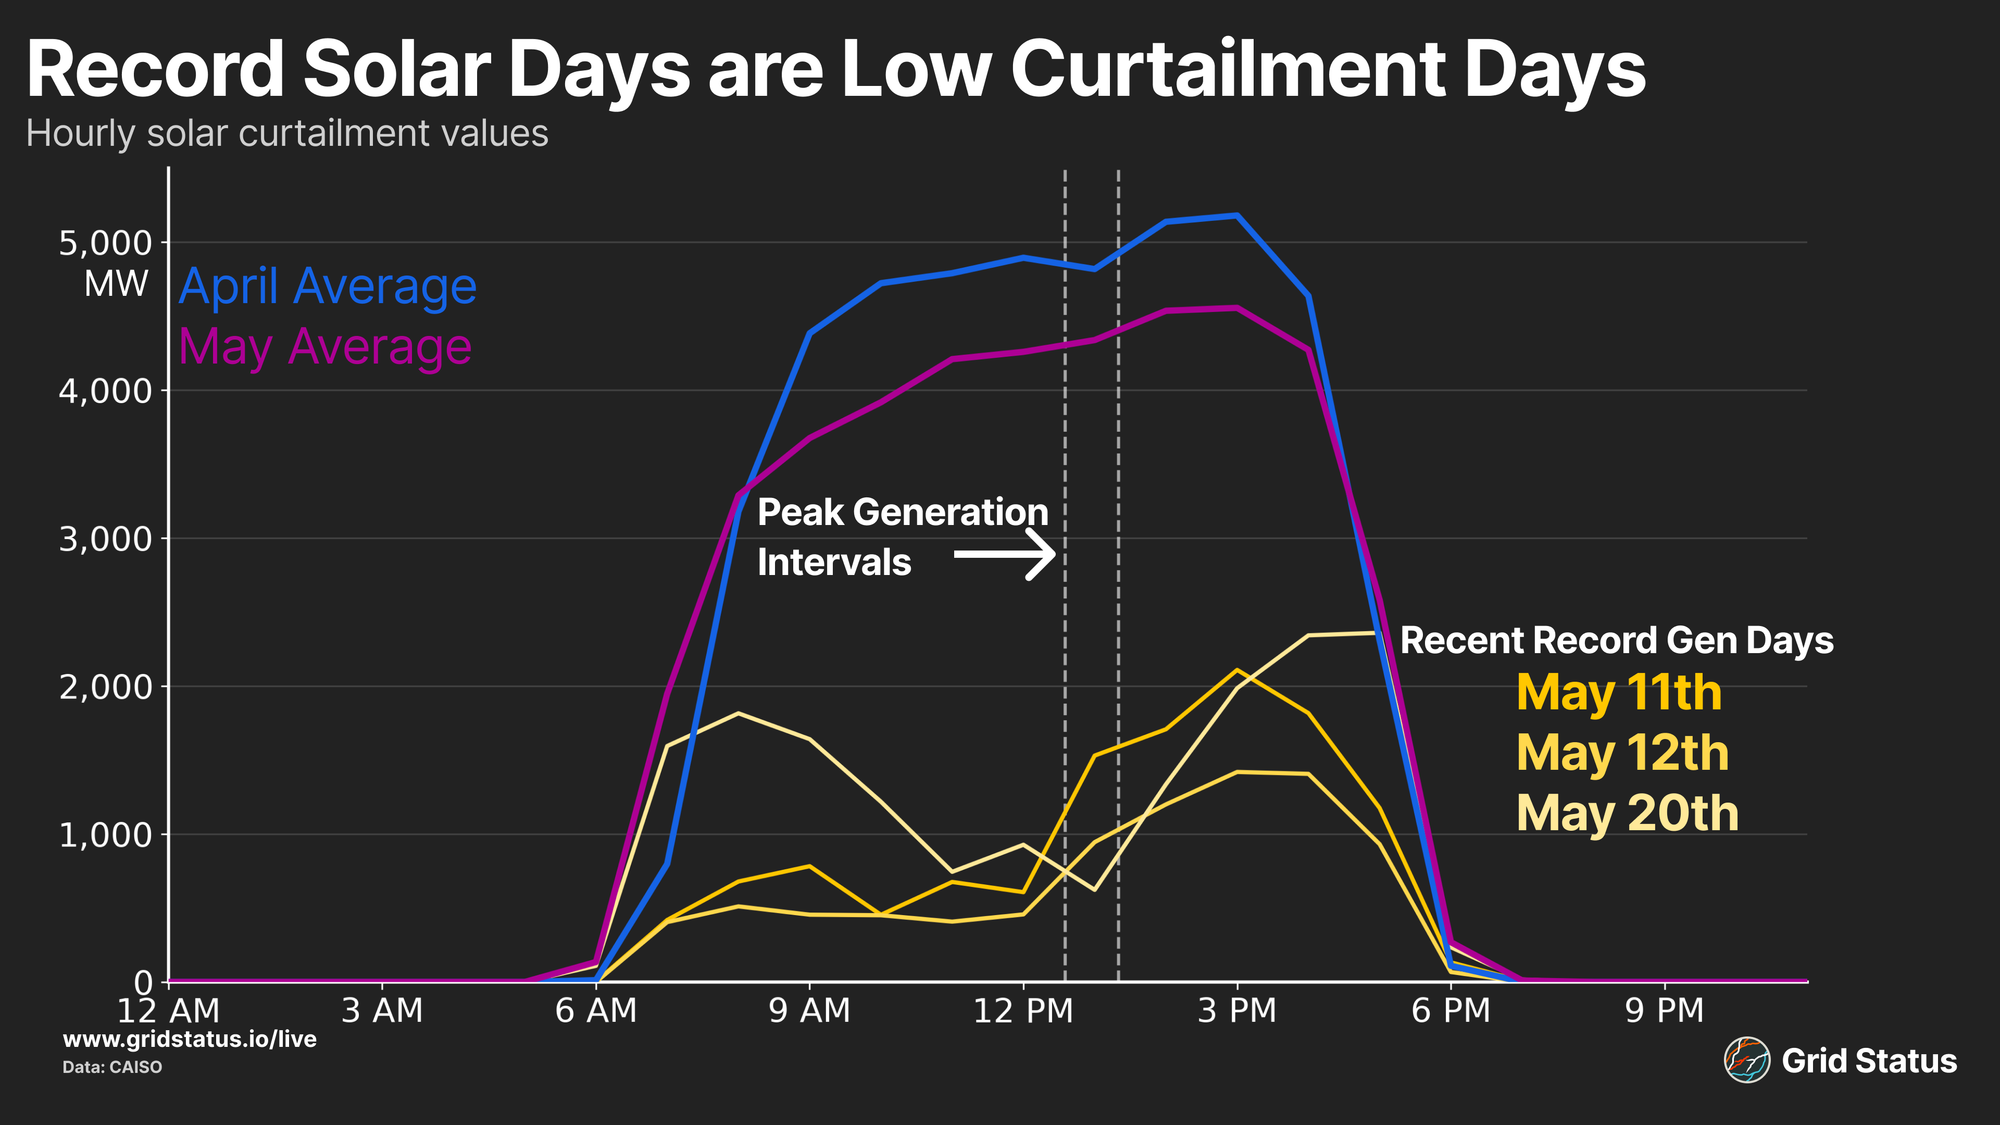
When curtailment doesn’t occur, CAISO sets records. Simple as that. The market exists in a state where the gate on peak solar output isn’t more capacity (although it can help), but the level at which curtailment is occurring. This is particularly evident when comparing recent record days and their temporal neighbors that didn’t set a new peak themselves.
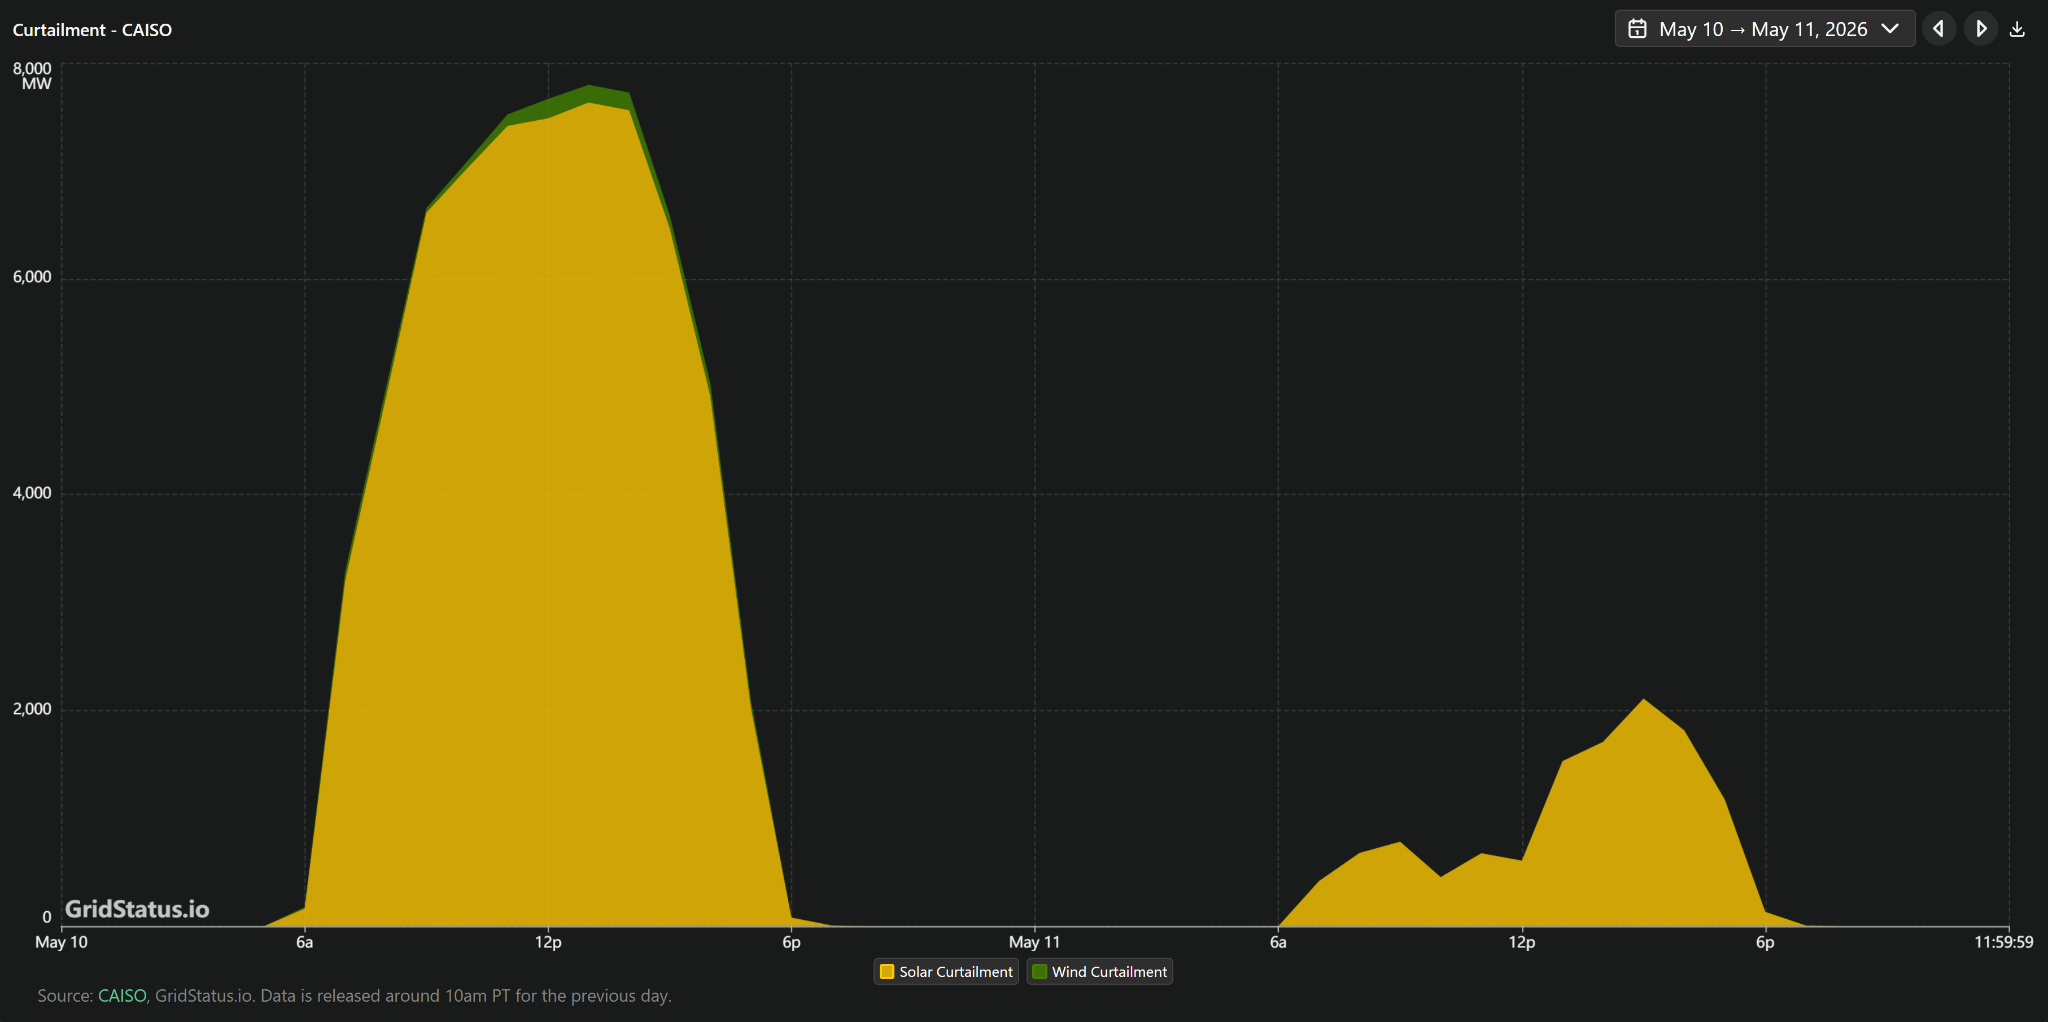
We can also compare back-to-back days, May 10th and 11th. The 11th set a (now beaten) solar record, while the 10th was far off.
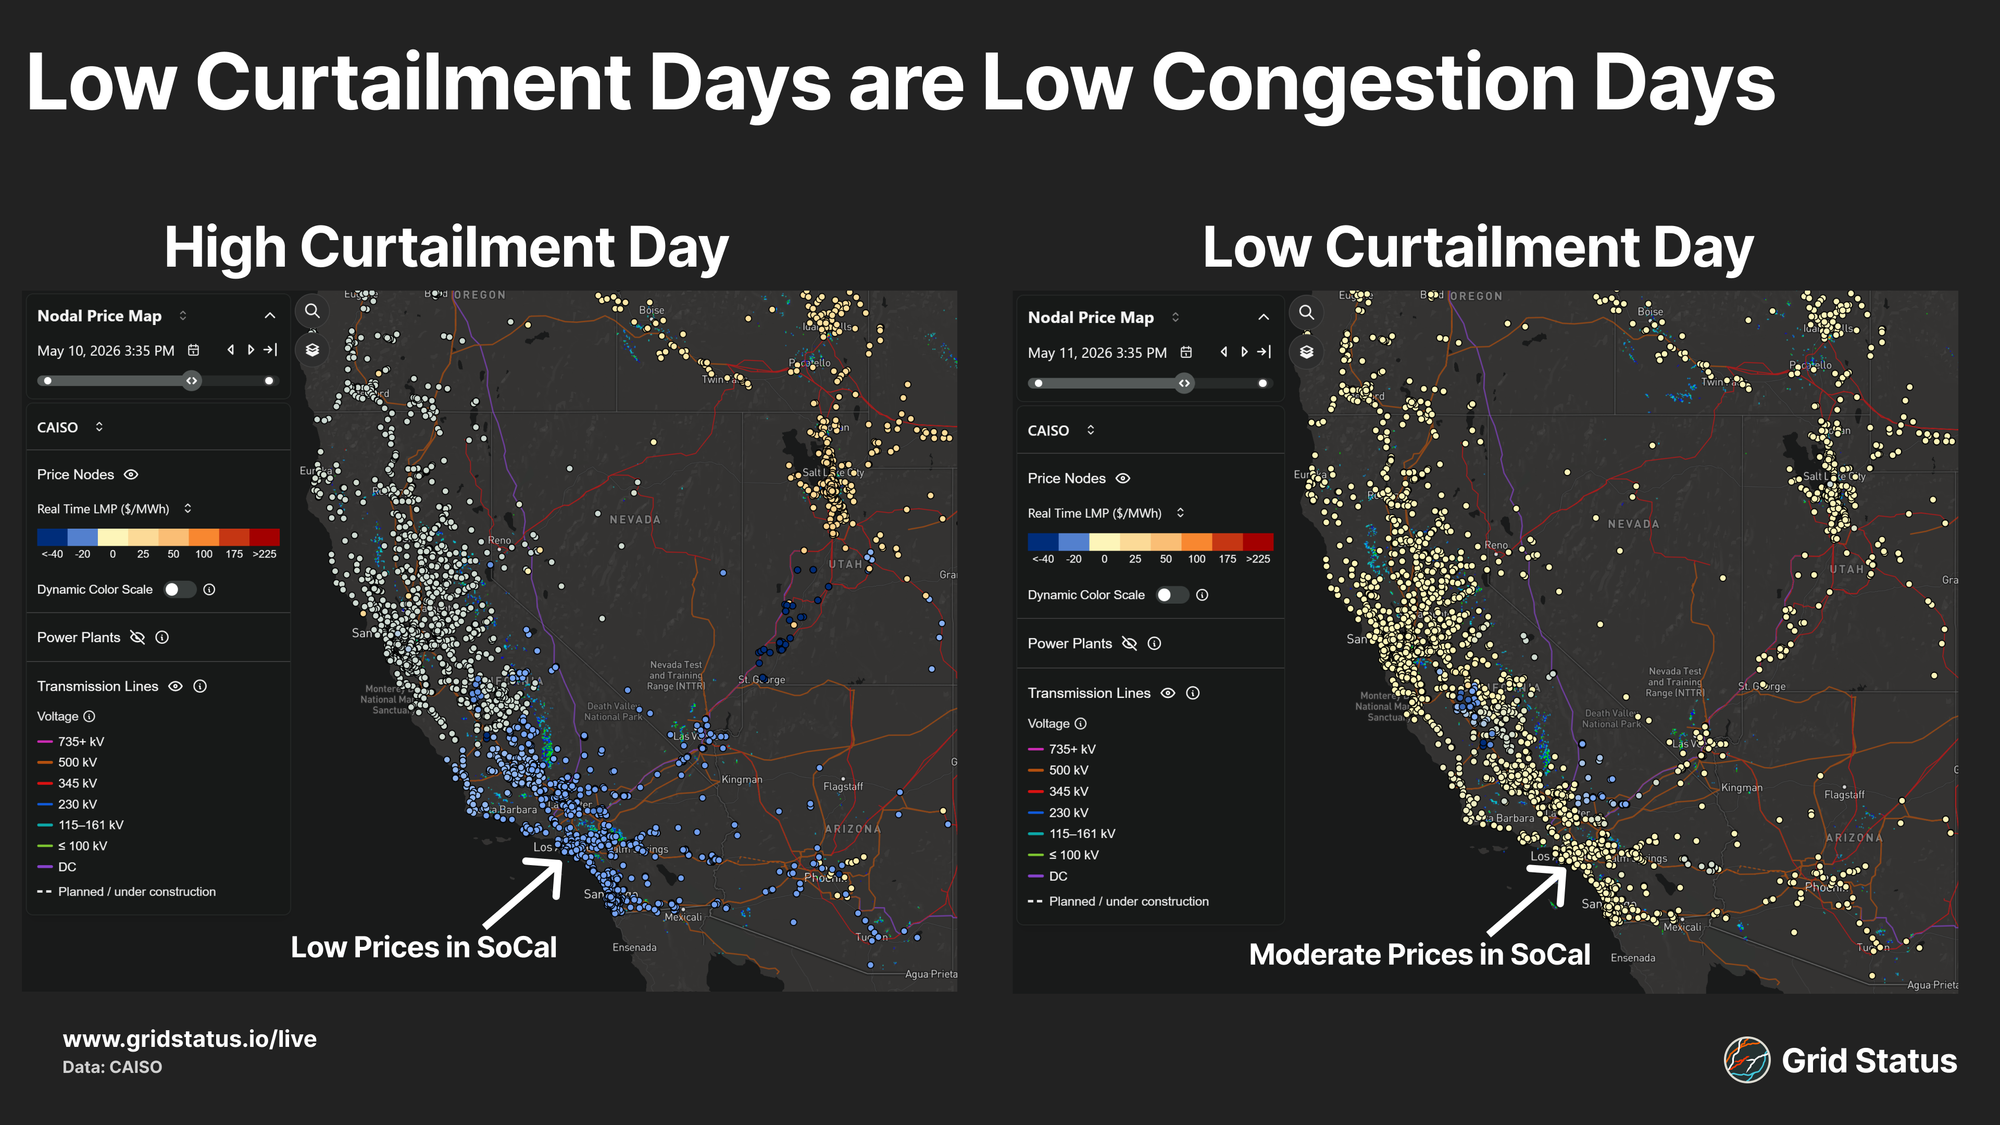
Regional congestion at 12:35 on both days paints a clear curtailment picture.
It’s not clear that there is a single specific driver for the elevated solar curtailments this year. Low exports and new solar capacity in neighboring balancing authorities, wind generation picking up throughout the day, a Diablo Canyon Unit back online, transmission outages, all of these can contribute to the genesis of the negative price conditions that drive solar curtailment down through the Central Valley and throughout Southern California.
Listen to the Wind Blow
While solar faltered, wind was ripping, setting new records for the first time in 4 years. Initially breached in March, the record jumped again in April and continued to rise through mid-May. Peak wind began April near 6.7 GW, exited at nearly 7.2, and topped out at nearly 8.3 GW on May 15th.
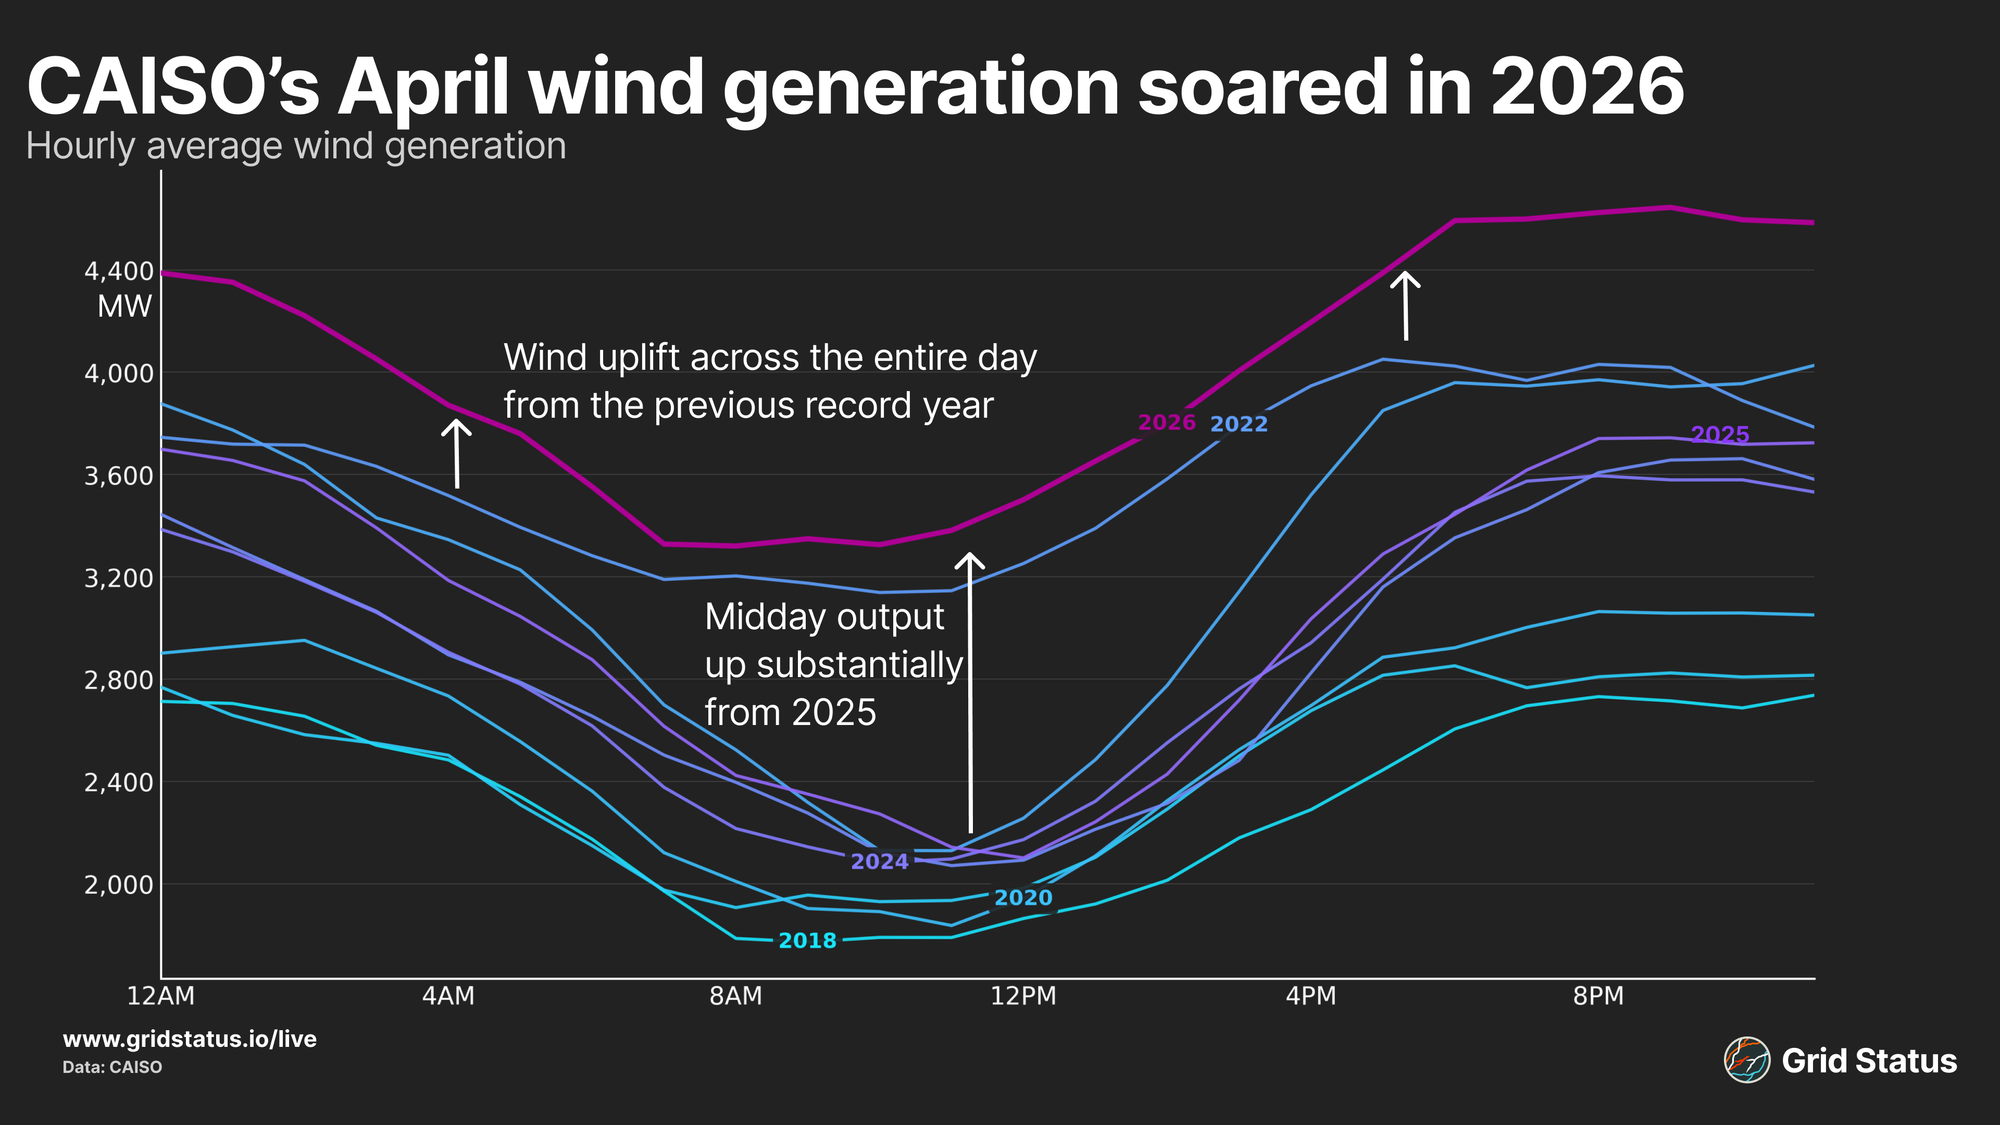
The average wind output across April was not just a record, but exceeded every previous year in every hour of the day, something that no previous milestone year had managed to achieve.
While no official announcement has been made by the ISO, SunZia commissioning appeared to be the cause based on transmission line operational control and the ISO’s own 2026 summer resource plan.
The large jumps in CAISO’s wind record, compared to the steady increase in other generation, such as solar, point to a single large project coming online in stages, which exhibits a different pattern than the gradual piecemeal accumulation of smaller-scale assets. This mirrors a trend we have observed in other regions, like New England, that have seen similar record trends defined by a large project coming online in stages.
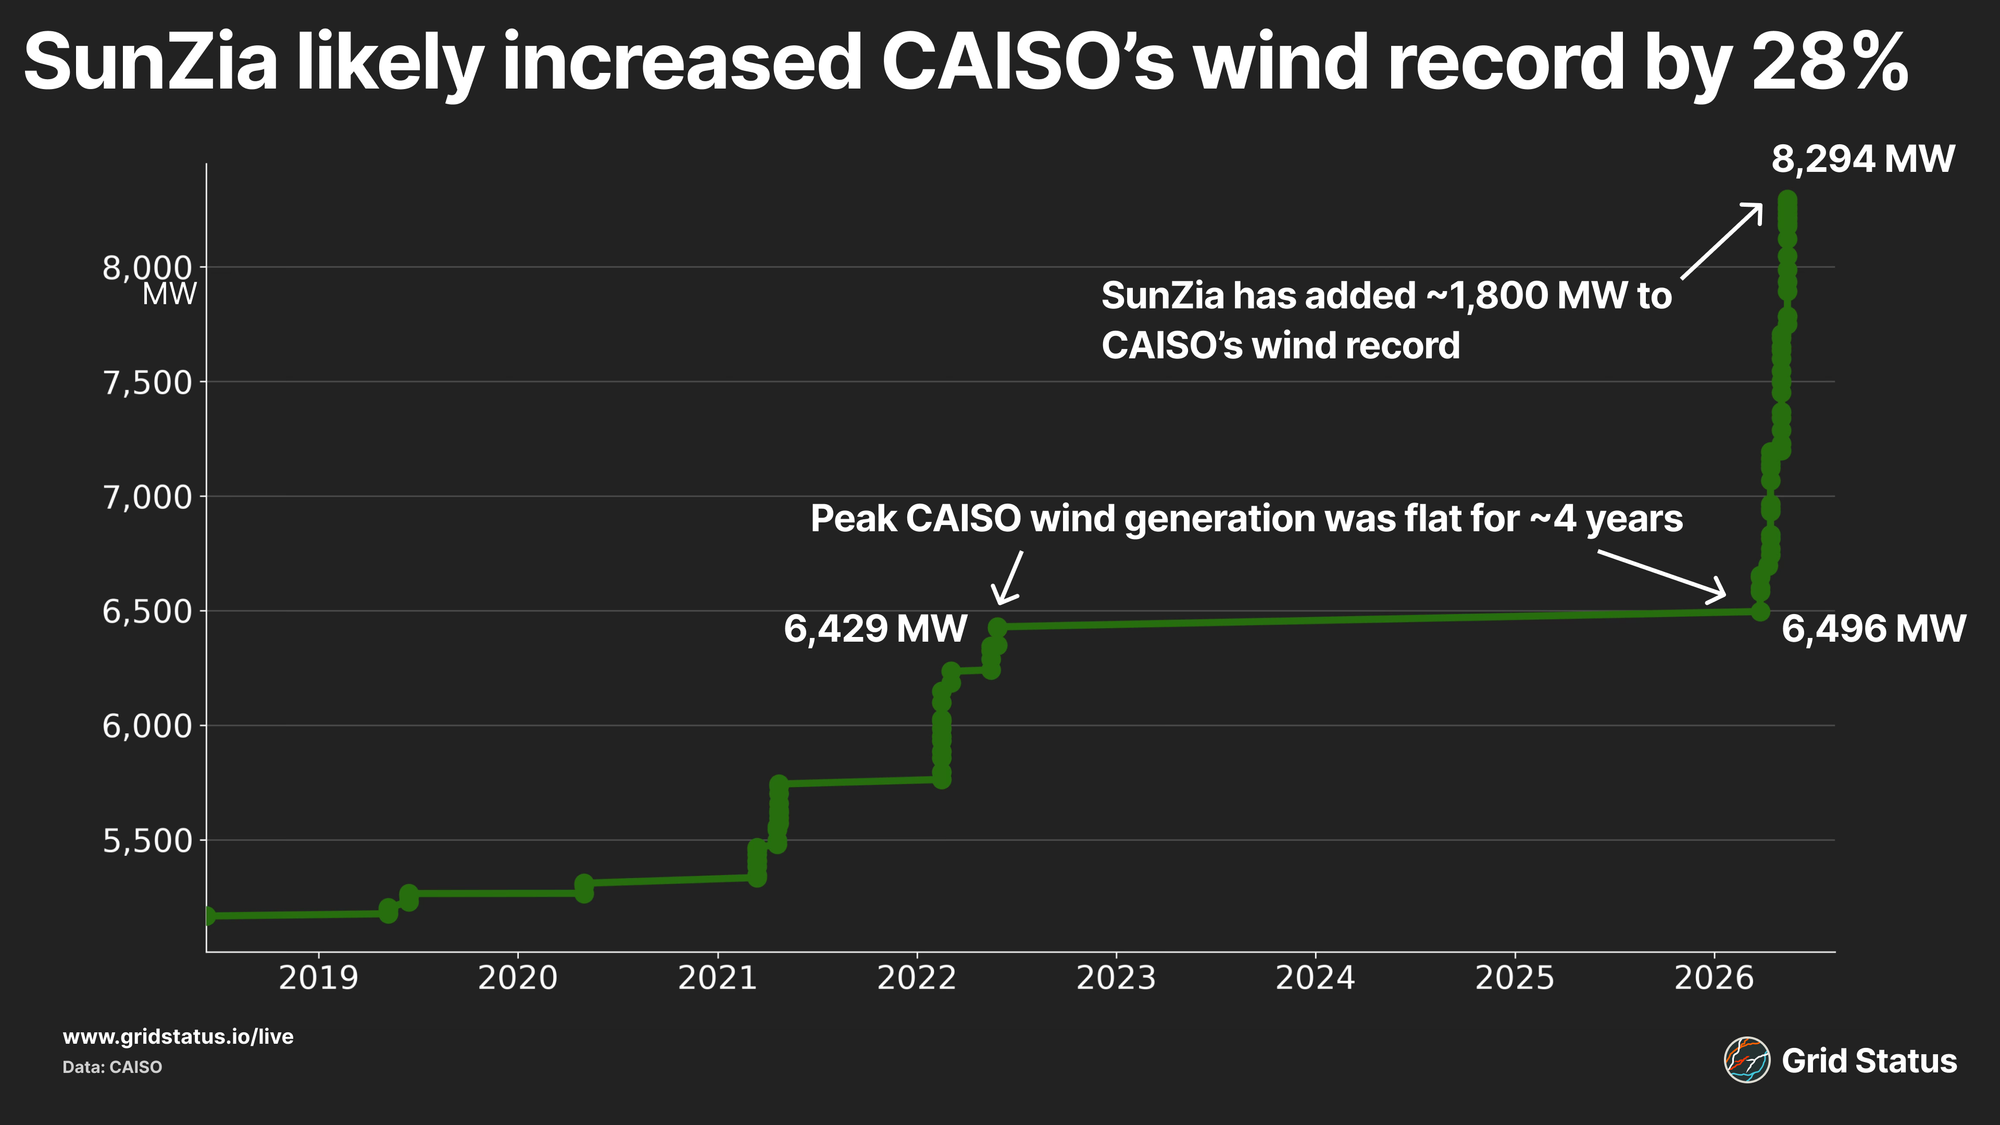
Sunzia will be the largest renewable energy project in North America, ultimately slated to have 3.5 GW of installed wind capacity. The project has been 20 years in the making, requiring a lengthy timeline in order to secure permitting for the 552-mile transmission line to flow wind generation from central New Mexico to southern Arizona, where further flows are managed over CAISO's Palo Verde transmission rights. 3.1 GW of this project is allocated for California, while the remaining 400 MW is for SRP (which already exports significant flows into the CAISO grid).
CAISO currently only has 2,131 MW of transmission rights to flow through Arizona on the Palo Verde intertie, but plans on 3,100 MW of total wind generation from SunZia, limiting potential flows.
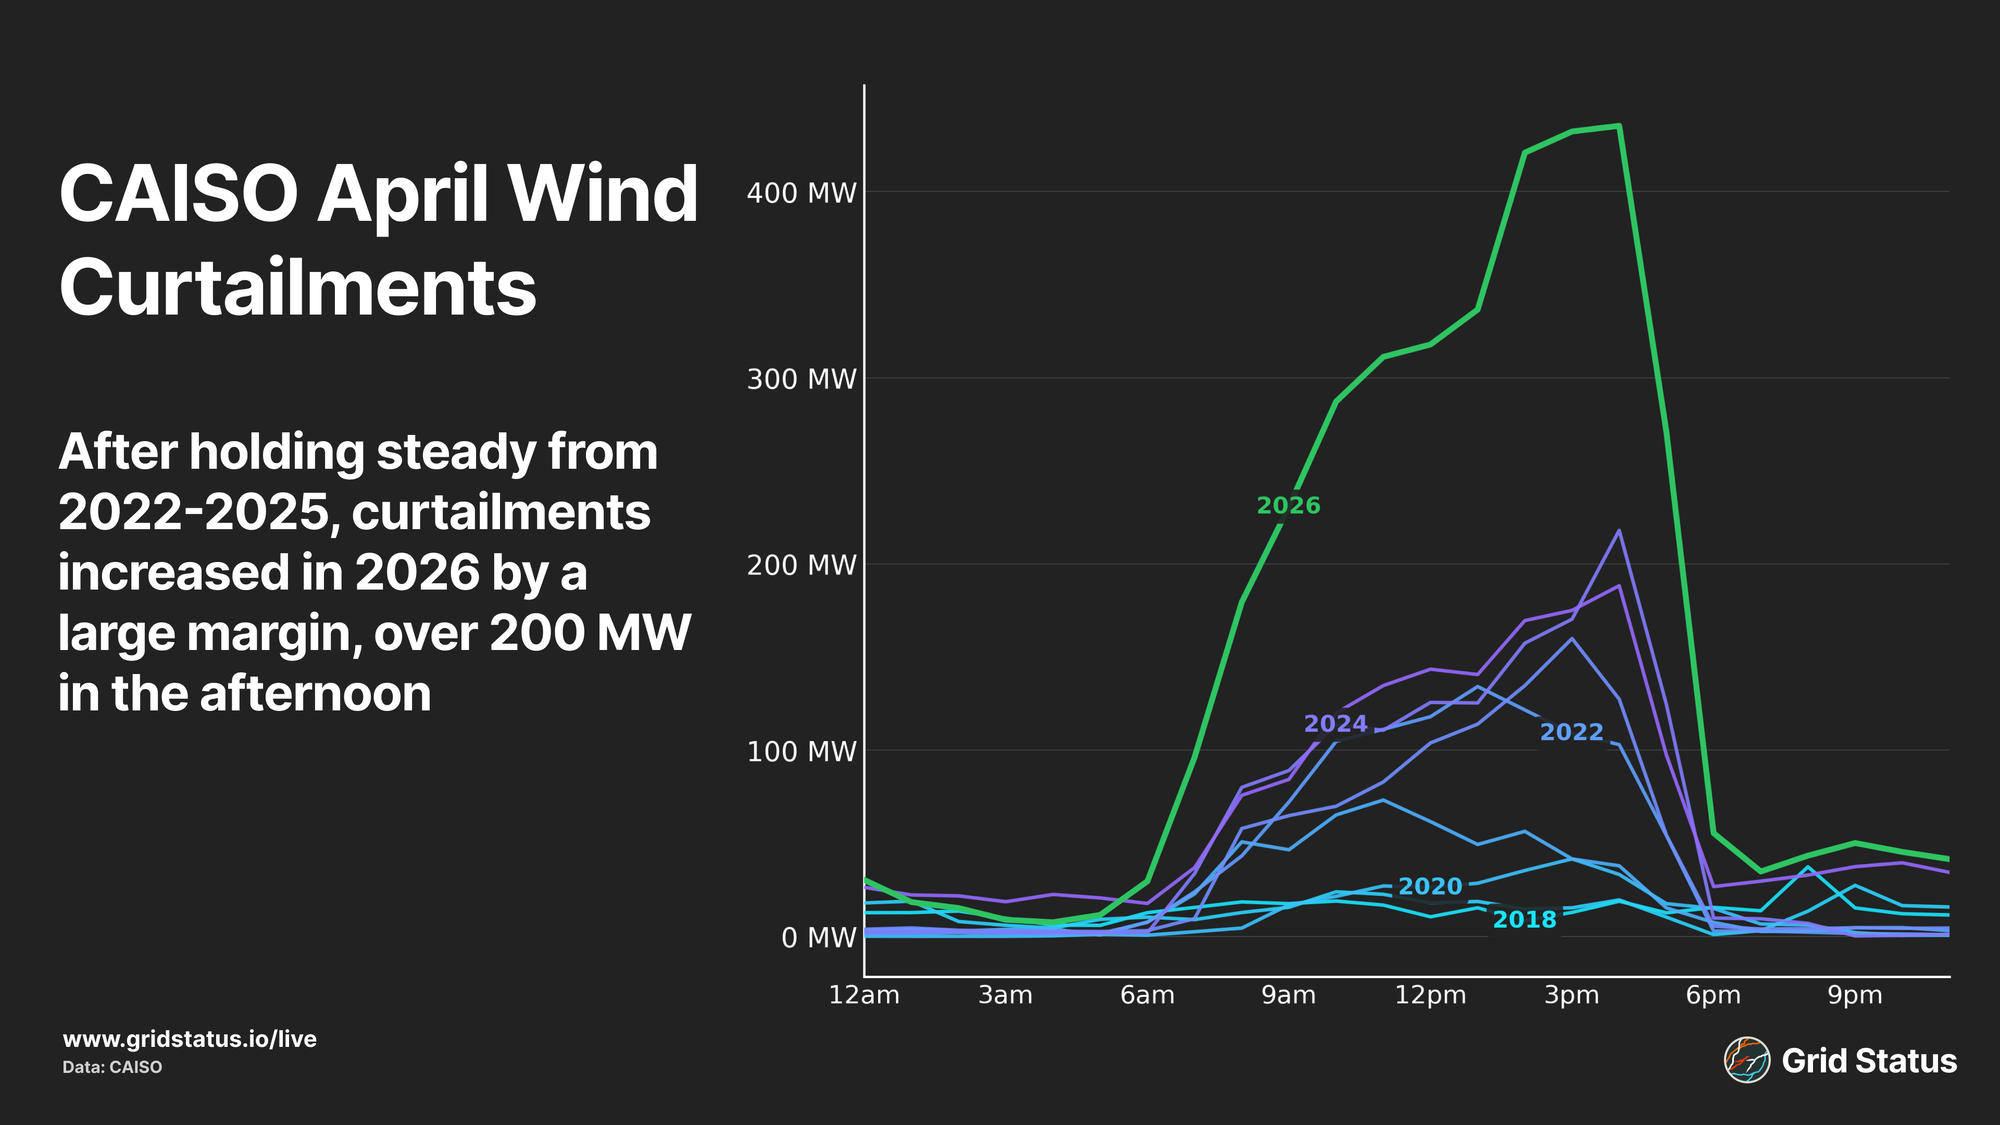
As with solar, wind curtailments jumped. We can clearly see the tension between resources as curtailments peak in the afternoon, exactly when both utility and BTM solar generation are strongest and when net load levels are at their lowest.
Also in line with solar, the first 4 months of the year represented another steady step up in total curtailment for wind.
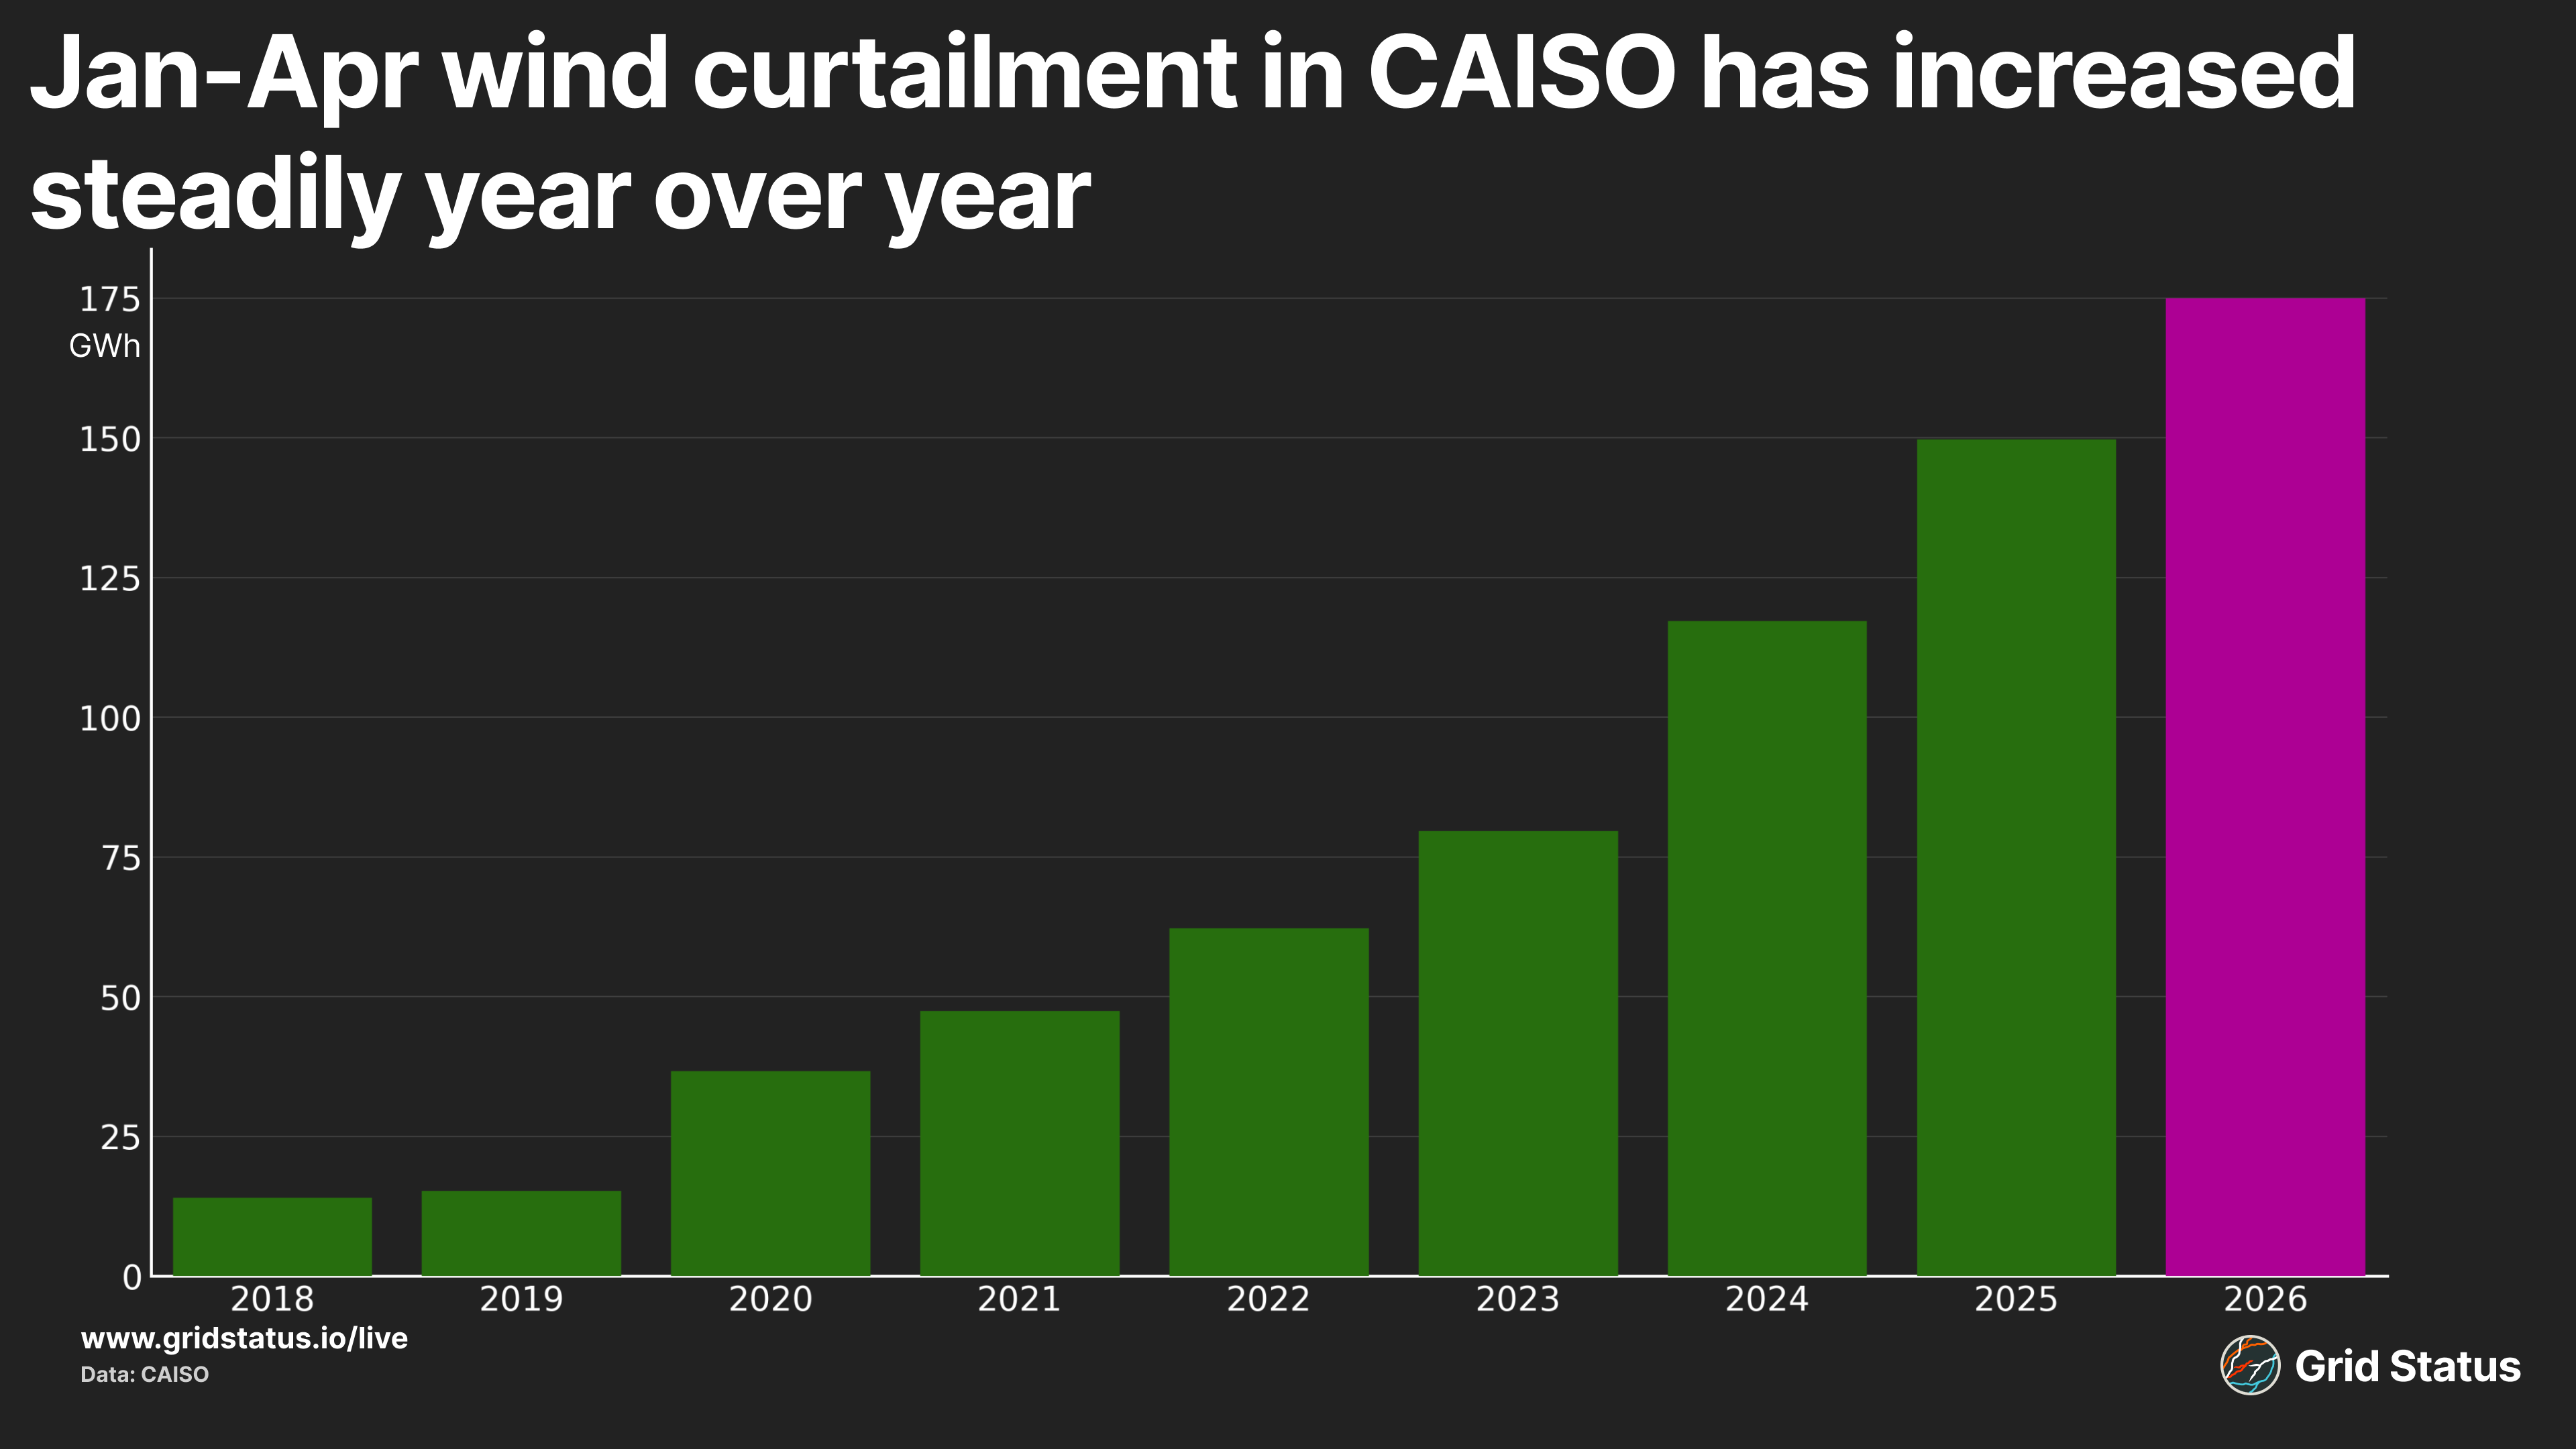
Despite the big increase in April generation, YTD curtailment actually increased less than the previous two years. Tracking whether this holds in the next shoulder season will be key, as higher demand summer months should attenuate total congestion for now.
Unlike solar or wind, battery activity has increased in every recent year and continued this trend into 2026.
Working 9 to 5 (AM)
Dolly Parton may have been speaking to typical office hours, but CAISO’s battery fleet has gone straight into third shift.
The Golden State’s battery fleet has continued to charge forward, literally and figuratively, this spring. Battery storage, both output and charging, increased year over year. Unsurprisingly, battery charging peaks around noon, when energy prices crater as a combination of utility-scale solar, as well as weak load due to behind-the-meter (BTM) installations, drives weak, often negative, energy prices.
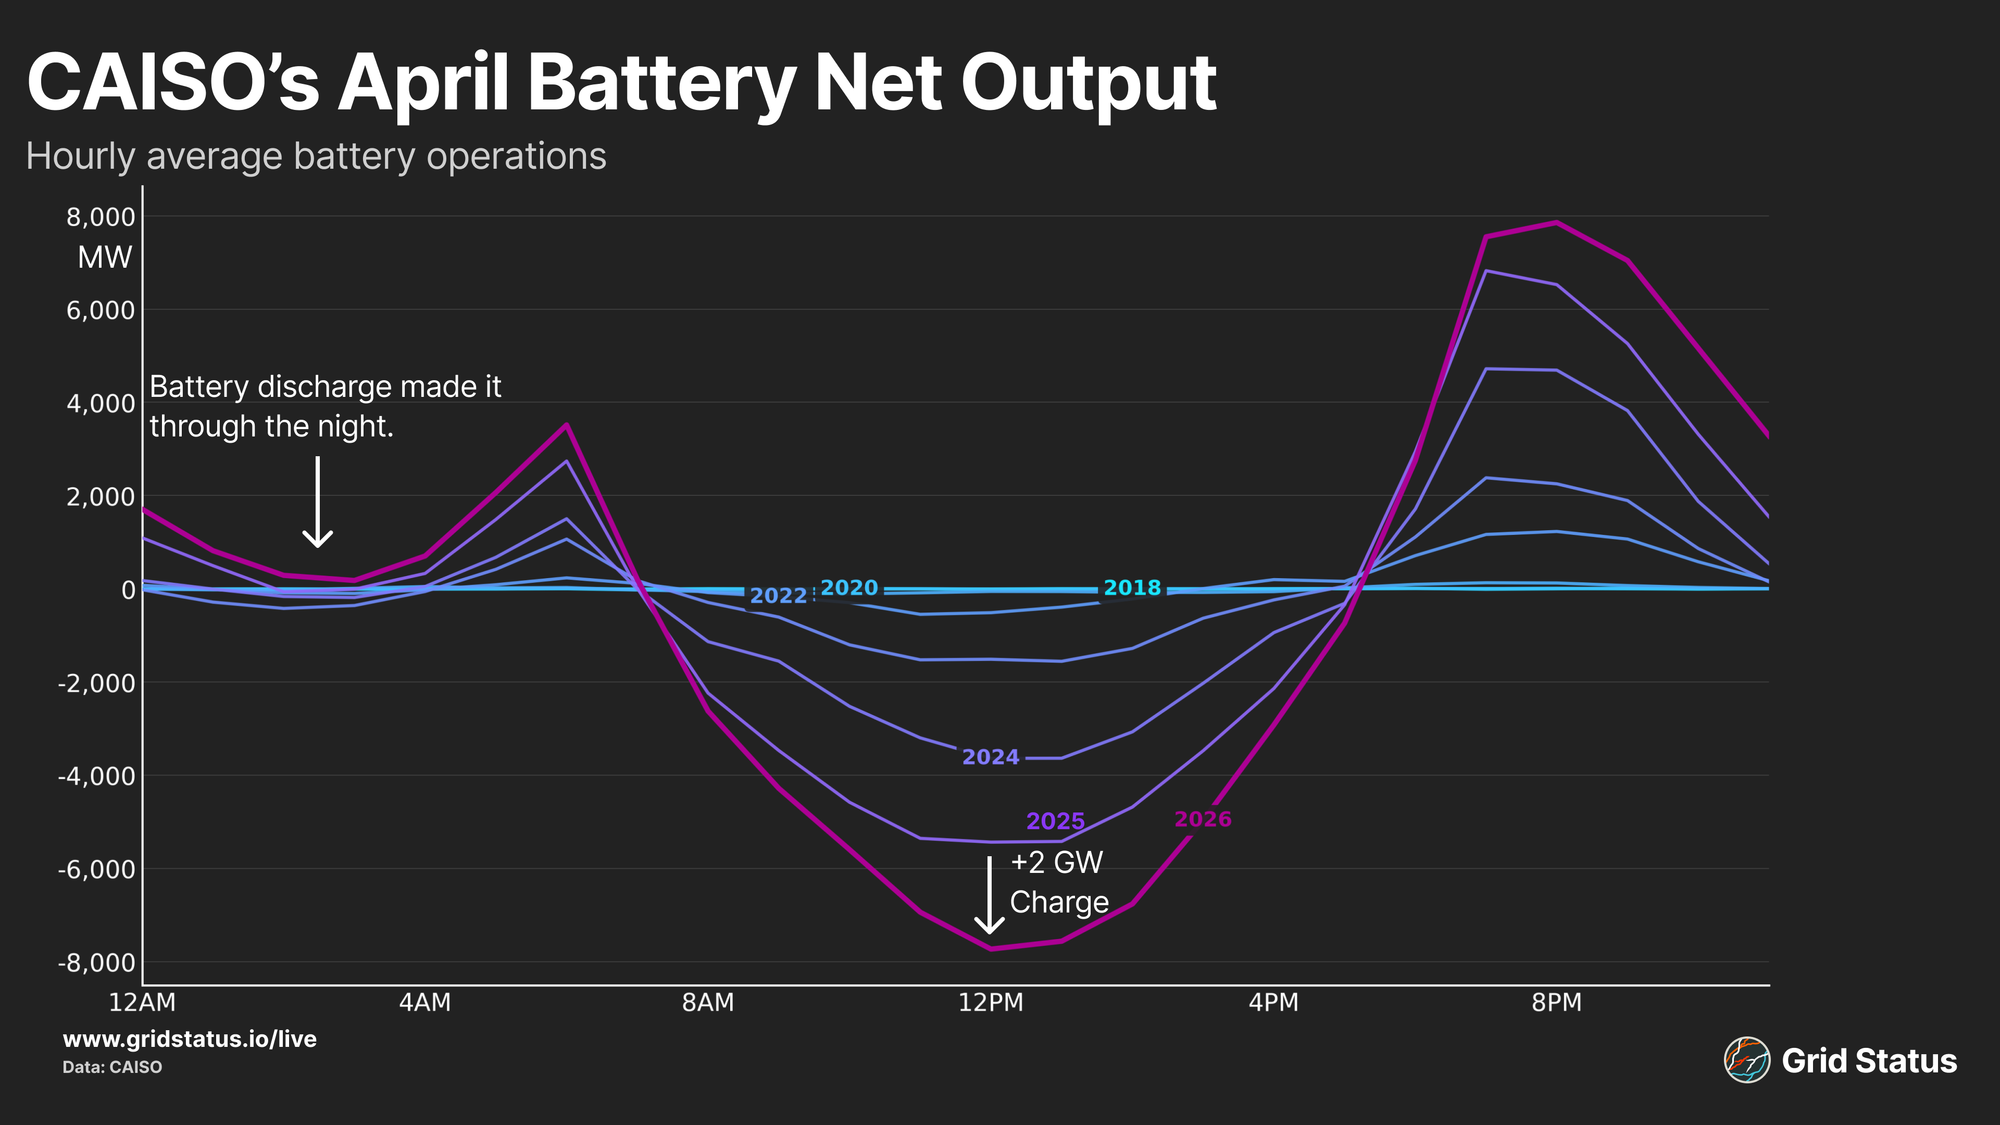
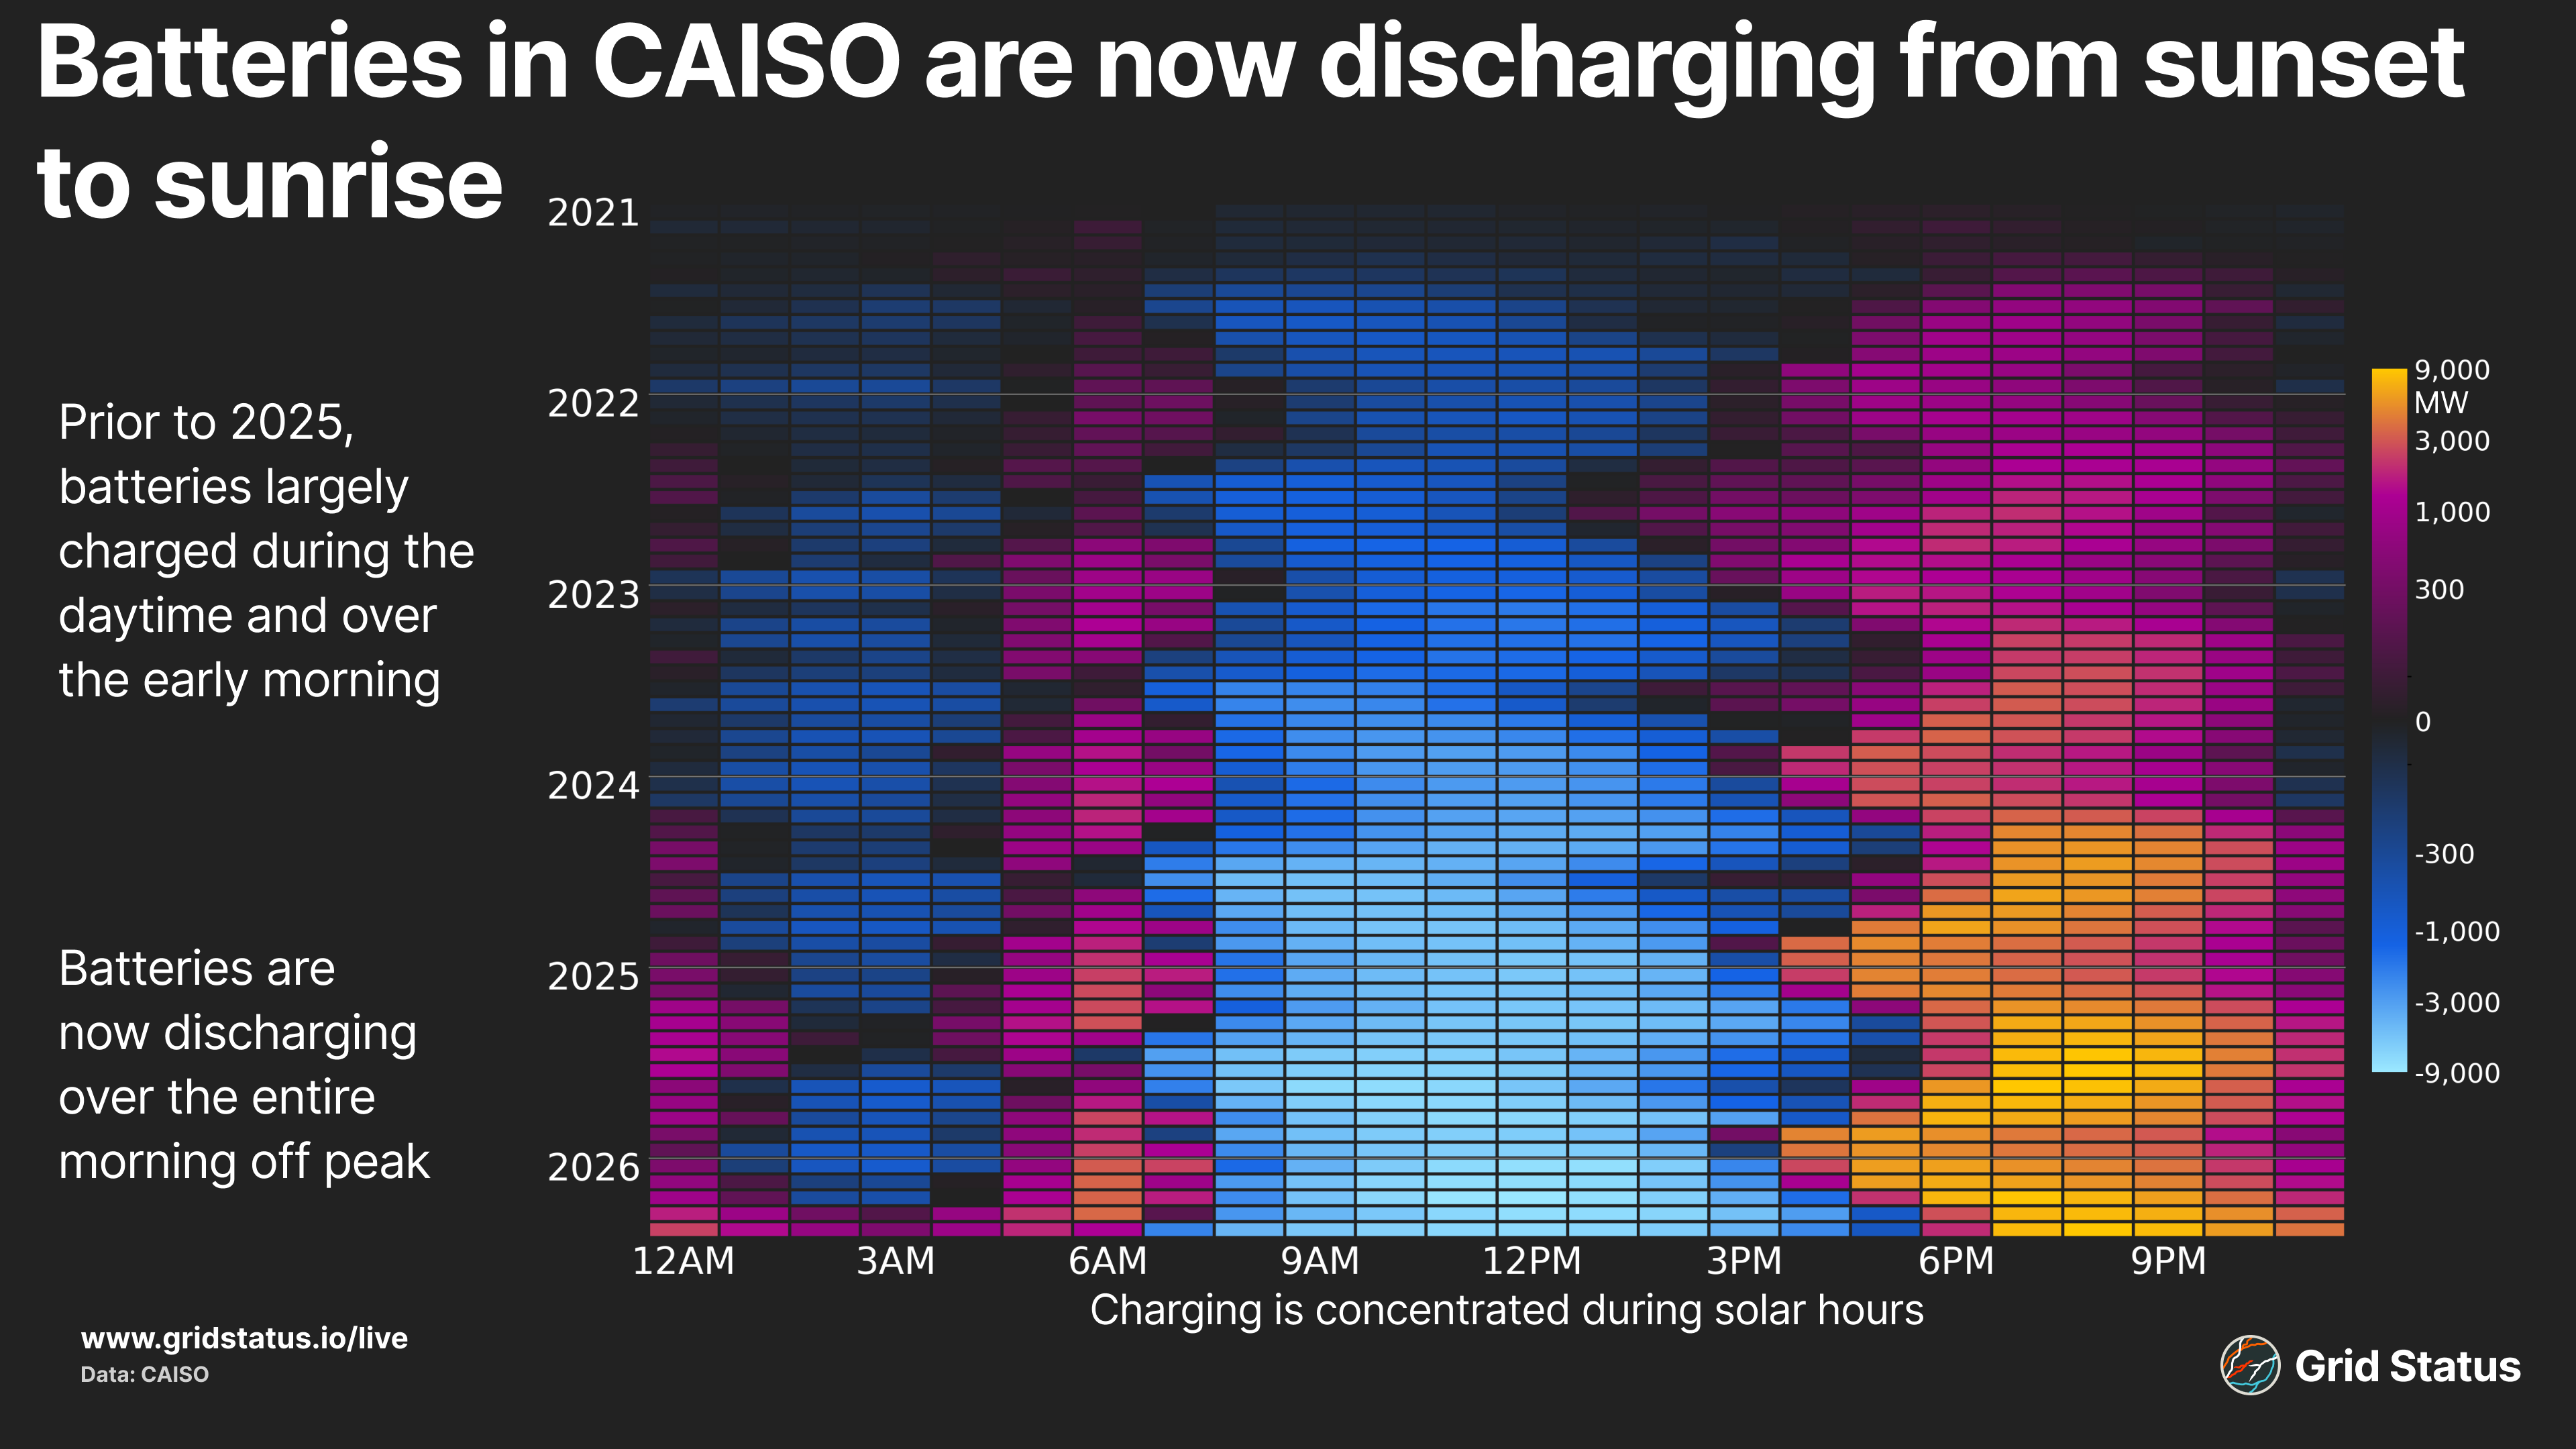
Beyond the increase in daytime charging, this April saw another increase in off-peak discharge; in fact, storage, on average, was discharging from dusk ‘til dawn. April’s mild temperatures and muted demand helped limit the need for strong net load peak discharging, ultimately shifting solar power all the way to the next sunrise.
We can also visualize the relative strength via heatmap, watching additional hours fill in with increasing battery operations year over year.
This increase in storage capacity has helped decrease price volatility during the net load peak. When in the past we have seen quick ramp-ups of more expensive thermal generation and pricier imports fill the gap, CAISO, at least in spring, has turned to storage.
The Balance of Interchange Tilts
CAISO’s imports are up significantly, breaking recent trends. From 2023 to 2025, CAISO had been a net exporter during the midday, sending out a wealth of its solar power to surrounding states. Even 2022 saw net exports at the absolute solar peak, but in April 2026, midday exports were imports. Neighbors to CAISO send dispatchable generation in both thermal and hydro generation into the region during periods that solar isn’t taking over their fuel mix.
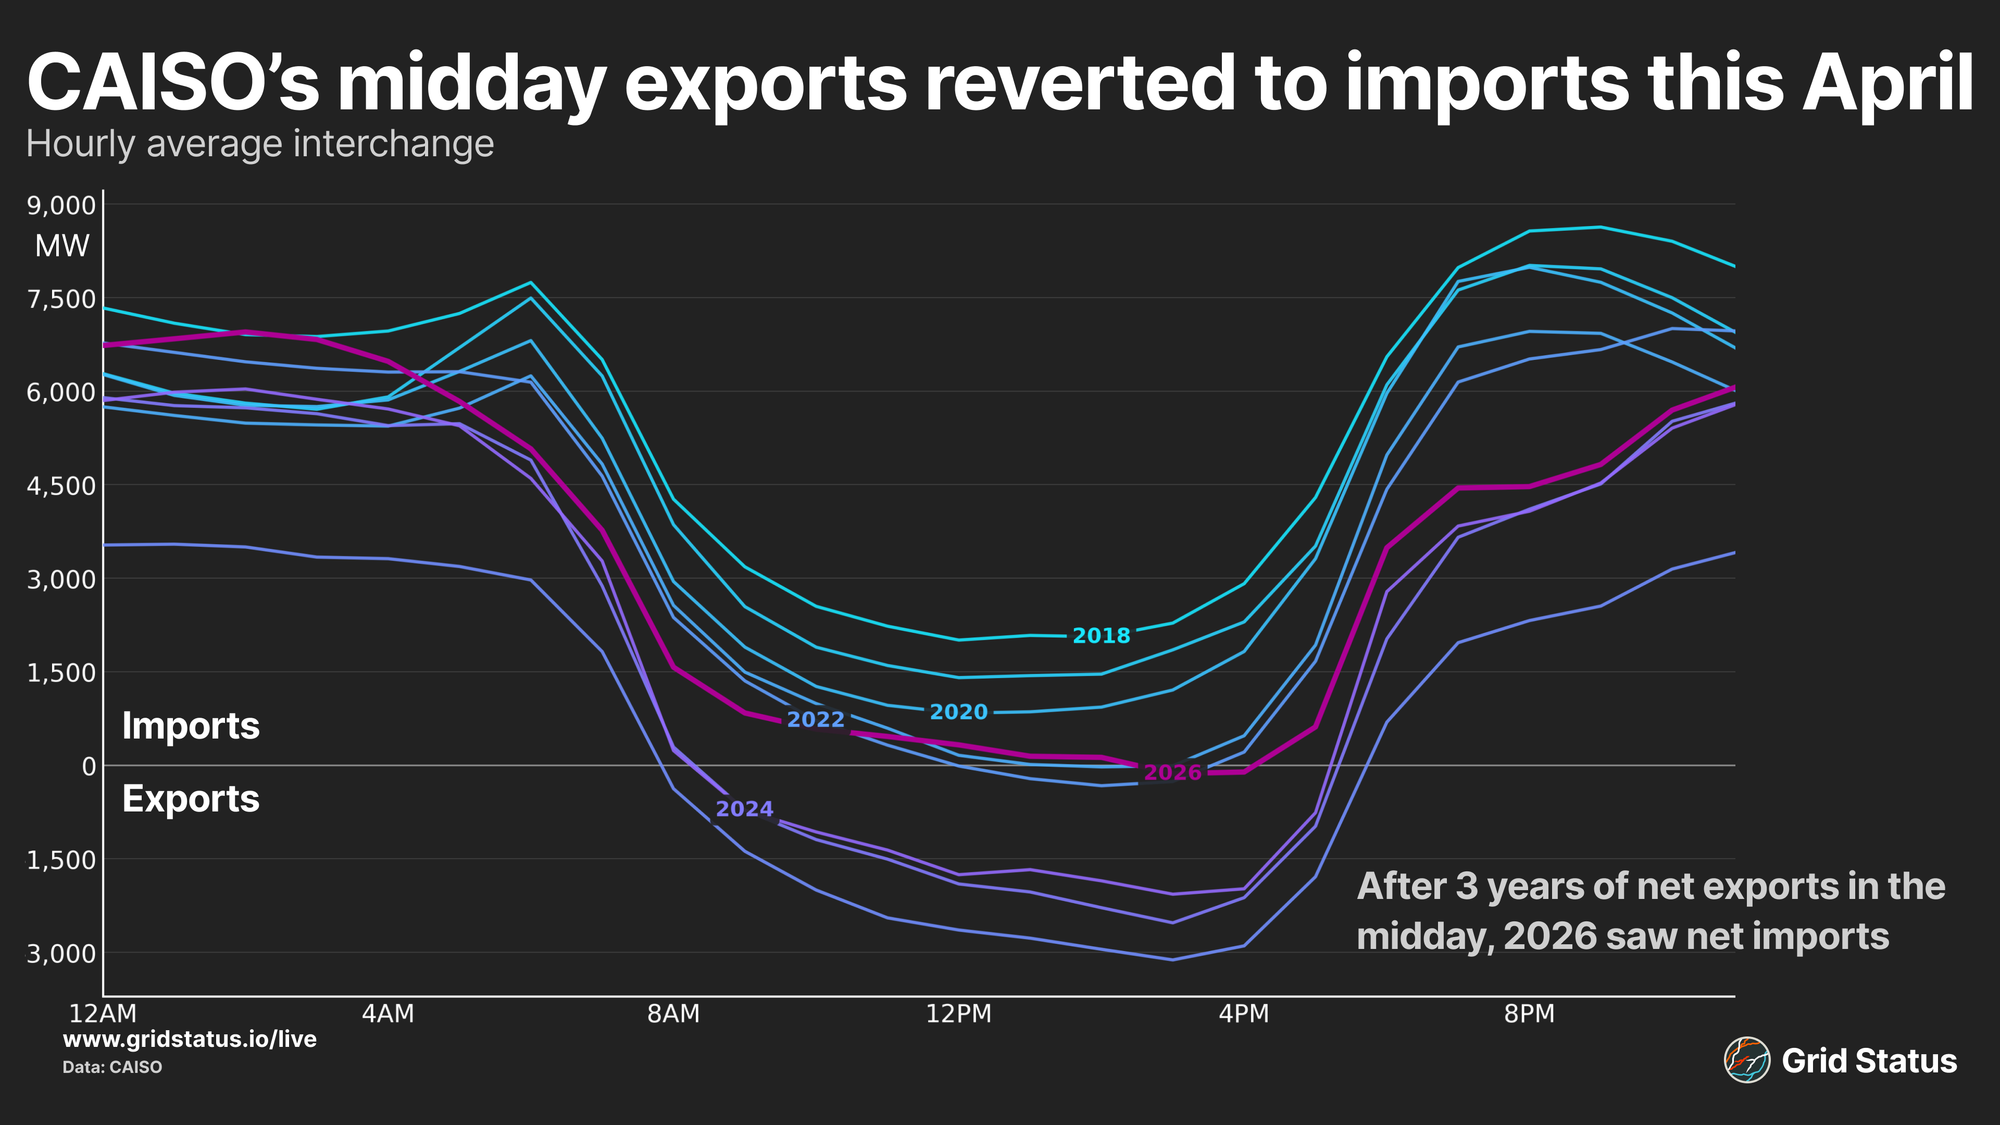
This interchange flip may be the result of surrounding balancing authorities catching the solar bug.

In the Desert Southwest, we see three Balancing Authorities (BAs: PNM, APS, and TEPC) midday solar increase by a total of 640 MW on average in April, which is certainly enough to start moving the needle, particularly with these regions ultimately injecting into the same oft-congested region of CAISO which heavily contributes to internal solar curtailment.
Exports increase around 14:00-16:00, which is actually the same time that wind curtailment also increases. We see this even on days when curtailments are low. Let’s revisit one of the solar record days, May 11th, when CAISO hit a new solar record, solar curtailments were low.
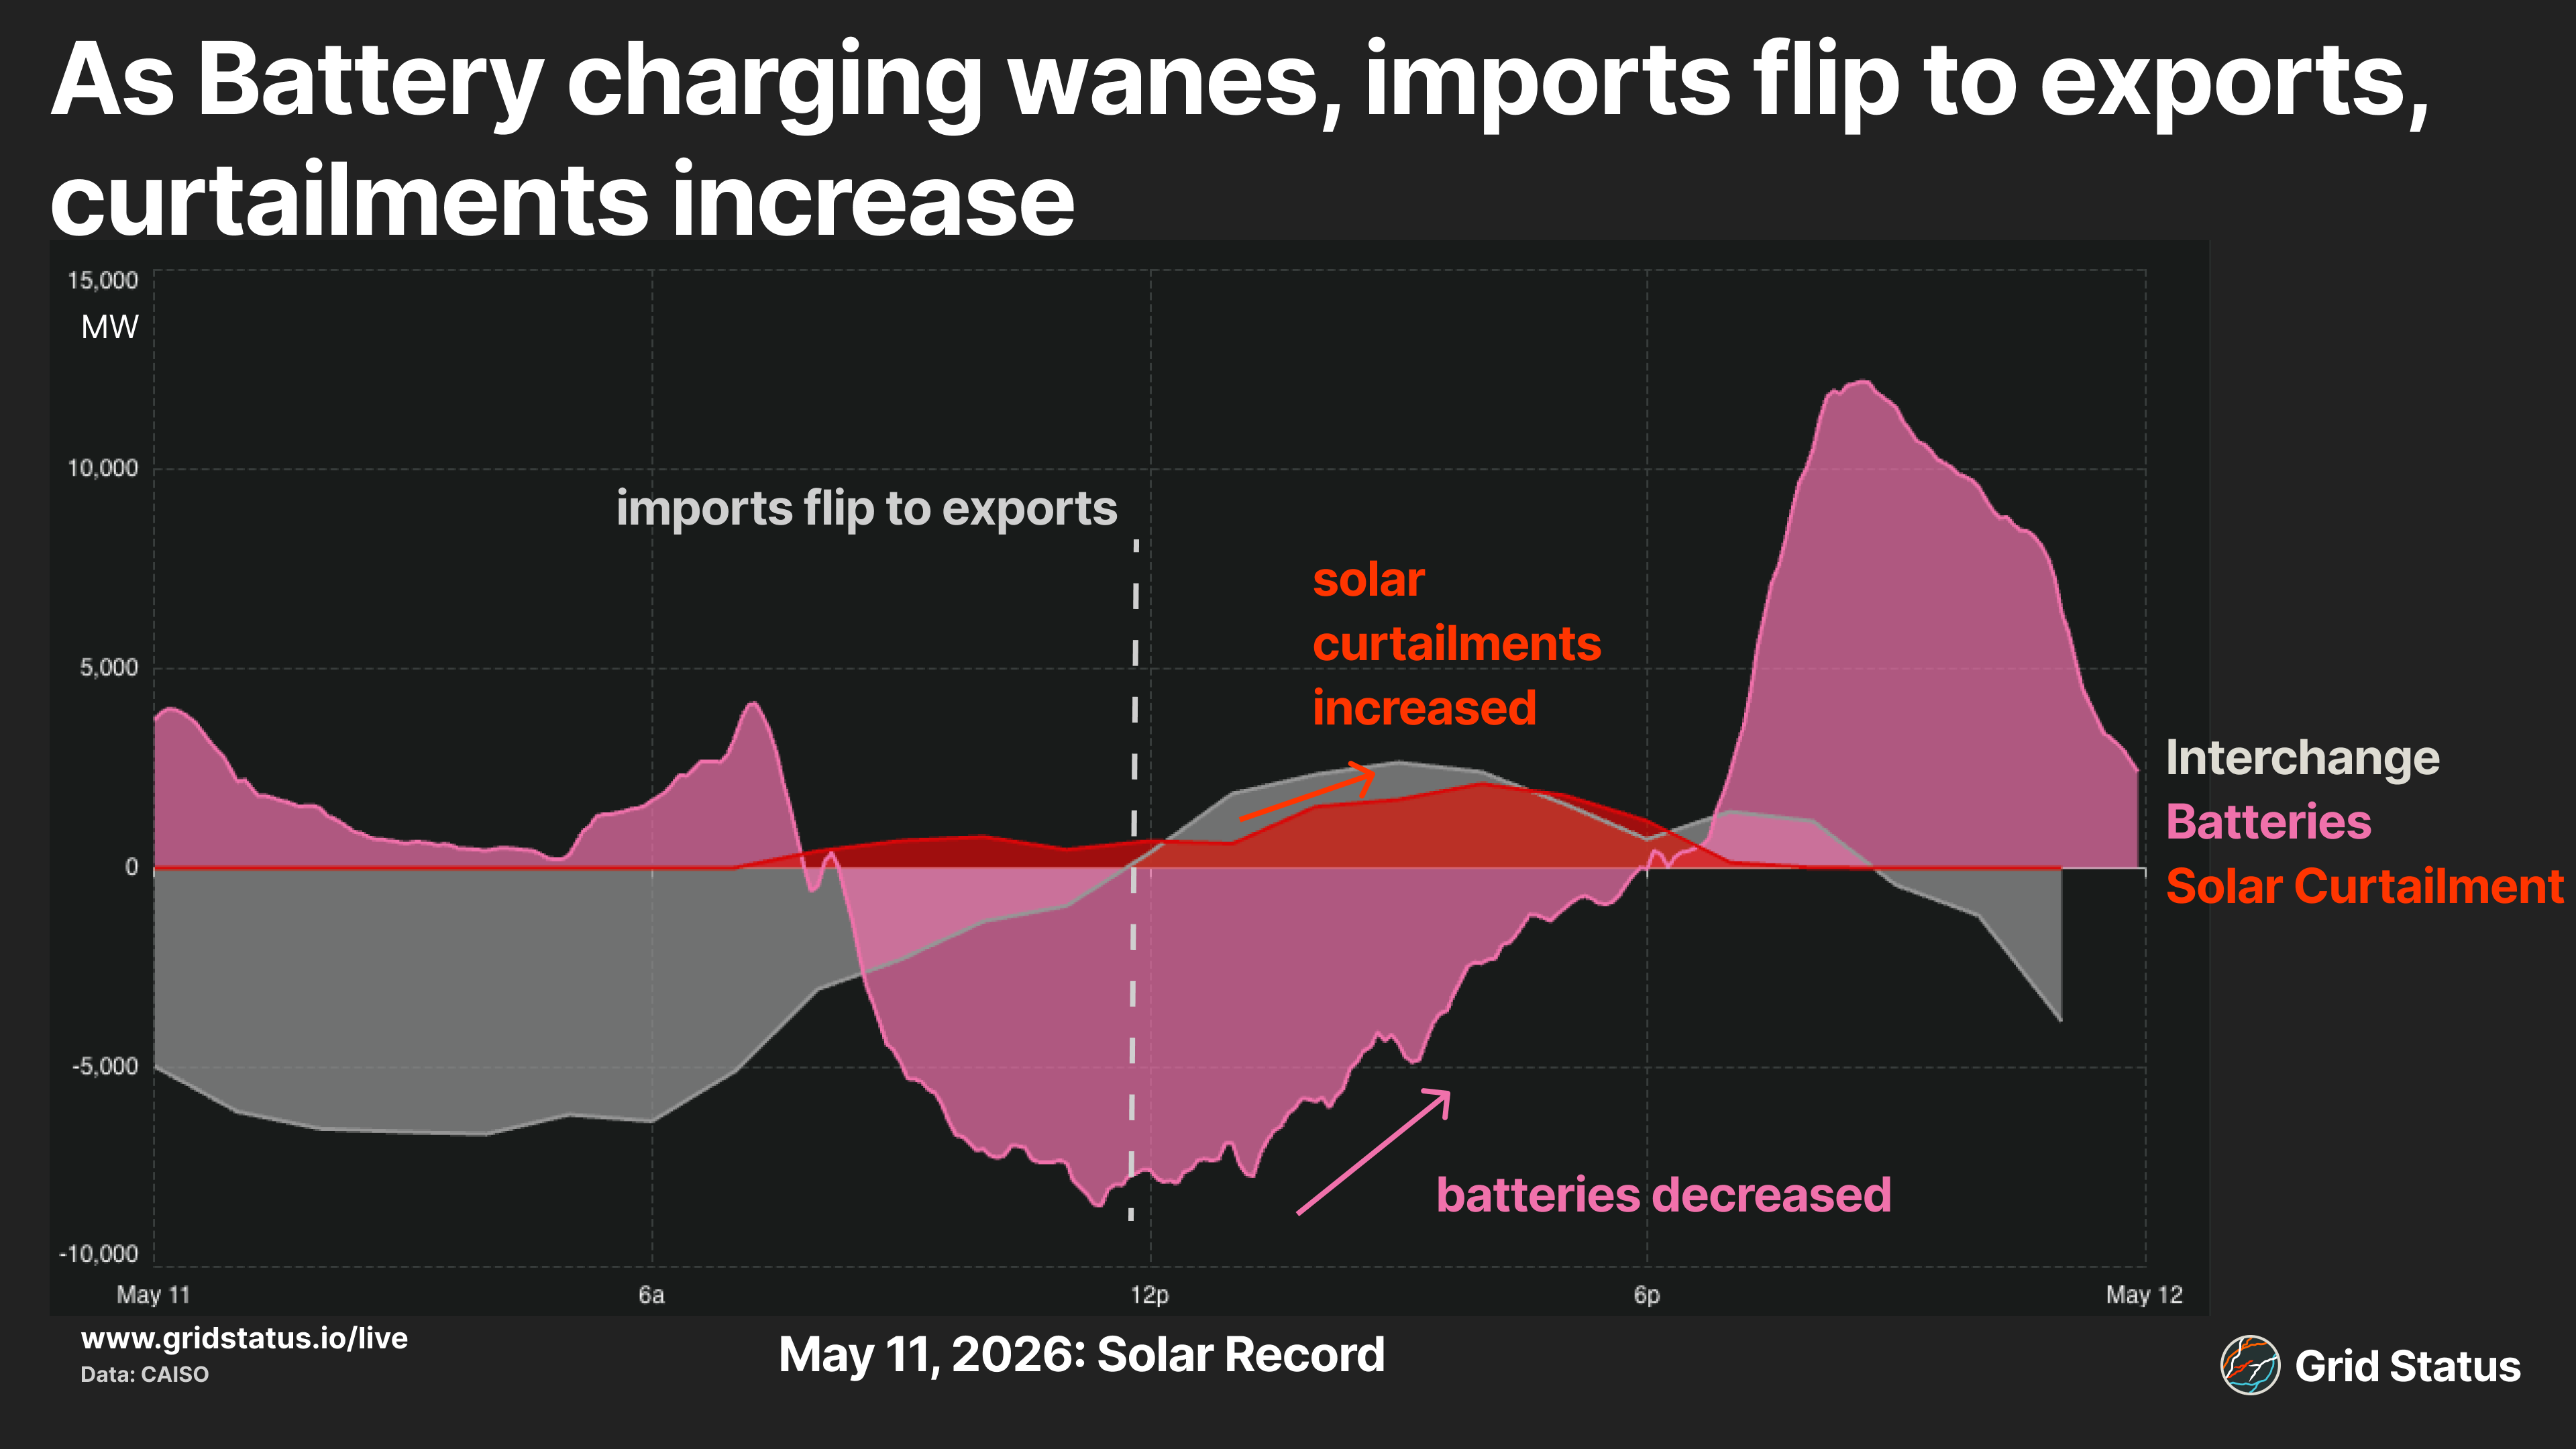
As battery charging began to wane, imports switched to exports, and solar curtailments began to pick up.
Low Tides and High Tides
Solar generation is down, wind is up, but what’s been happening with the rest of the fuel mix? Nuclear generation is actually up year over year since Diablo Canyon was on refueling last spring, leading to an average increase of 684MW, about 43% more nuclear power online this year.
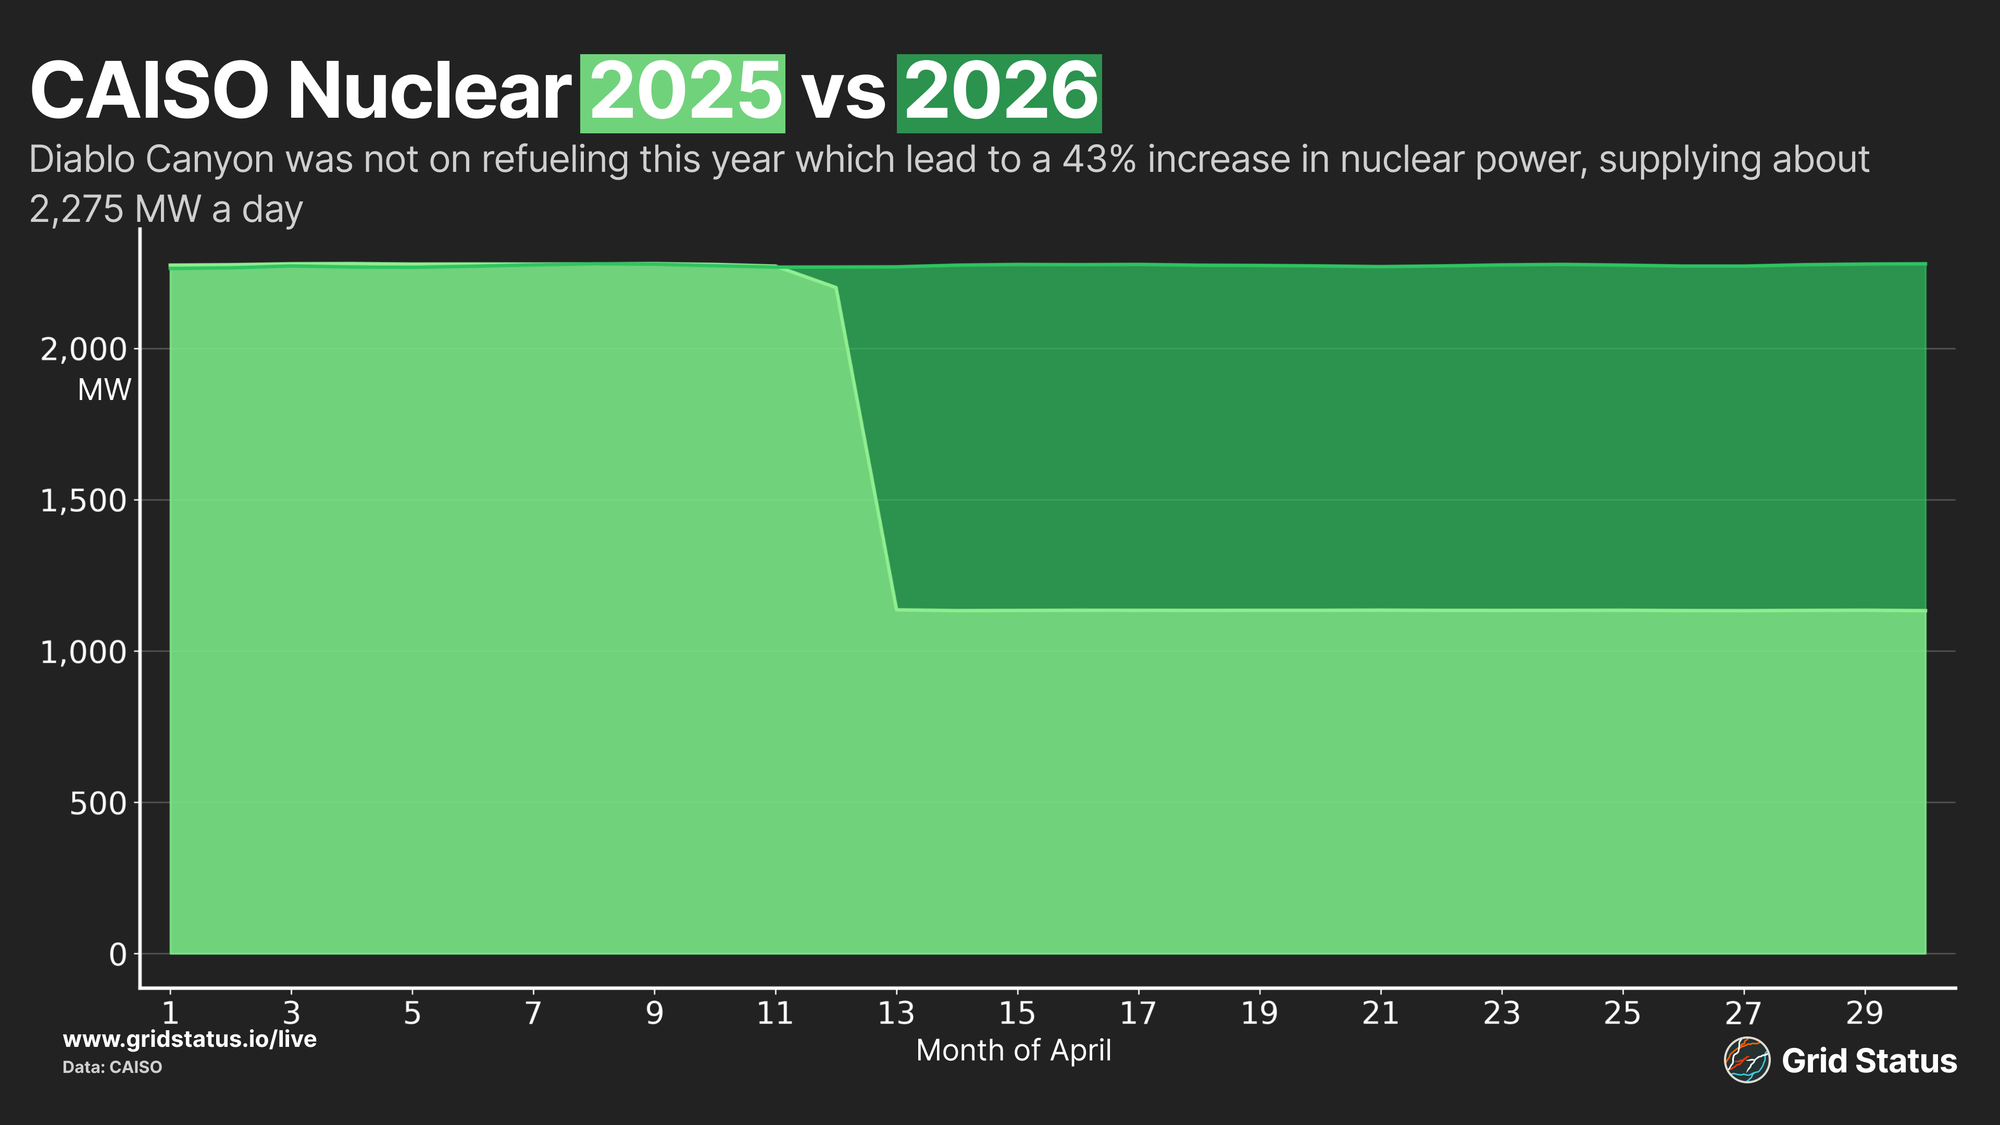
2026 joins 2023 as the only other year in the last five where one of the units did not go on outage during April. This lack of outages is particularly obvious in our new Trend Analysis app.
Large hydropower went in the other direction, down 550 MW on average year-over-year despite healthy reservoir levels in the region. Drought conditions were also lessened by fairly significant rain to start the year, although snow-water equivalent in terms of remaining pack was low through the winter season and remains slim.
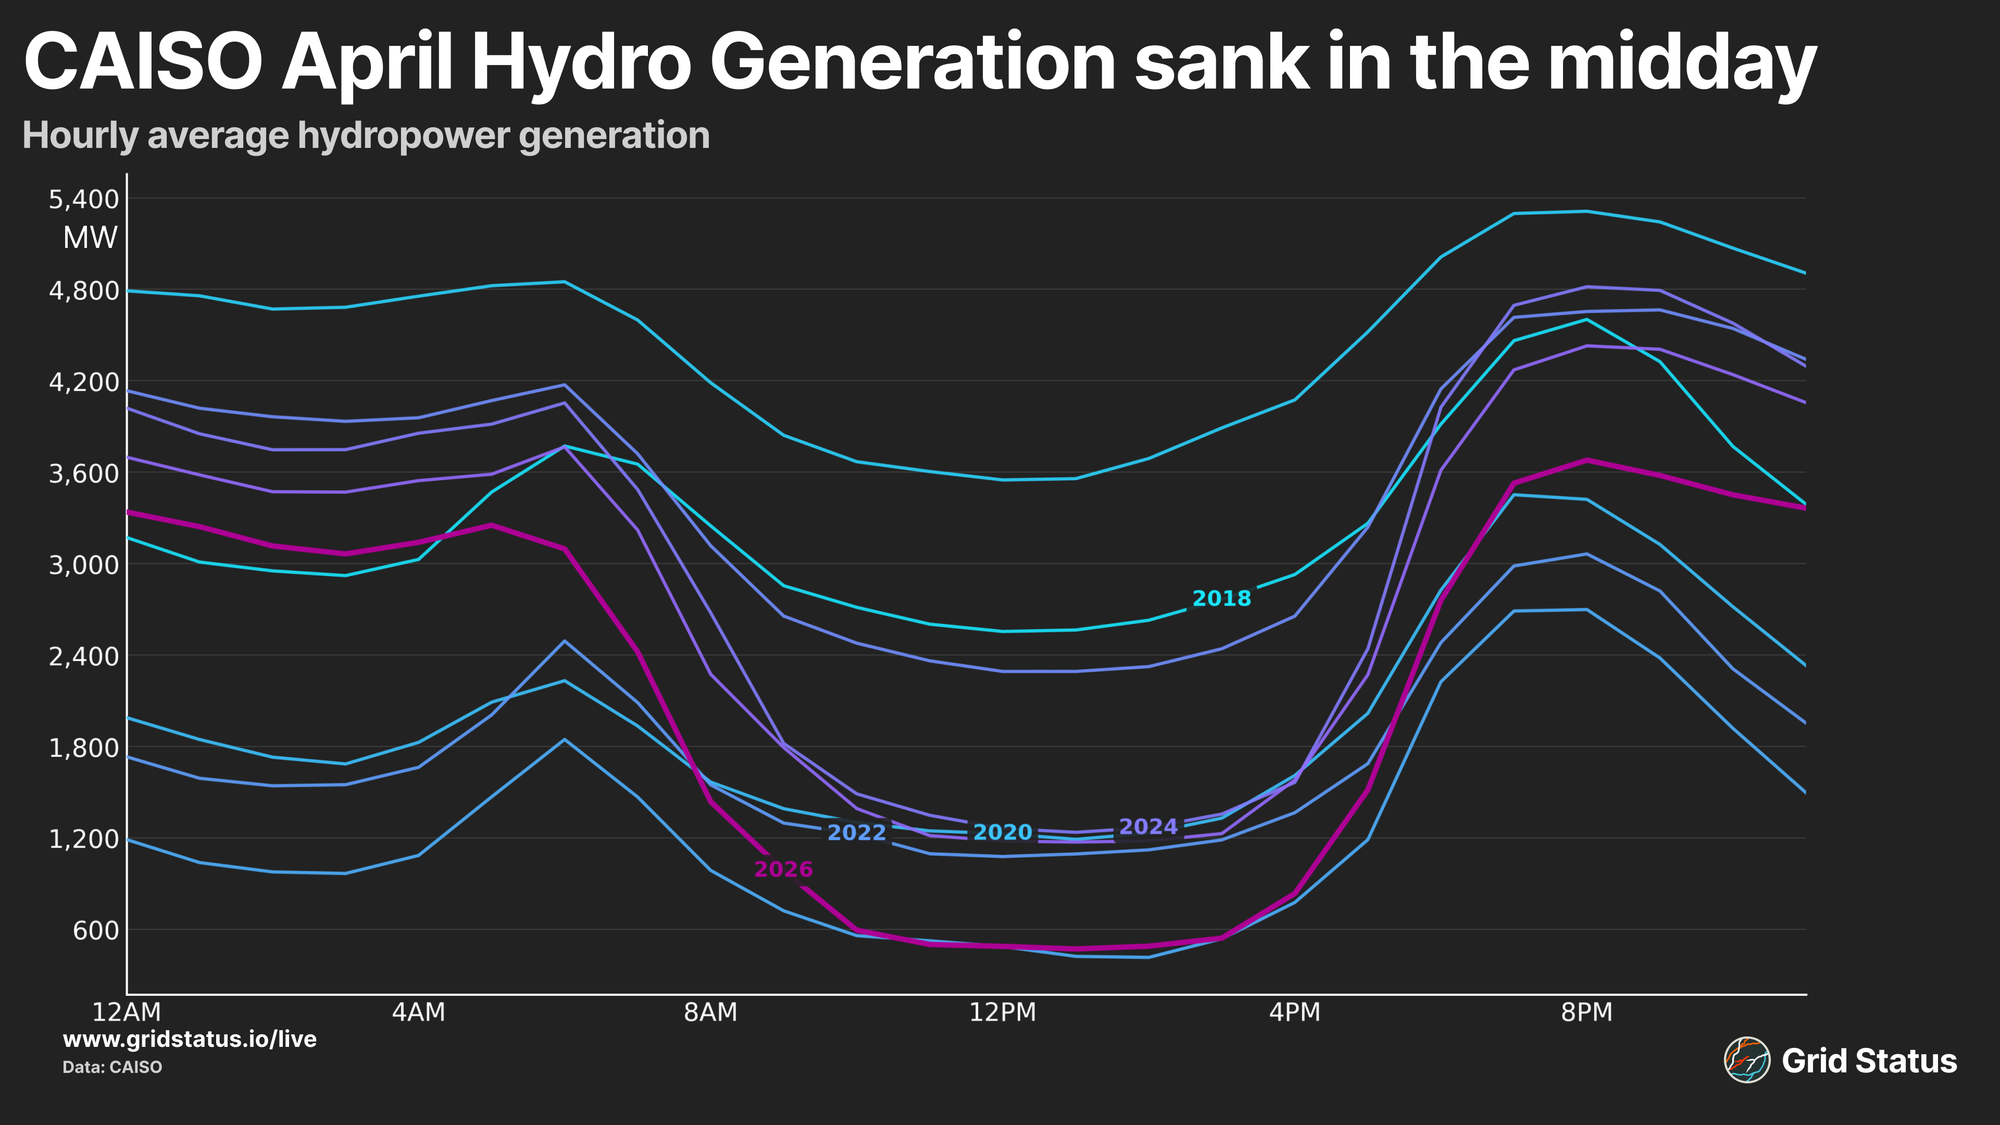
The off-peak in 2020-2022 (when drought was prevalent) saw lower levels than recent years 2023-2025 (when drought conditions were less severe). California’s reservoir-based large hydropower facilities manage water over disparate seasons on an annual basis, so reduced output despite full reservoirs can indicate the look-ahead pressure of the hydrological year.
Natural gas generation continues to decline, and fell precipitously over the evening and overnight periods compared to 2024 and 2025. Here, we see a familiar story, solar pressuring gas during midday, then battery discharge shifting solar later, a period which now extends through the evening.
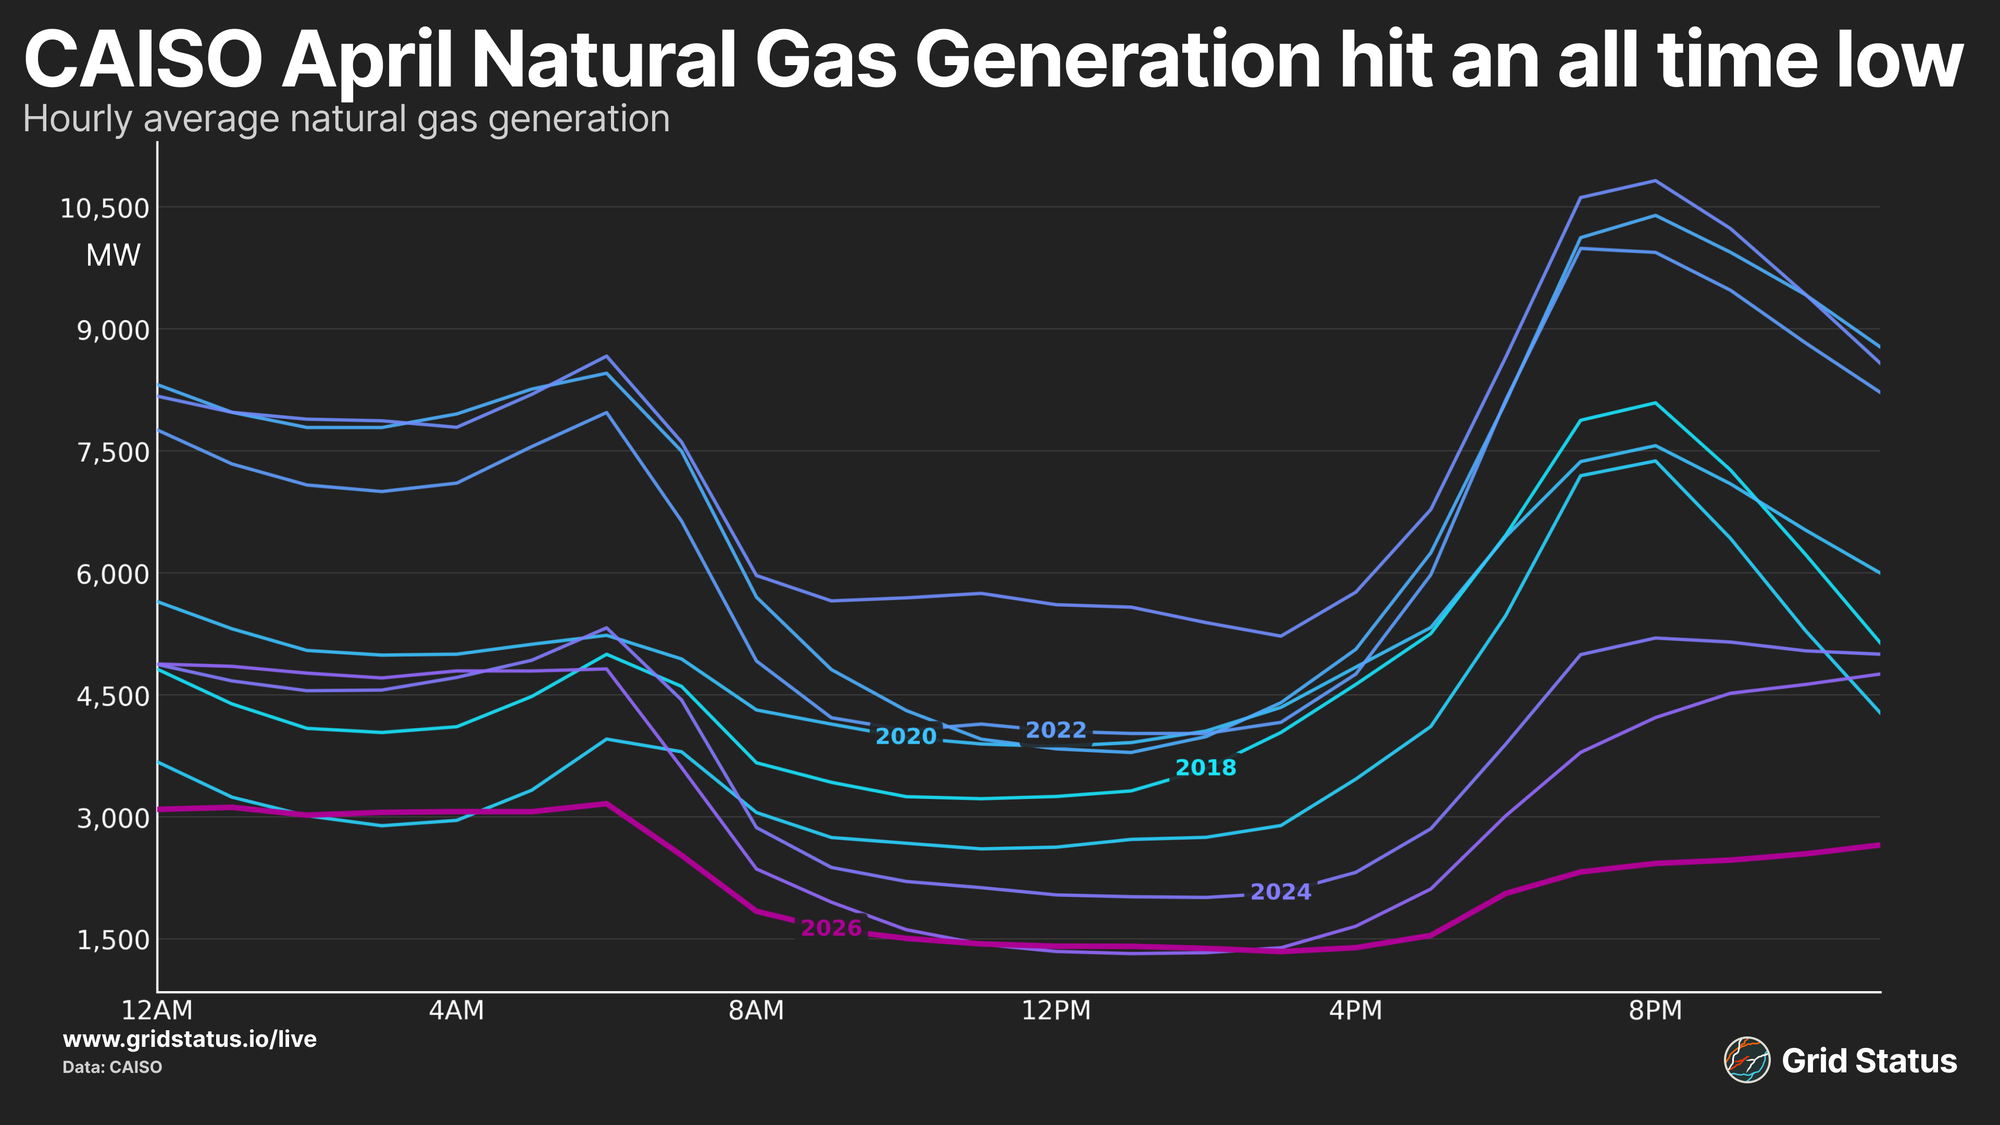
Beyond the one-two punch of solar and batteries, the every-hour increase in wind, the return of all units at Diablo Canyon, and increased imports all likely contributed to the decline in CAISO gas generation.
Structurally, the flatness of the overnight period is striking, suggesting units running to stay online rather than dispatching to meet ramps or other regular fluctuations.
Hot Rocks, Cold Basis
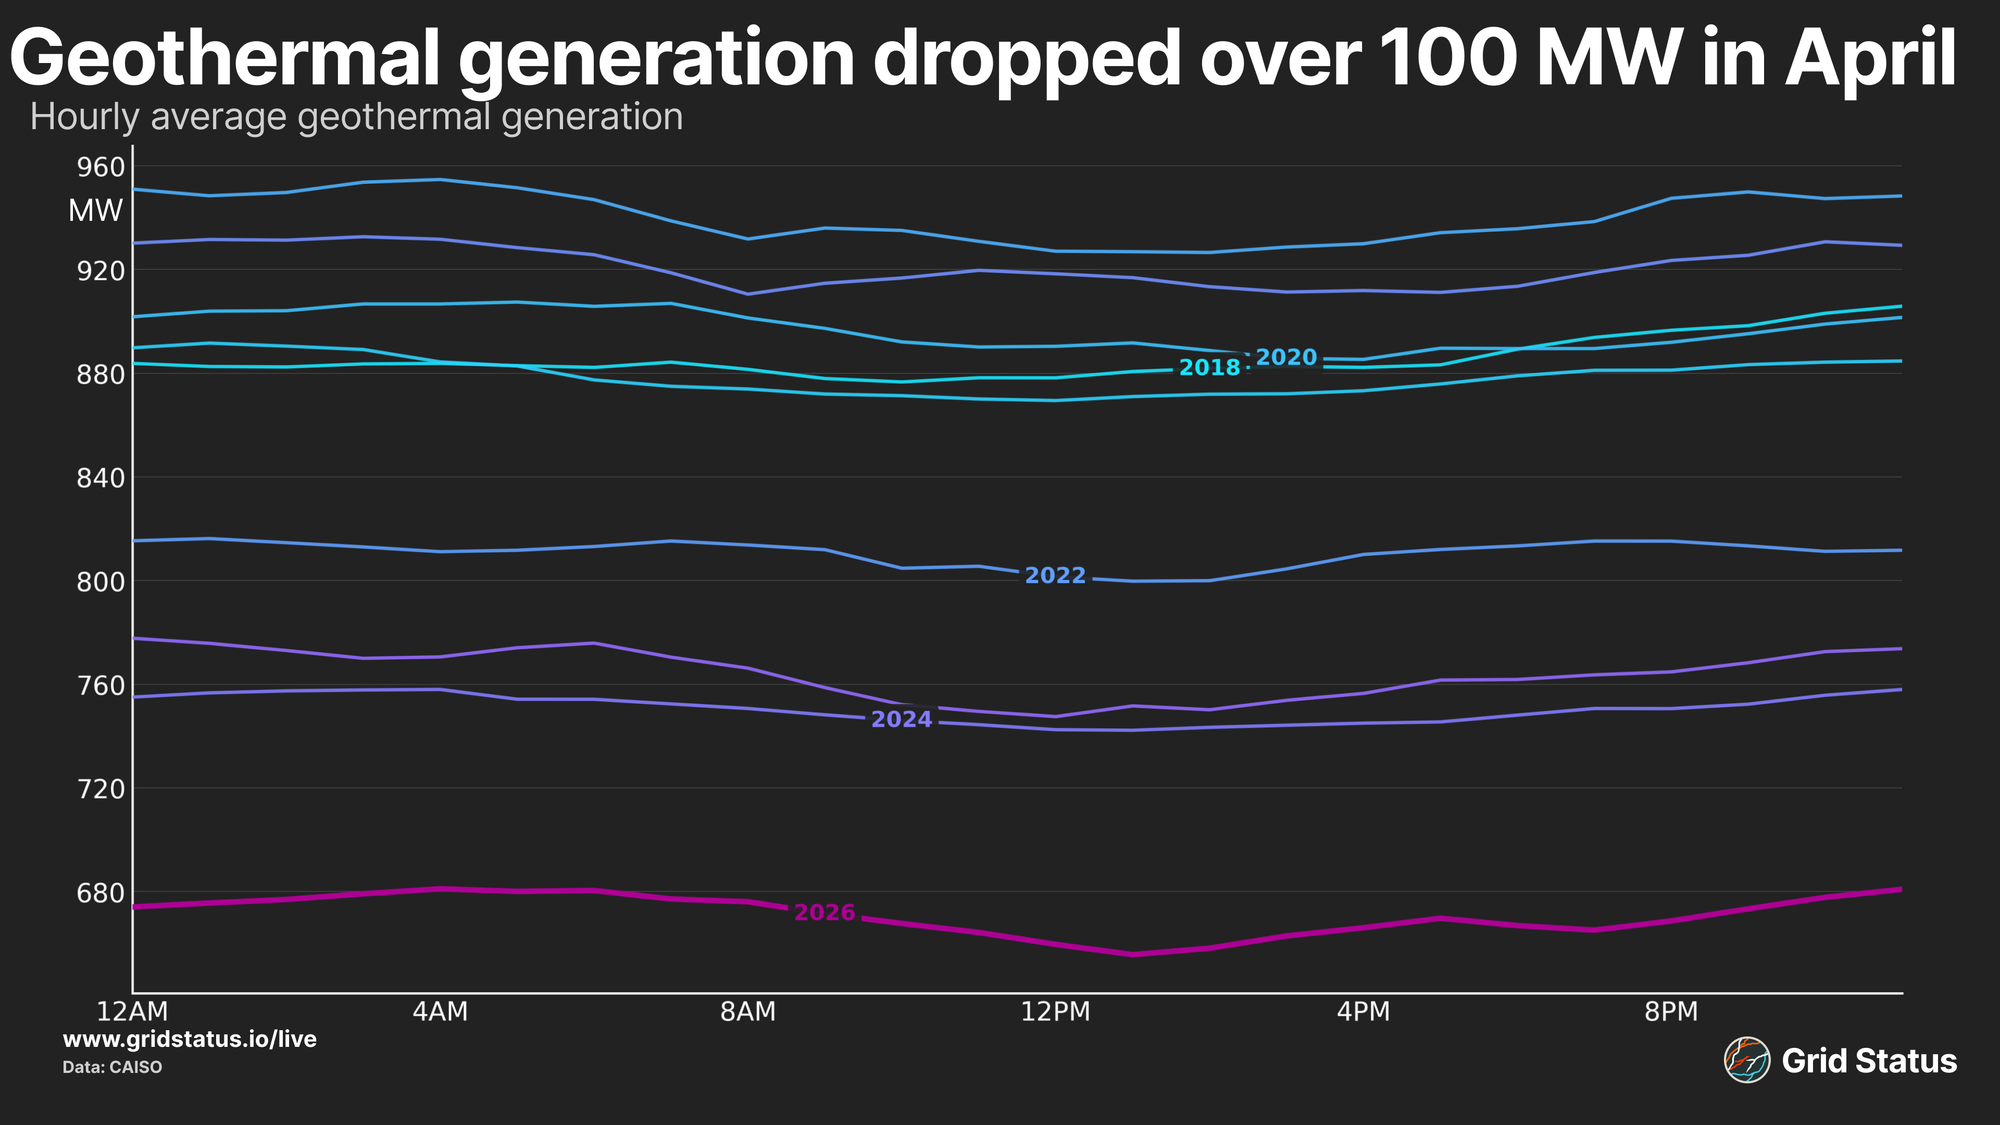
On a relative basis, geothermal took a particularly large hit in the fuel mix, with average hourly generation falling to new lows well below every previous year in the range, dropping 100 MW year-over-year.
Aside from the potential impacts that could result from unit outages, one of the state’s largest geothermal plants was subjected to prolonged periods of negative congestion.
The Geysers, located north of San Francisco, saw extreme downside throughout much of April in both the real-time and day-ahead markets. GEYSER11_7_B, which represents one of many generating units at the sprawling complex, saw its average Dya-Ahead (DA) and Real-Time (RT) LMP below $0 for the majority of the month.
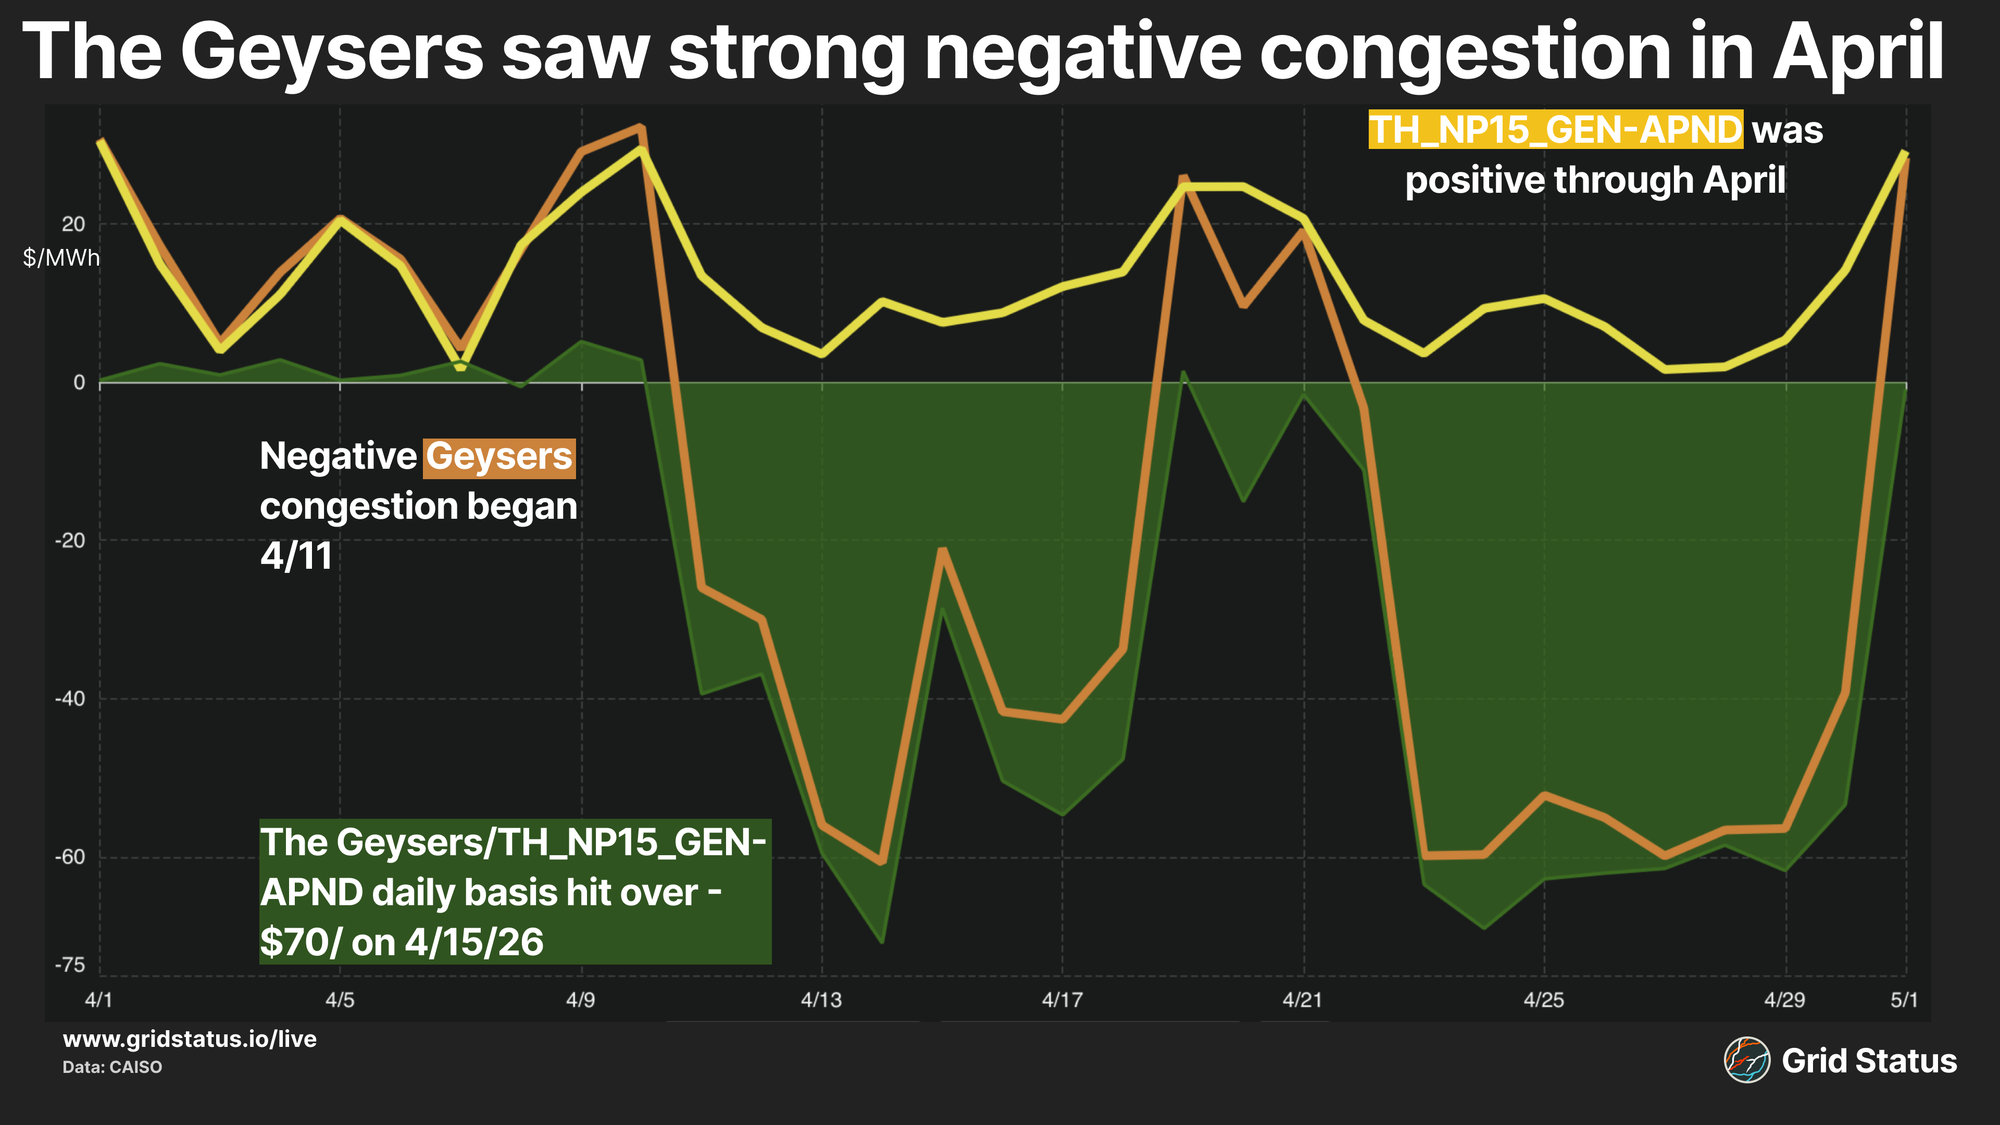
This extended downside, including daily averages dropping as low as -$60/MWh, could have driven a drop in unit-level output in response.
Going Behind Behind the Meter
California’s solar growth has not been limited to utility-scale solar, as the state is also home to the largest amount of BTM solar generation.
Unlike other regions, CAISO does not generate its own public BTM solar estimate, though this gap has been filled by the California PUC.
Through 2025, California added another 1,780 MW of new BTM solar installations statewide, which includes BAs not in CAISO, such as LADWP, bringing the total installed capacity to 18,011 MW at the end of the year.
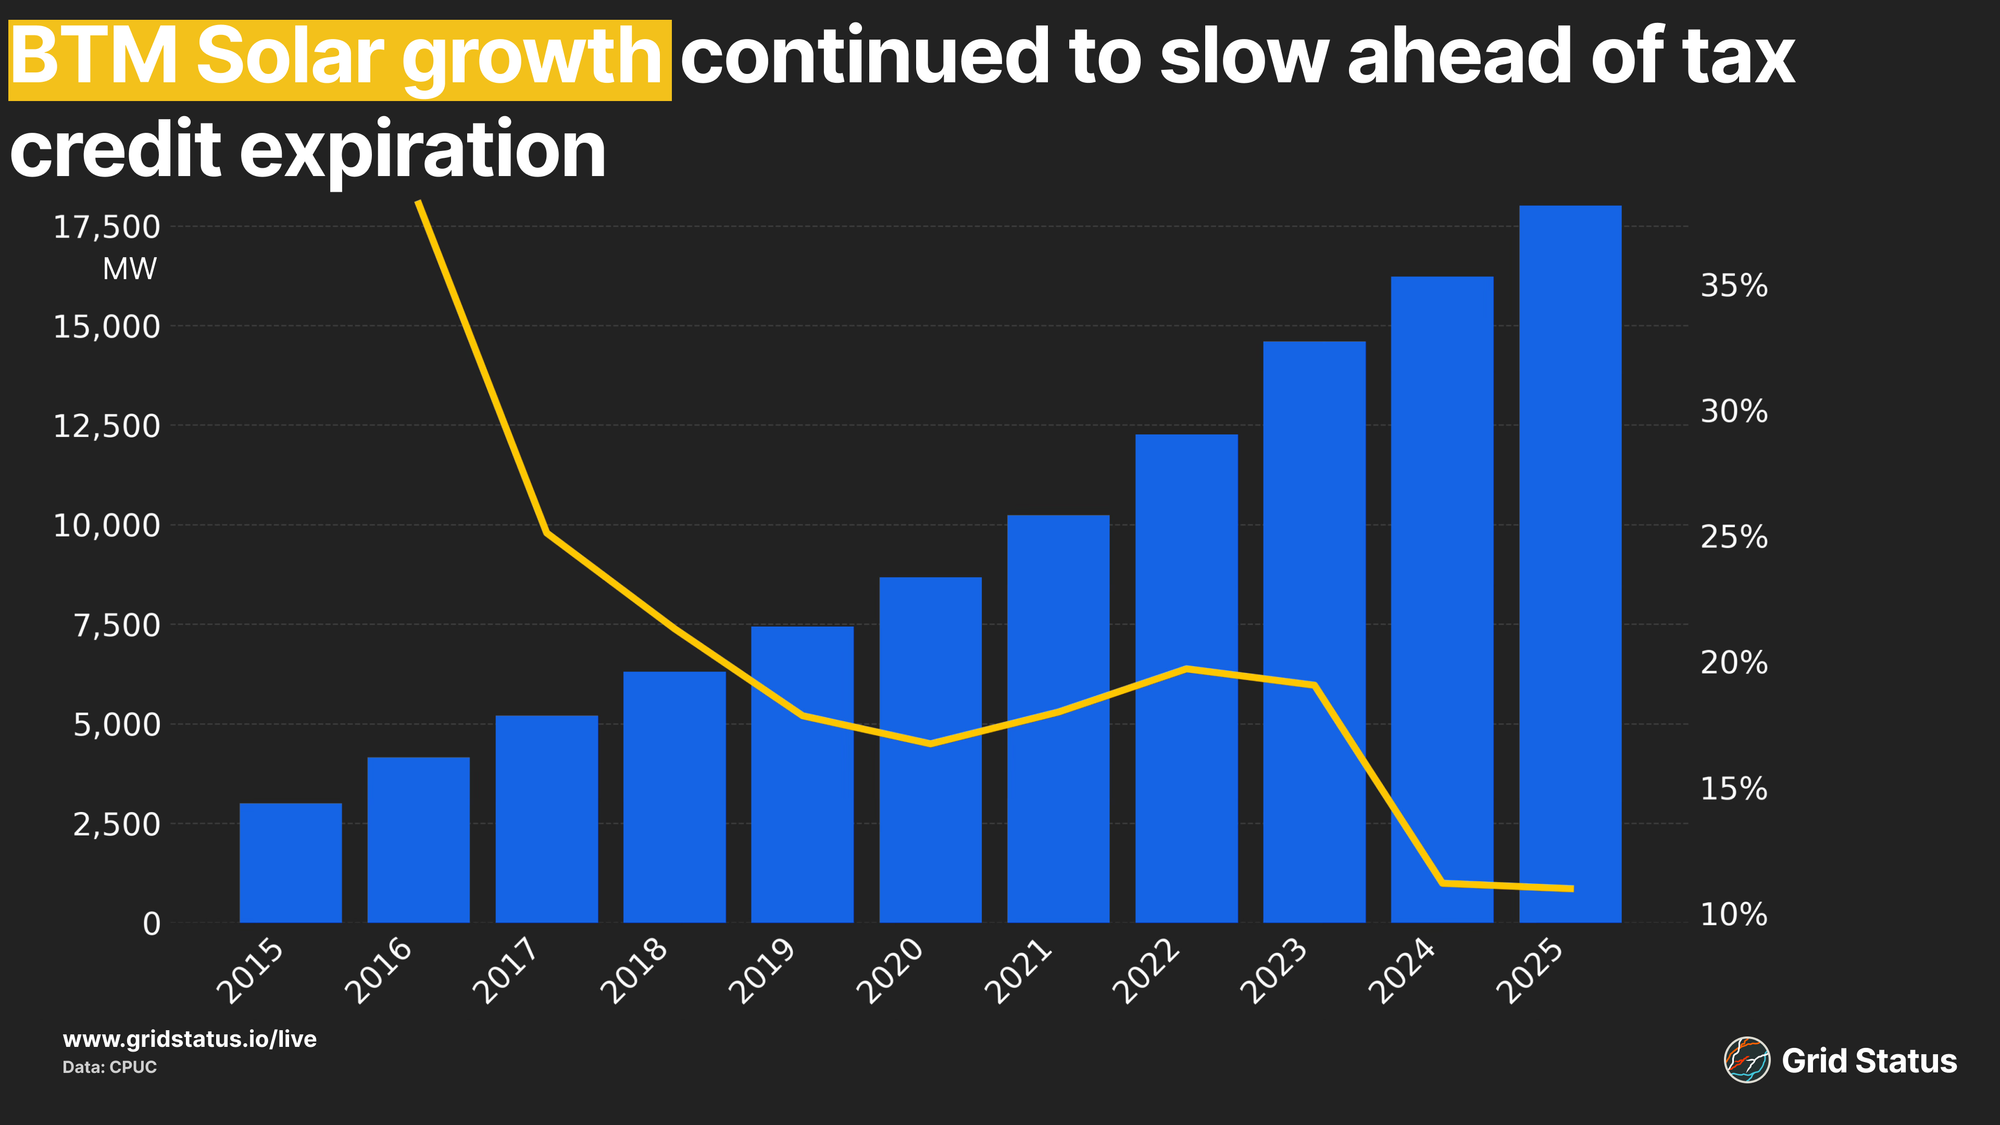
While the state continues to see new builds, the rate at which new BTM systems have come online has slowed yet again. This slow growth is somewhat surprising, as 2025 was the final year that residential consumers were able to claim a 30% tax credit via the 25D program on customer-owned systems, though third-party-owned installations can still claim the credit through 2027. Despite the end of these credits, we did not see a large increase in new residential installations ahead of the deadline as we did before the beginning of NEM 3.0.
Speaking of NEM 3.0, the uptick in battery storage seen after the net metering credit changes came into being has continued. As we noted in last year’s blog, NEM 3.0 changed the compensation system owners received for energy put back onto the grid. This change in net metering, which had previously allowed for the grid to effectively be a battery for BTM systems, incentivized the addition of battery storage.
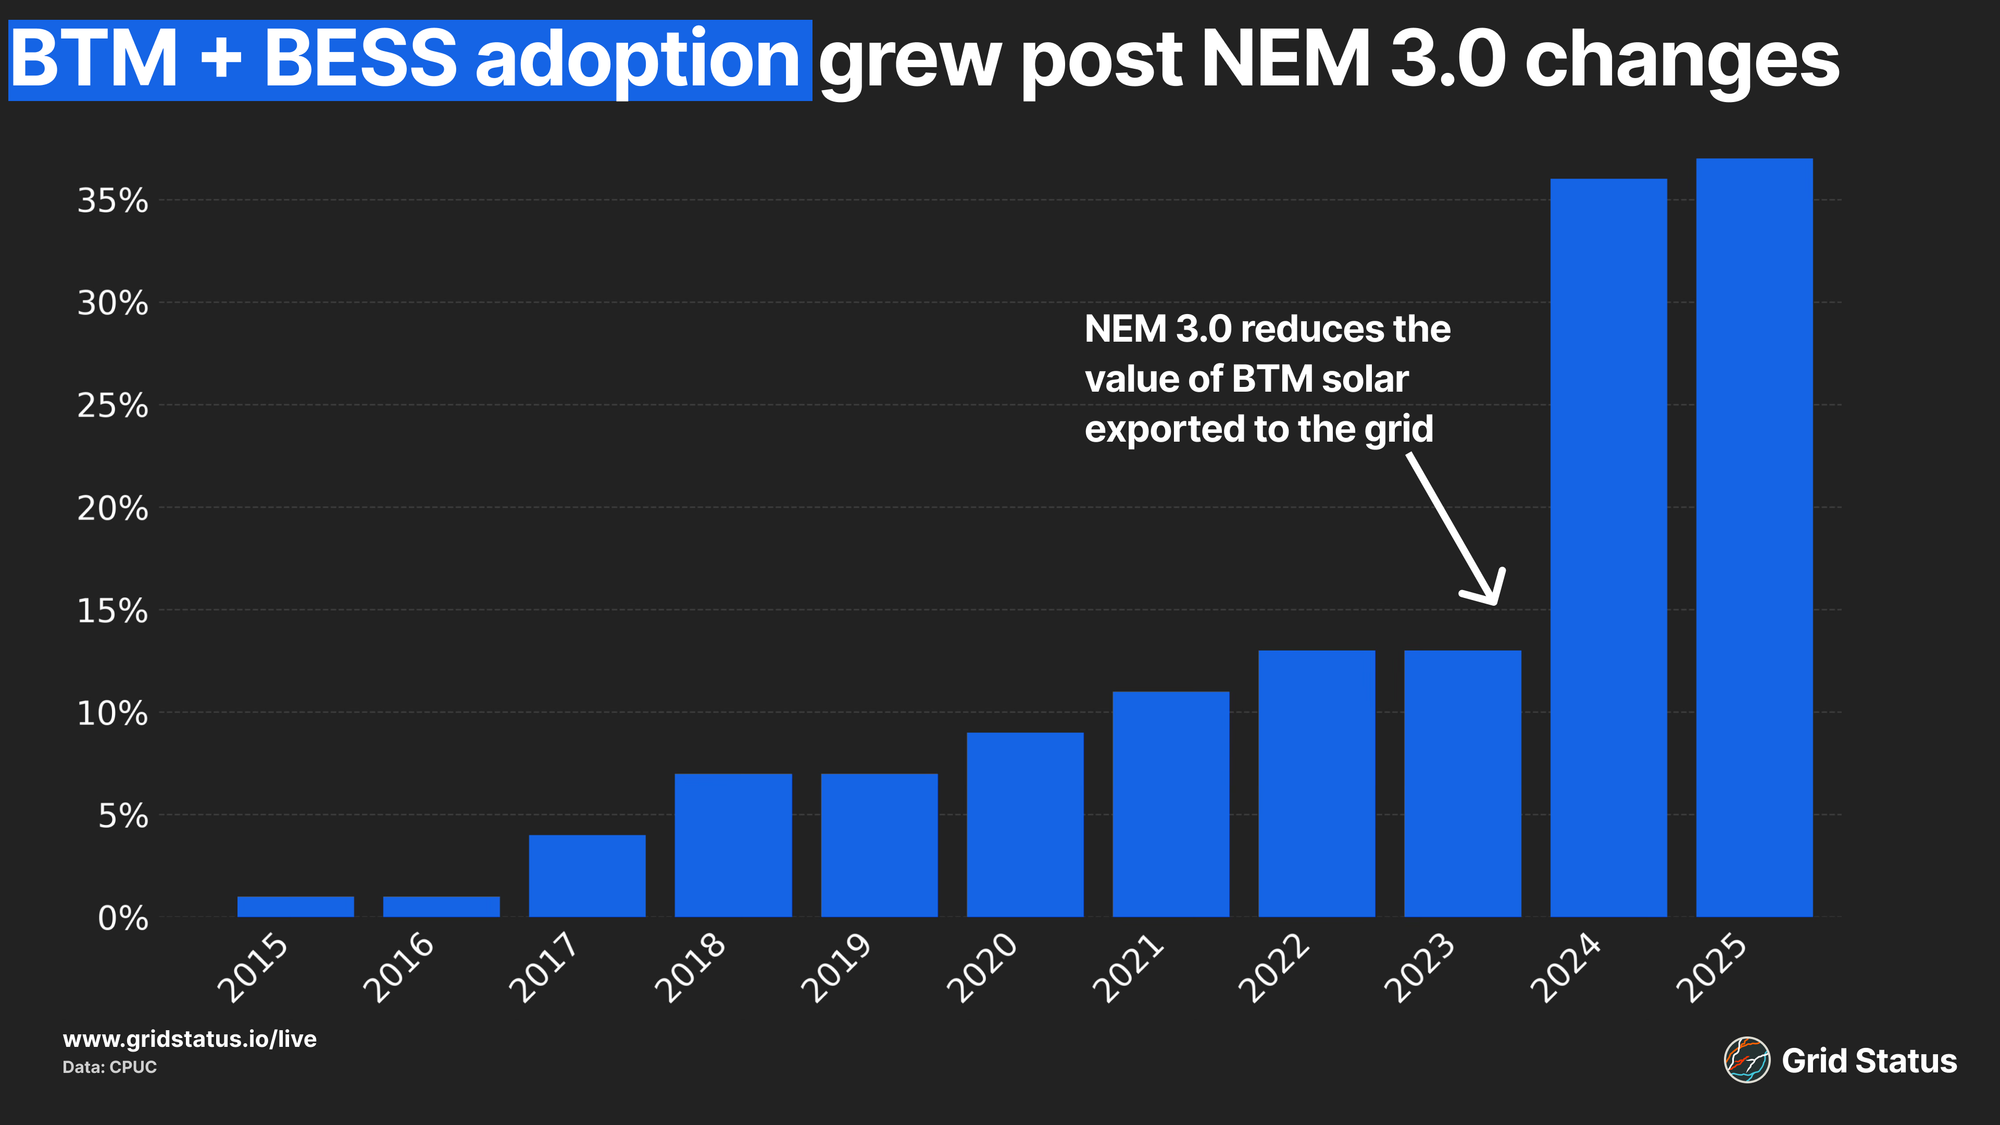
Adoption has stayed steady since the NEM changes went into effect, with 37% of new BTM systems coming online having battery storage, bringing BTM BESS capacity to 1,628 MW at the end of 2025.
To the Future
This April saw counterintuitive outcomes, incremental progress, and larger leaps. Rarely does a single year-over-year comparison result in such brightline shifts across nearly every fuel. The question going forward is whether this April was an outlier or indicative of consistent future trends.
Alongside CAISO’s own evolving fuel mix, the march of day-ahead markets across the West is now in full swing, bringing price convergence to formerly real-time-only balancing authorities and exposing more of the market to greater coordination. How California’s own goals weather or break upon the rocky shores of market integration remains to be seen.
As we enter summer across the country, track records and forecasts, and monitor the markets with our Live Pages and Insights.